What changed
See what you changed on your site — notes, deploys, changelog entries and campaign sends — next to that day’s visitors on the trend chart.
What it does
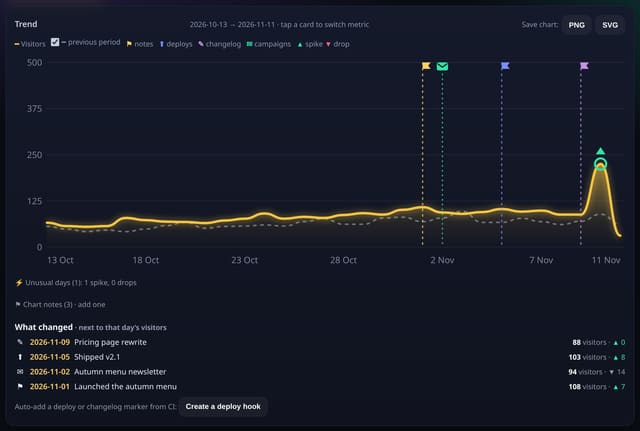
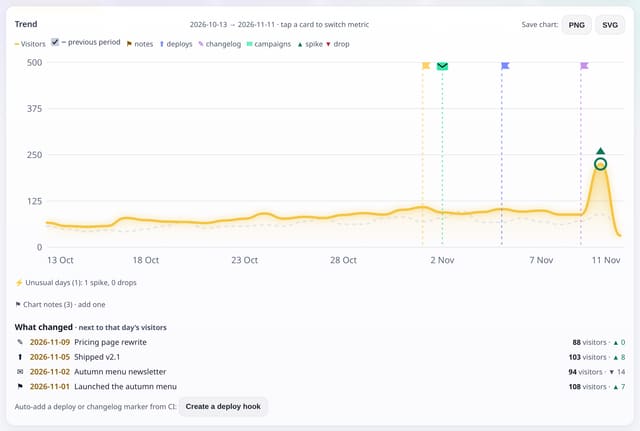
A What changed list under the Trend card gathers your existing chart notes, new deploy and changelog markers, and campaign send dates, each shown with that day’s visitors and the change from the day before. The same items appear as coloured flags on the chart. The Chart notes form is still there: add a note, a deploy or a changelog entry by hand, or create a hook URL so CI can POST a short label when you ship.
Why it matters
A spike or a drop is easier to explain when the deploy or the post that may have caused it is sitting on the same chart.
How to use it
- On your dashboard, open Chart notes under the trend chart. Add a note as before, or choose Deploy or Changelog and type a short label.
- To mark deploys from CI, click Create a deploy hook and POST a JSON body to the URL (token shown once). Use kind "deploy" or "changelog" and a short text label — no personal data.
- The What changed list under the chart shows each marker next to that day’s visitors, including campaign send dates you already track.
How it works
- On the Trend card, open Chart notes and add a note, or pick Deploy or Changelog and type a short label (for example v1.4 or “Pricing rewrite”).
- Or click Create a deploy hook and add a POST from CI to that URL. The body can be {"kind":"deploy","text":"v1.4"} or {"kind":"changelog","text":"…"}. The token is shown once. Nothing about a person belongs in the label.
- The What changed list shows each marker next to that day’s visitors. Campaigns you already added keep their ✉ markers and are included in the list.
Privacy
- Collected: The date and the short label you (or your CI hook) send
- Collected: The visitor total already on the chart for that day
- Not collected: Source code, commit messages, or anything about a person
- Not collected: Payloads beyond an 80-character label
- No cookies, and nothing stored on the visitor’s device.
- Reports show totals only: never a visitor list, IP address or single visit.
Limits
- Up to 200 markers per site (the same cap as chart notes)
- The hook accepts 20 posts per site per day
- 1 row per marker; no bulk writes
- Core script.js is unchanged (845 B)
Plans
Every plan, including Free. quietstats is free during launch: the Free plan covers 1 site and 5,000 pageviews a month, and no card is needed. See pricing.
Questions
Does this replace chart notes?
No. Chart notes, the add form and delete buttons stay. What changed is a timeline of those notes plus deploys, changelog entries and campaign sends, with traffic beside them.
Will you fetch my changelog or my git repo?
No. A changelog marker is one you add, or one your hook posts. We never pull a feed or a repository.
Is the hook public?
The URL contains a secret token. Only the hash is stored. Revoke it at any time. Posts that look like personal data are refused.