Save the trend chart as an image
Save the trend chart you are looking at as a PNG or SVG image, ready for slides, a report or a post.
In every plan, including Free. Reports, sharing and alerts.
What it is
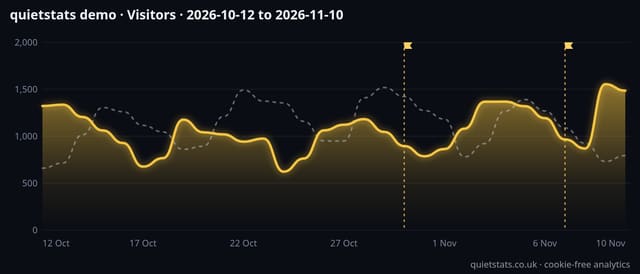
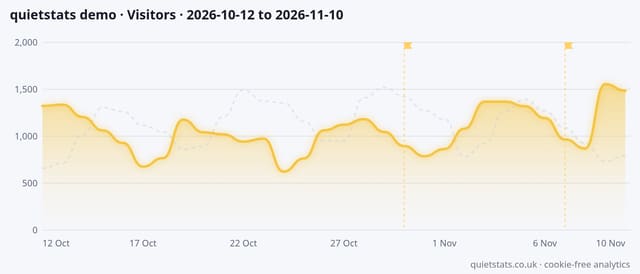
Two small buttons on the Trend card of your dashboard, the demo, public stats pages and report links. They save the chart that is on screen: the metric you picked, the dates, and the comparison line, notes, campaign and spike markers if they are showing, with a title (site, metric, dates) and a small quietstats.co.uk footer.
Why it matters
A chart in a deck or a client update says more than a table, and a screenshot of a whole page needs cropping. PNG drops straight into slides, email and chat; SVG stays sharp at any size and can be edited in design tools.
How it works
- Pick the date range, filters and metric you want on your dashboard.
- On the Trend card, tap PNG or SVG next to Save chart.
- Your browser builds the image from the chart already on the page, in your current theme (dark or light), and saves it as quietstats-site-metric-dates.png or .svg.
- Nothing is sent to quietstats or stored.
Privacy: what is and isn’t collected
Collected
- Nothing: the image is made from the chart already on your screen
- No image is stored or sent anywhere
Never collected
- Cookies, localStorage or anything else stored on the visitor’s device
- IP addresses or user agents (used in memory, then discarded)
- Anything that links a visitor across days (the visitor ID resets daily)
Rows and limits
- 0 script bytes, 0 rows written or read
- Saves the Trend chart; for whole reports use Print or PDF
- PNG is twice the on-screen size so it stays crisp on slides
- Hover details are not part of the image
“Rows” are database rows written, which is what our hosting is billed on. Reads are not rows written. Methodology →
Questions
Light or dark?
The image uses the theme you have on screen. Switch theme first if you want the other one.
Can I edit the SVG?
Yes. It is a standalone SVG with the colours and fonts written in, so Figma, Illustrator, Inkscape or Keynote can open it.
Does it work on a phone?
Yes. The file goes to your downloads (on iPhone, the Files app).
Related features
Set it up
Nothing to set up: it works with the standard one-line script.
<script data-host="https://quietstats.co.uk" data-dnt="true" src="https://quietstats.co.uk/js/script.js" id="YOUR_SITE_ID" async defer></script>Try it on your own site
Free during launch: one site and 5,000 pageviews a month, no card needed. After launch, paid plans start at £5 a month.