Traffic forecast
See roughly how many visitors to expect over the next 7 and 14 days, with a likely range and the direction of travel.
In every plan, including Free. See your traffic.
What it is
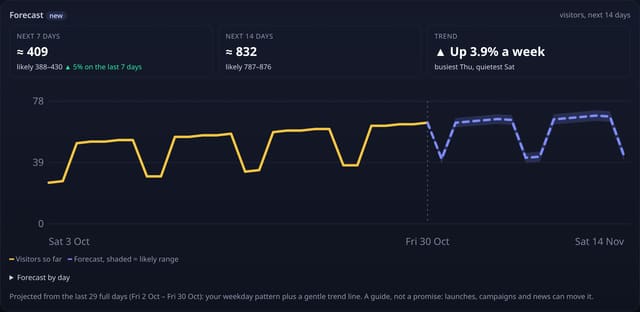
A Forecast card under the trend chart: visitors expected over the next 7 and 14 days, a likely range for each, whether traffic is trending up or down per week, your busiest and quietest weekday, and a chart that carries the last four weeks forward as a dashed line with a shaded range. A table lists the forecast day by day.
Why it matters
Planning a launch, a sale or a newsletter is easier when you know what a normal week looks like. The forecast also makes a real change obvious: if a week lands well outside the shaded range, something happened.
How it works
- Uses the daily visitor totals already on your dashboard: no extra tracking and nothing new stored.
- Takes up to the last 56 full days since tracking started (today is left out because it is not finished), works out your weekday pattern, then fits a gentle trend line.
- The trend is damped by half, so one good week does not run away with the projection.
- The shaded range covers about 8 in 10 past days; it widens the further ahead it looks.
- Shown when the date range runs up to today and has at least 10 full days with data. On shorter ranges the card offers a one-tap switch to 30 days.
Set it up
Nothing to set up: it works with the standard one-line script.
<script data-host="https://quietstats.co.uk" data-dnt="true" src="https://quietstats.co.uk/js/script.js" id="YOUR_SITE_ID" async defer></script>Privacy: what is and isn’t collected
Collected
- Nothing new: daily visitor totals you already collect
Never collected
- Cookies, localStorage or anything else stored on the visitor’s device
- IP addresses or user agents (used in memory, then discarded)
- Anything that links a visitor across days (the visitor ID resets daily)
Rows and limits
- Needs at least 10 full days of data
- Looks 14 days ahead
- Rows: 0 read beyond the dashboard, 0 written
“Rows” are database rows written, which is what our hosting is billed on. Reads are not rows written. Methodology →
Questions
Is it machine learning?
No. It is a short, published formula (weekday pattern plus a damped straight-line trend), so you can check every number. It is a guide, not a promise.
Does it work with filters?
Yes. Filter the dashboard by a page, source or country and the forecast follows that filter.
Related features
Try it on your own site
Free during launch: one site and 5,000 pageviews a month, no card needed. After launch, paid plans start at £5 a month.