How to use conversion control chart: real changes in your conversion rate
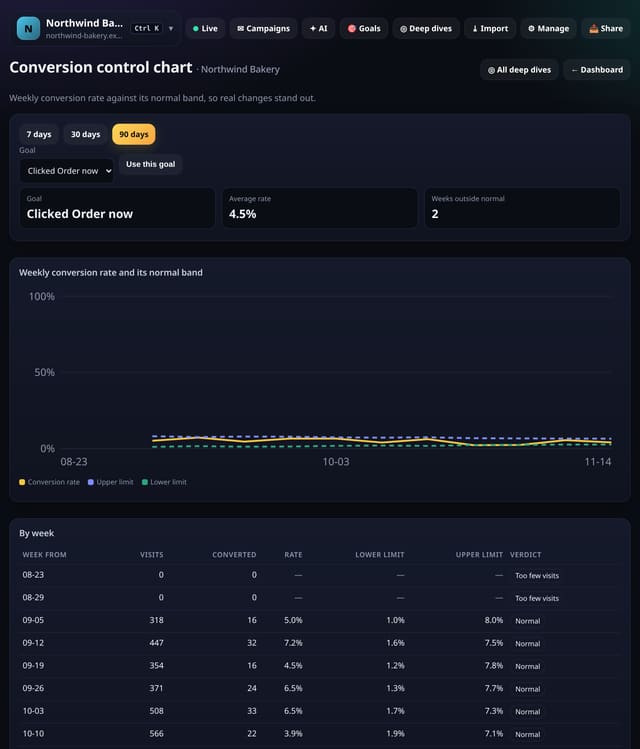
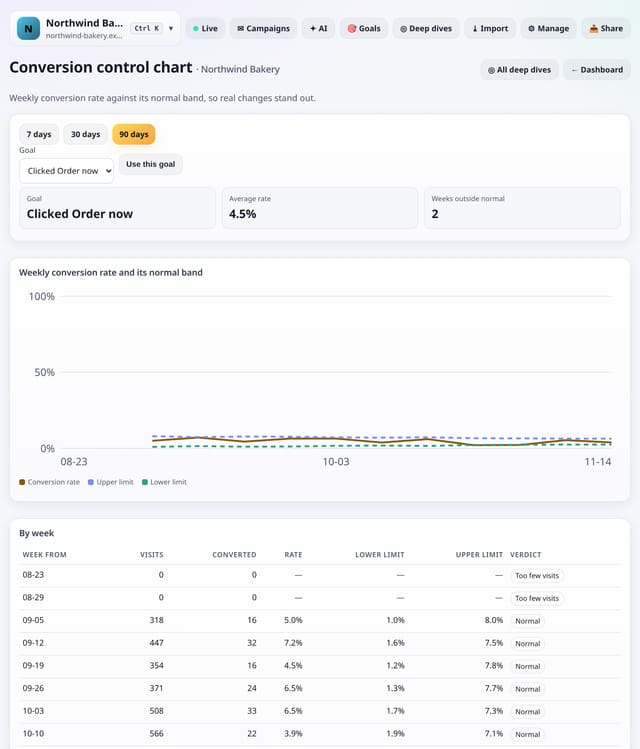
Your weekly conversion rate drawn against its normal band, so weeks that are really different stand out from normal ups and downs.
What it does
For the goal you pick, quietstats works out the conversion rate for each week and the average across the range, then draws upper and lower limits three standard errors either side (a p-chart, the method factories use for quality). Weeks outside the band are flagged.
Why it matters
Conversion rates bounce around, especially on small sites. The band shows how much bounce is normal at your traffic, so you only react to weeks that are genuinely out of line.
How to use it
- Open Deep dives → Analysis lab → Conversion control chart, or search “Conversion control chart” on All reports (or go to /app/lab/convcontrol?site=YOUR_SITE).
- Pick a goal at the top of the screen.
- The default range is 90 days; pick another at the top.
- Download any table with its CSV link; small numbers show as “<5” there too.
How it works
- Open your dashboard, go to Deep dives (or Reports on a phone) and open Analysis lab.
- Under Conversions, tap Conversion control chart. You can also search for it on the All reports screen.
- Pick a date range (and any options at the top), read the “How to read this” notes, and download any table as CSV.
Privacy
- Collected: Nothing new: it reads the pageviews, events, goals or daily totals you already have
- Not collected: Anything about a single visitor
- Not collected: Links between days: visitor ids still reset at midnight
- No cookies, and nothing stored on the visitor’s device.
- Reports show totals only: never a visitor list, IP address or single visit.
Limits
- Weeks with fewer than 5 visits are left out
- Works best with 8 or more weeks: pick 90 days
- Up to 92 days and 200,000 pageviews per screen
- Read from the database only when you open it, then kept for 10 minutes
Plans
Every plan, including Free. quietstats is free during launch: the Free plan covers 1 site and 5,000 pageviews a month, and no card is needed. See pricing.
Questions
Why do the limits change width?
Weeks with fewer visits are naturally noisier, so their band is wider.
Does it store anything new?
No. It is worked out from the pageviews and events you already have when you open the screen, and only the totals are kept for 10 minutes.
Related
Feature page: Conversion control chart: real changes in your conversion rate → What it is, why it matters, privacy and how other tools do it.