All reports, and the new phone menu
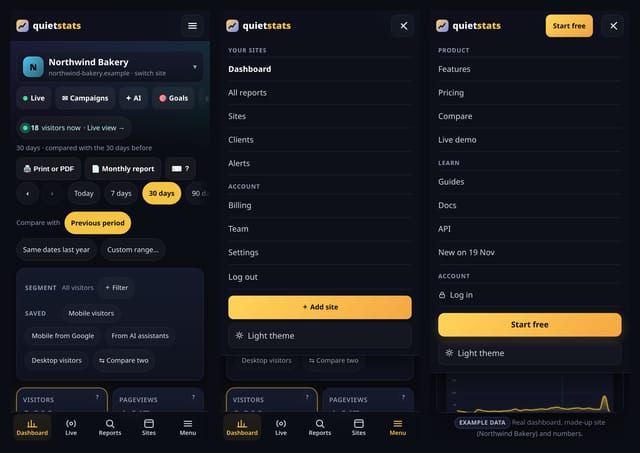
Every report for a site on one searchable screen, and a lighter menu on phones.
A big day for quietstats: a 20-part update with new dashboards, deep dives and guides, 32 Analysis lab reports that answer deeper questions about your visitors, 50 more stats, and a lighter menu on phones. Each one is explained below in plain English, with a screenshot and links to its feature page and how-to guide. Everything here works the same way as the rest of quietstats: no cookies, totals only, and nothing about a single visitor is ever shown.
Not sure where to begin? These five show the most for the least effort.
Every report for a site on one searchable screen, and a lighter menu on phones.
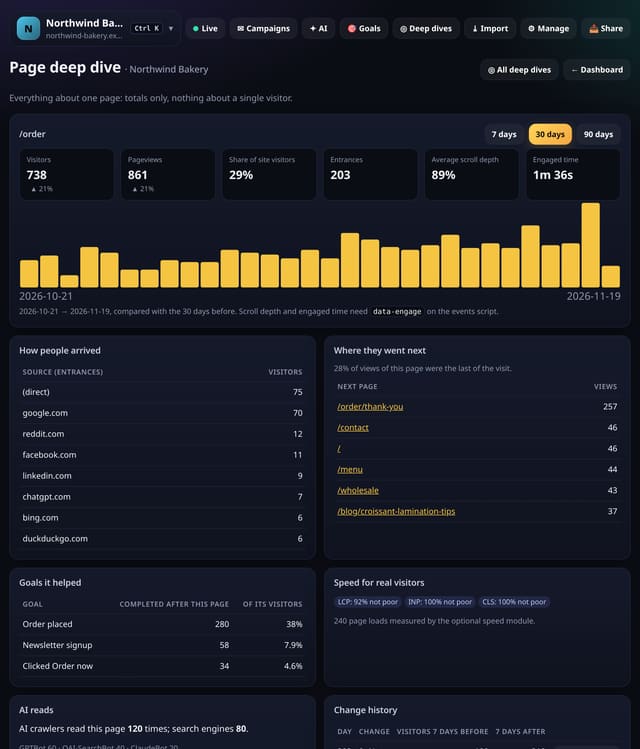
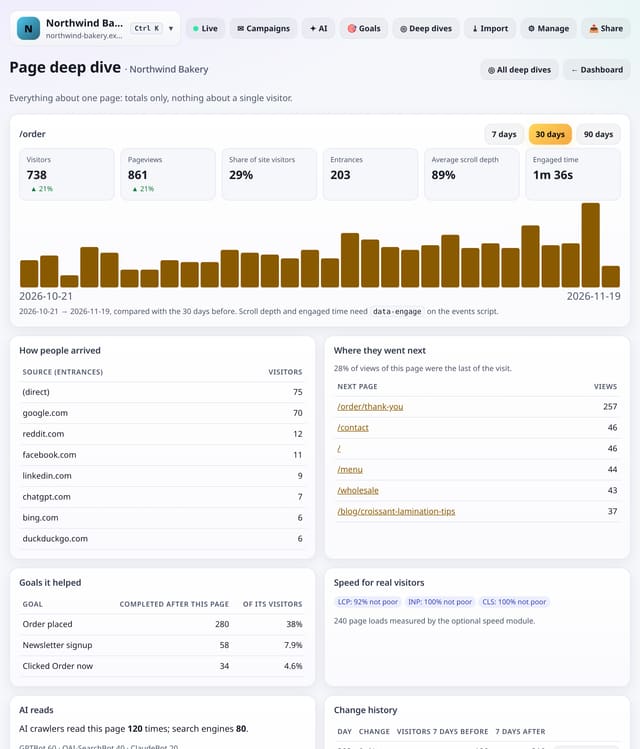
Open any page to see its visitors over time, how people arrived, where they went next, how far they scrolled, how fast it was, which goals it helped, how often AI crawlers read it, whether it is fading and what changed.
Why use it: Deciding what to do with a page means checking six cards and three screens.
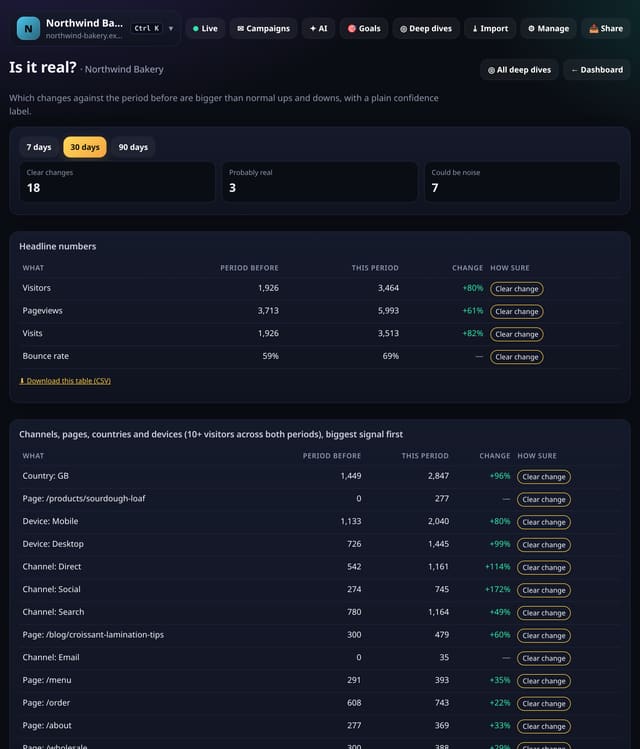
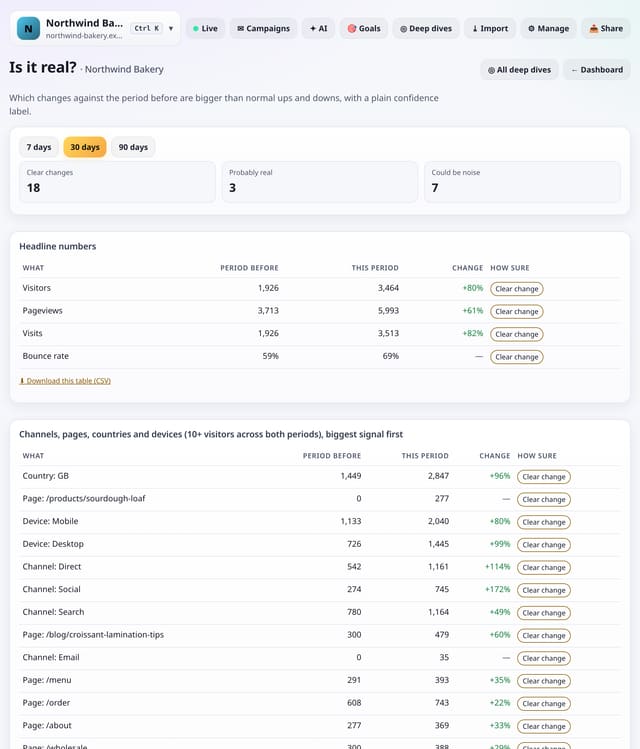
Every headline number, channel, top page, country and device against the period before, with a plain label: Clear change, Probably real or Could be noise.
Why use it: Small sites swing a lot by chance.
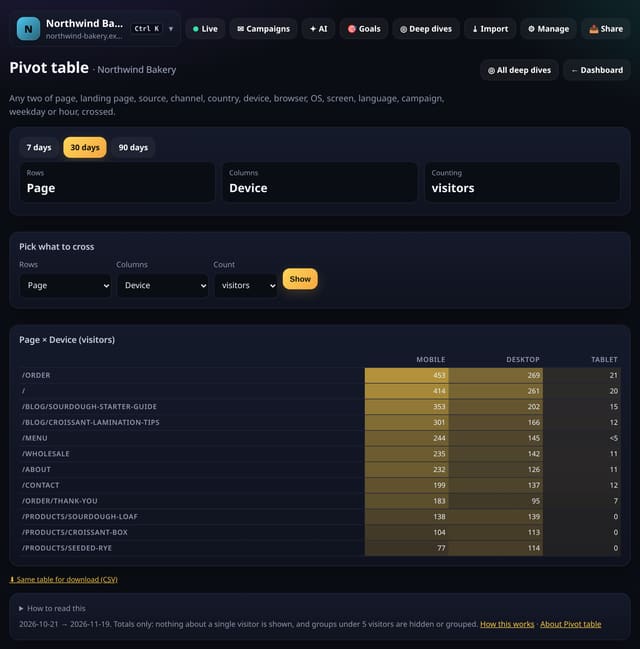
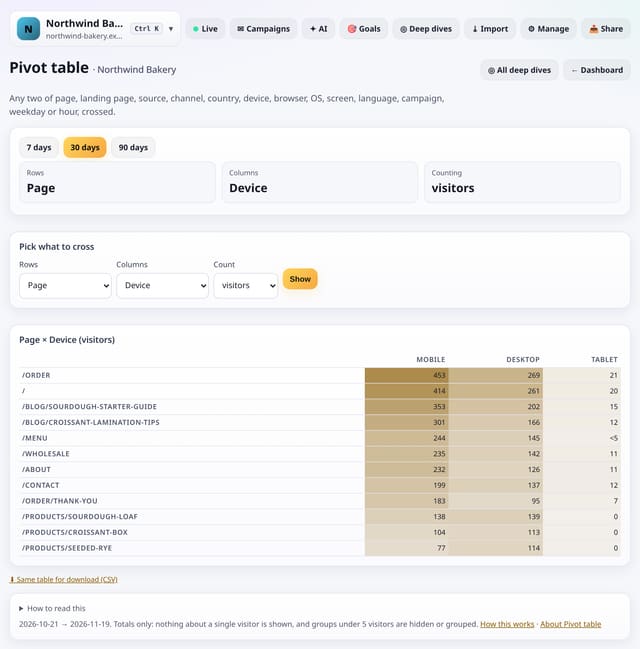
Cross any two of page, landing page, source, channel, country, device, browser, operating system, screen size, language, campaign, weekday and hour, counting visitors, pageviews or visits.
Why use it: Most questions are two-dimensional: which pages do mobile readers open, which countries come from which source.
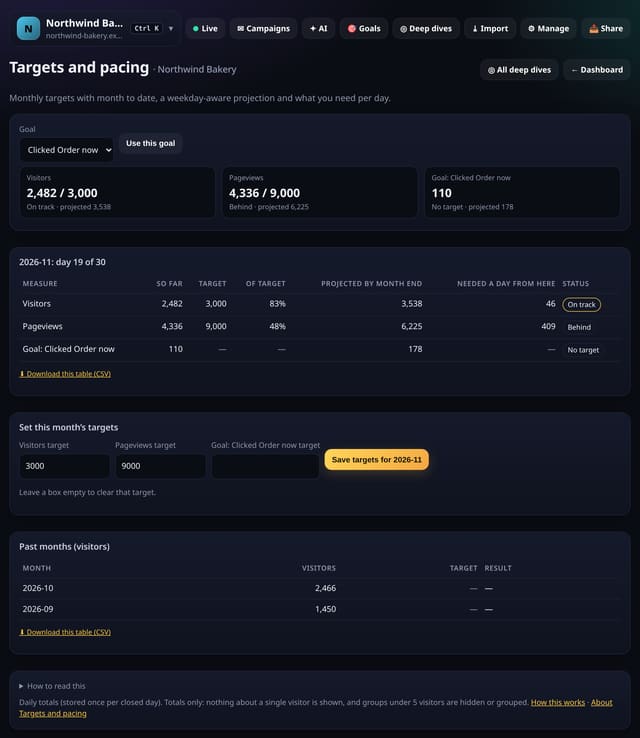
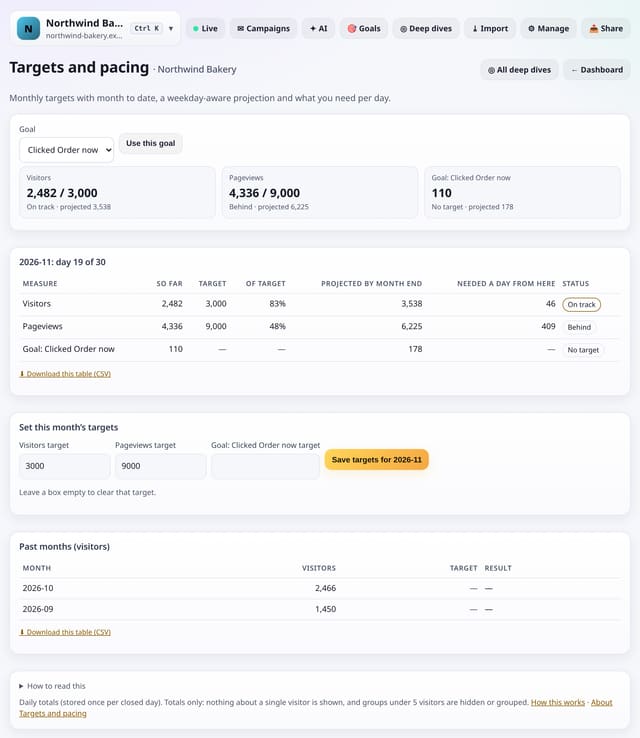
Set a monthly target for visitors, pageviews or a goal, then see month to date, a weekday-aware projection and what you need each day to hit it.
Why use it: Clients ask “are we on track?”.
About Targets and pacingHow to use it: Targets and pacingQS-293
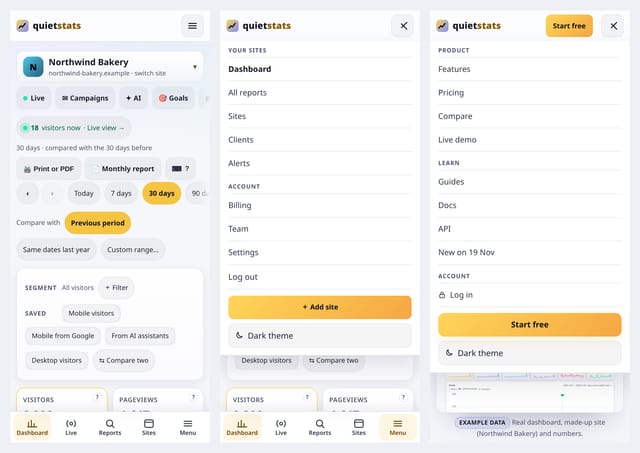
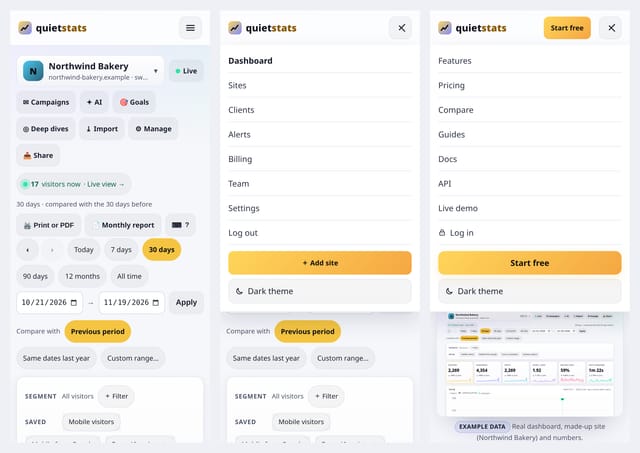
On a phone, the menu is now grouped into a few plain sections, the header is slimmer, the site’s pages and date ranges sit in one swipeable row each, and signed-in pages have a small bar at the bottom: Dashboard, Live, Reports, Sites and Menu. All reports is a new screen that lists every report for a site, grouped by theme, with a search box.
Why use it: you get to the report you want in one or two taps, without scrolling past rows of buttons. Nothing was taken away: every link is still there, just grouped.
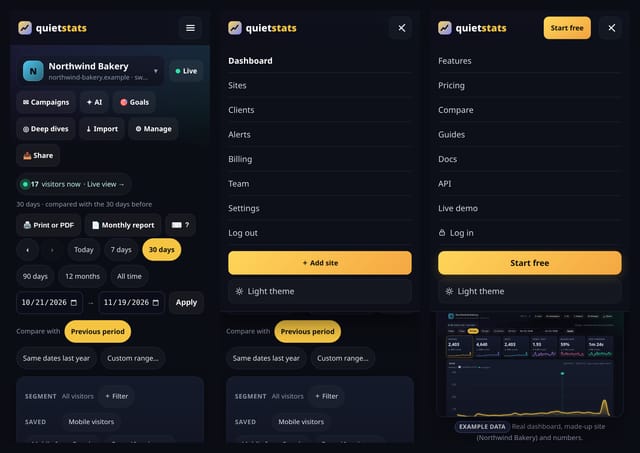
Open All reportsEvery page on the siteMobile navigation
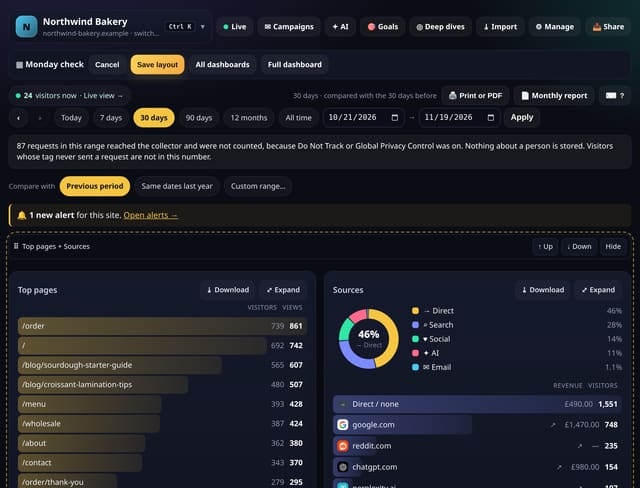
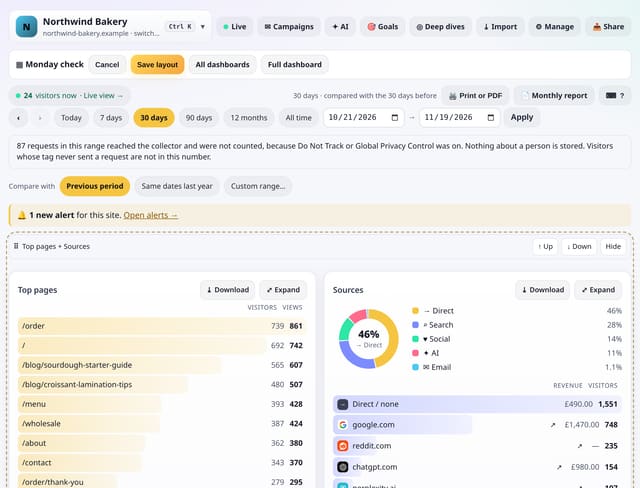
Drag the cards you check most to the top, hide the ones you never read, and keep several named dashboards per site, such as a Monday check, a content view and a conversions view.
Why use it: Most people look at the same five cards every day.
About Custom dashboardsHow to use it: Custom dashboardsQS-043, QS-105
Open any page to see its visitors over time, how people arrived, where they went next, how far they scrolled, how fast it was, which goals it helped, how often AI crawlers read it, whether it is fading and what changed.
Why use it: Deciding what to do with a page means checking six cards and three screens.
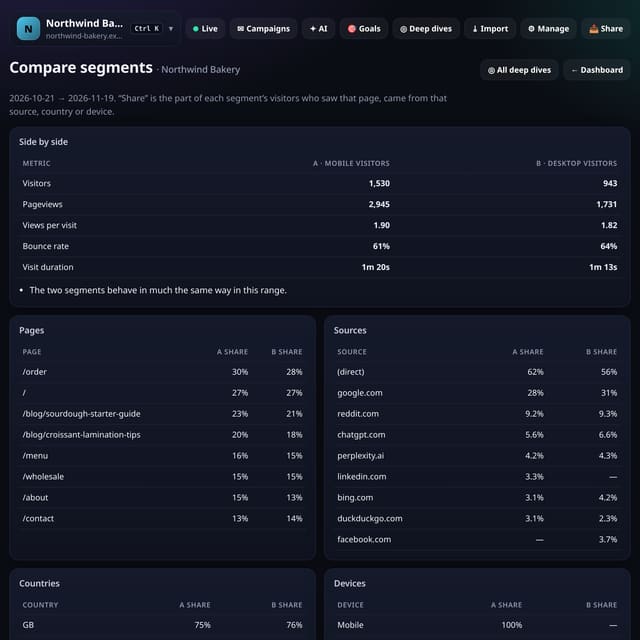
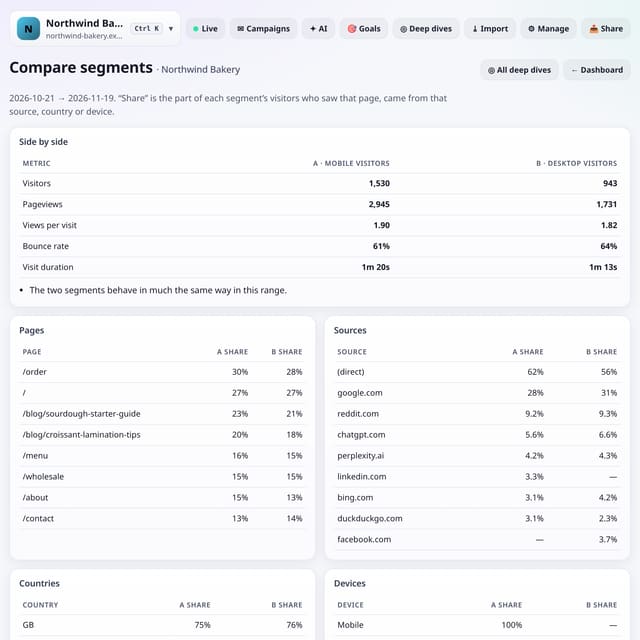
Put two groups of visitors next to each other, such as mobile visitors from Google against desktop visitors, or people sent by ChatGPT against everyone else, and see how they differ.
Why use it: An average hides the groups inside it.
About Compare two segments side by sideHow to use it: Compare two segments side by sideQS-277
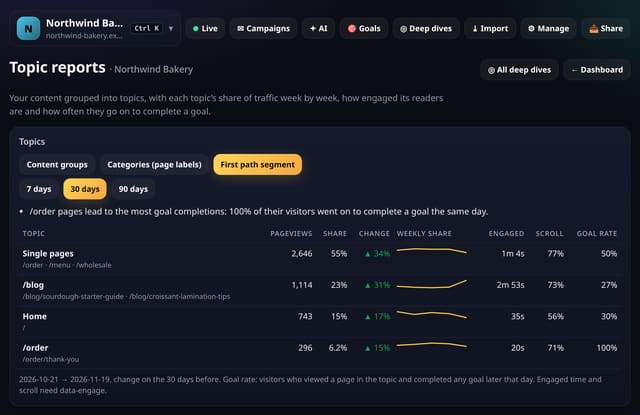
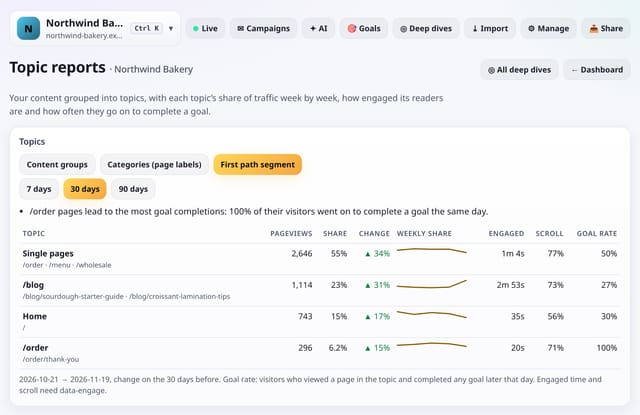
Treat each content group, category or site section as a topic and see its share of traffic week by week, how it changed, how engaged its readers are and how often they go on to complete a goal.
Why use it: Single pages come and go.
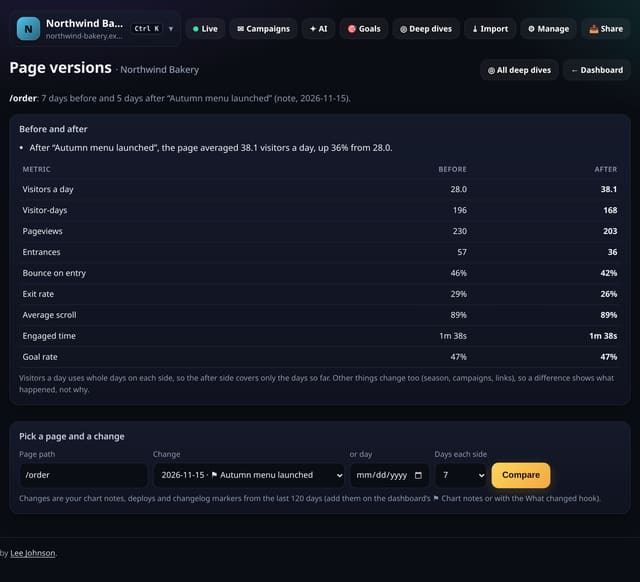
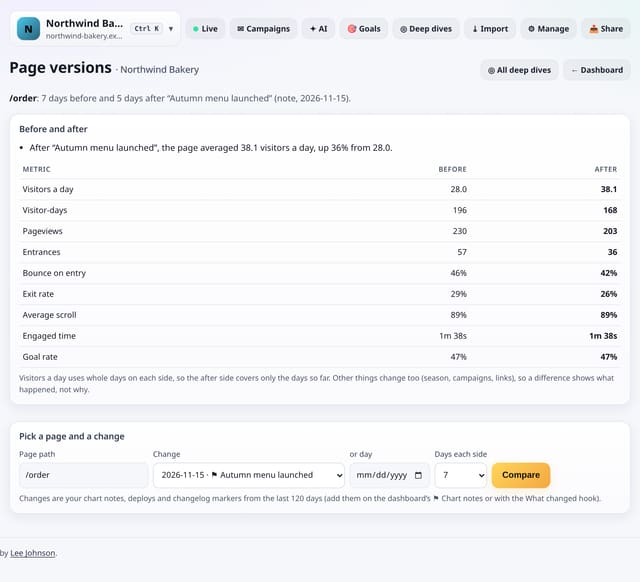
Changed a page? Pick the change from your What changed markers, or a day, and see how the page did in the days before and after it.
Why use it: Most page edits are never checked.
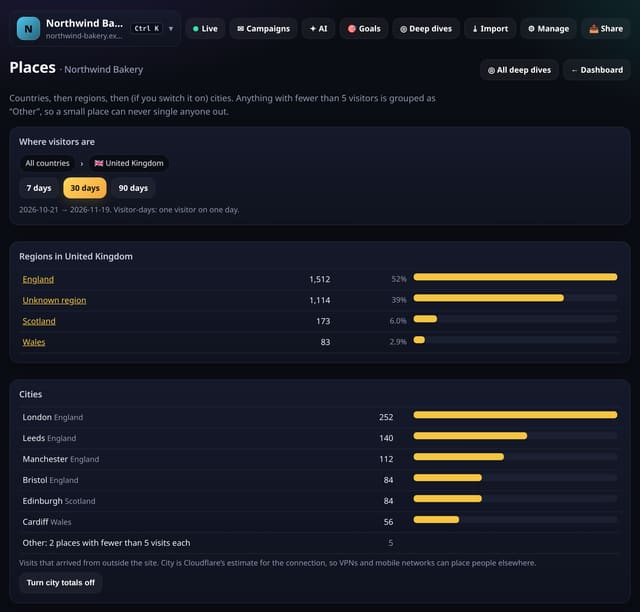
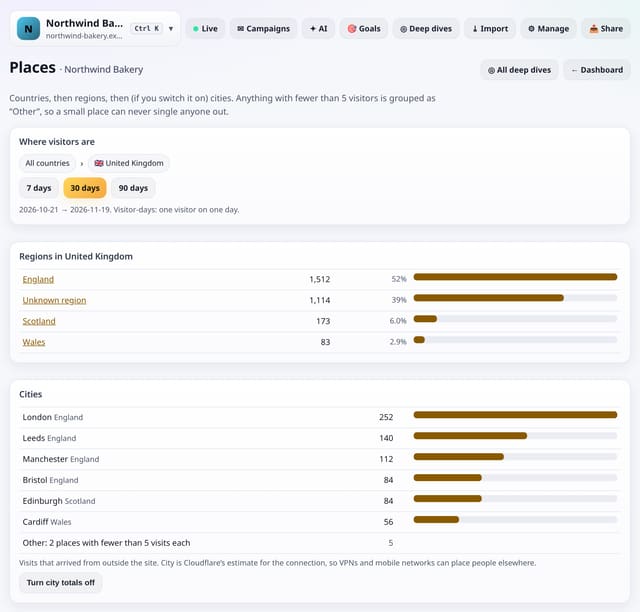
Drill from countries to regions to cities, with anything under 5 visitors grouped as “Other” so a small place can never single anyone out. City totals are off until you switch them on.
Why use it: Knowing that 30% of your visitors are in Leeds is useful for a local business.
About PlacesHow to use it: PlacesQS-048, QS-142
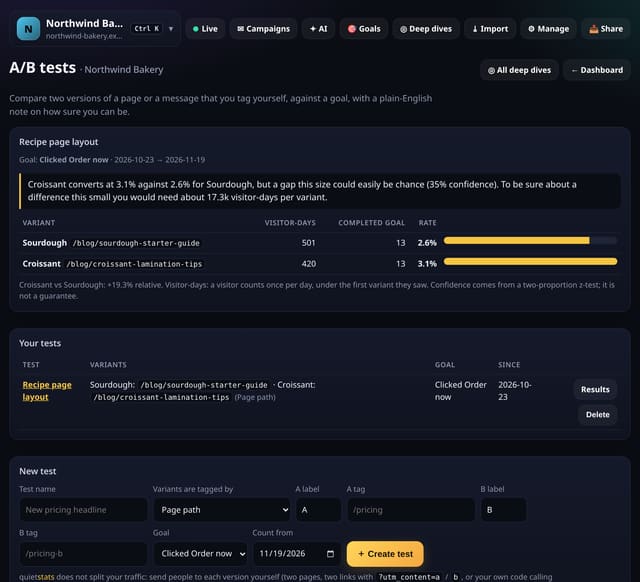
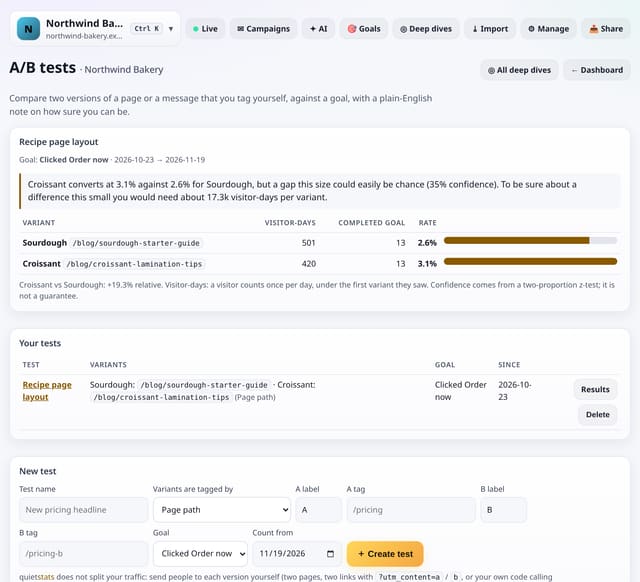
Compare two versions of a page, an email link or a message on any goal, and get a plain-English note on whether the difference is real or could be chance.
Why use it: Most A/B tools add a heavy script, cookies and a consent banner.
About A/B tests with your own tags and a plain-English confidence noteHow to use it: A/B tests with your own tags and a plain-English confidence noteQS-073
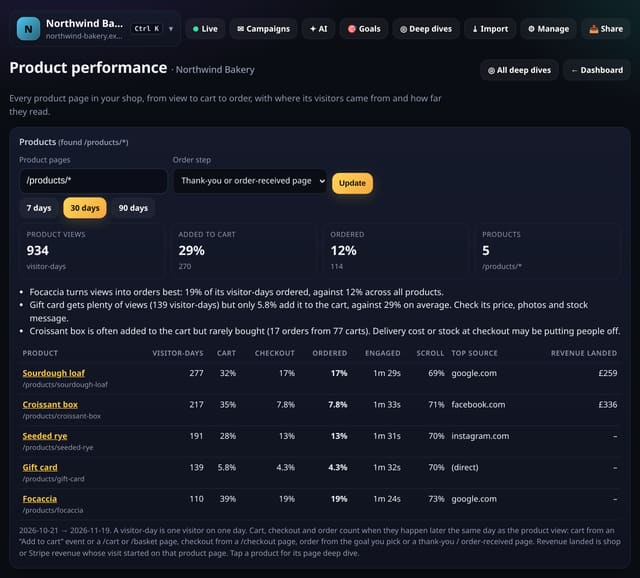
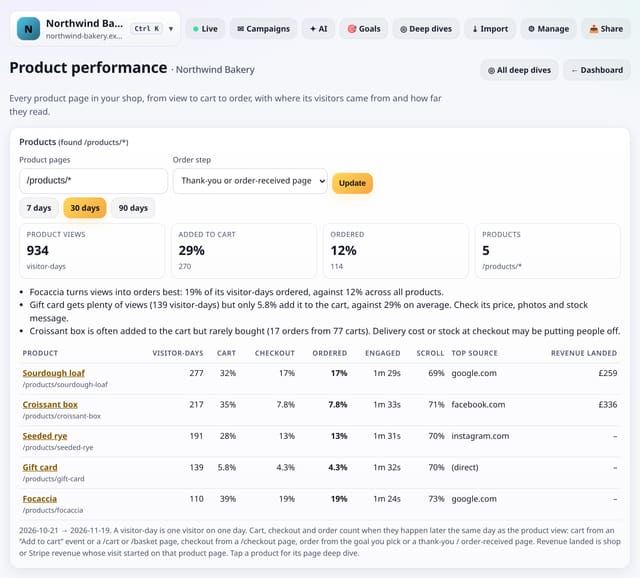
See each product in your shop from first view to cart, checkout and order, with where its visitors came from, how far they read and the revenue that started on it.
Why use it: Shop dashboards tell you what sold.
About Product performanceHow to use it: Product performanceQS-079
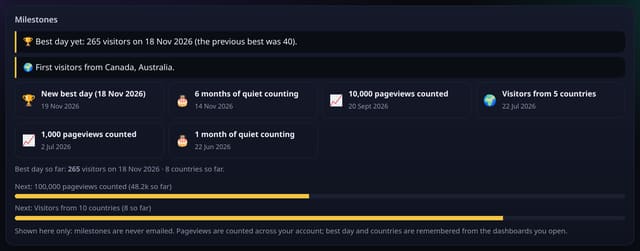
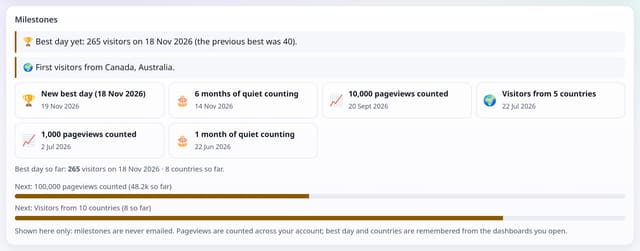
A small card that notices the good moments: your best day yet, first visitors from a new country, pageview milestones and how long you have been counting.
Why use it: Small sites grow slowly.
About Milestones on your dashboardHow to use it: Milestones on your dashboardQS-121
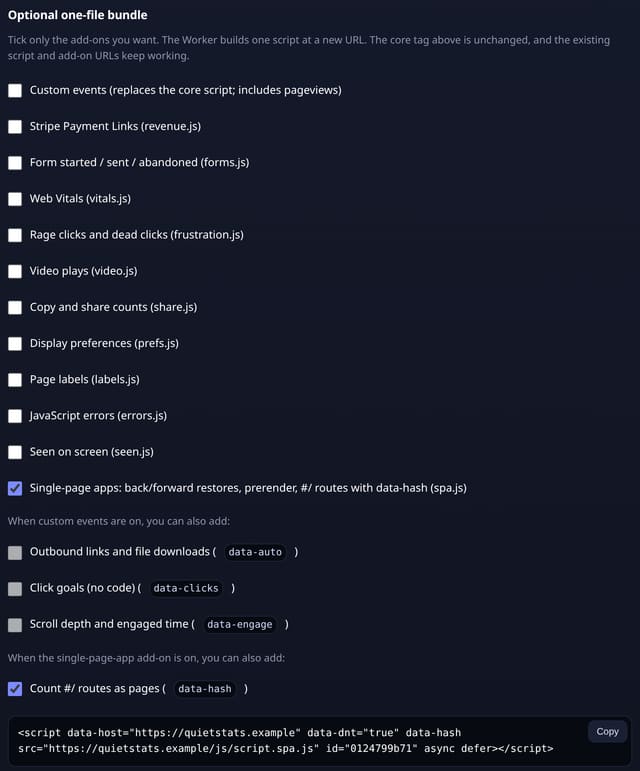
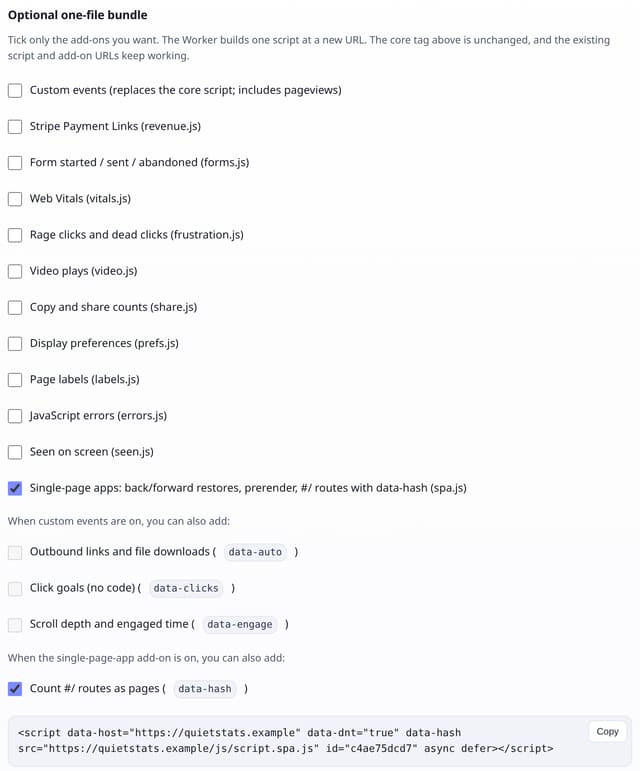
An optional add-on for apps that use hash routes (#/settings), and for any site where people use Back and Forward a lot. The core script stays exactly as it is.
Why use it: Hash-routed apps otherwise look like one page, and back/forward-cache restores are silently missed.
About Single-page app add-onHow to use it: Single-page app add-onQS-164, QS-165
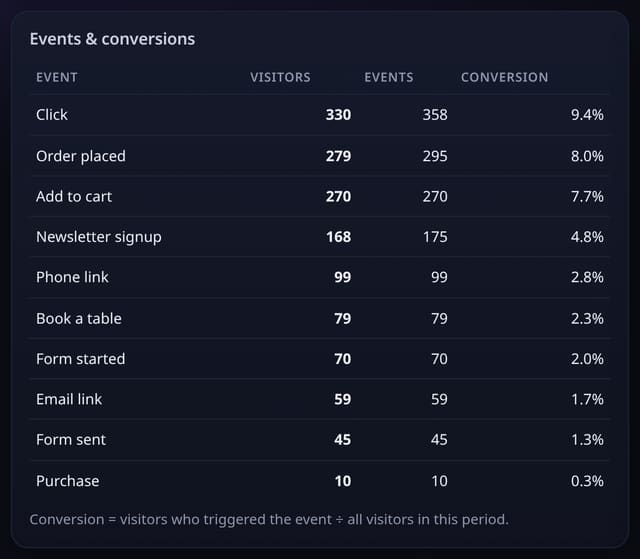
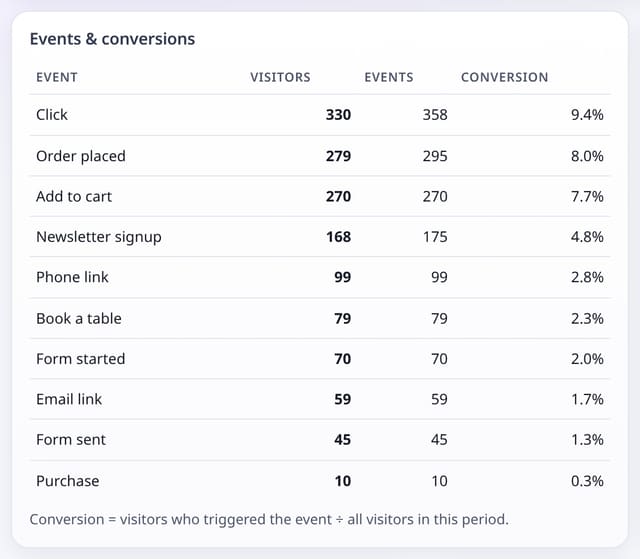
An optional add-on that counts clicks on email and phone links, links opened with a middle-click, and events named in a CSS class, for site builders that only let you add classes.
Why use it: For many small businesses an email or a phone call is the conversion.
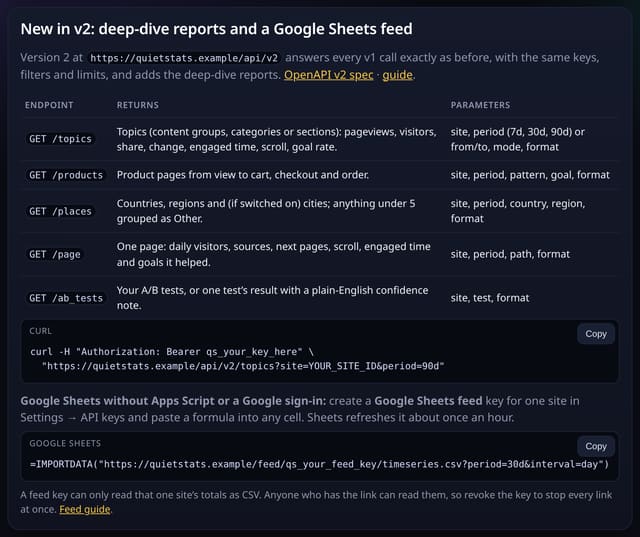
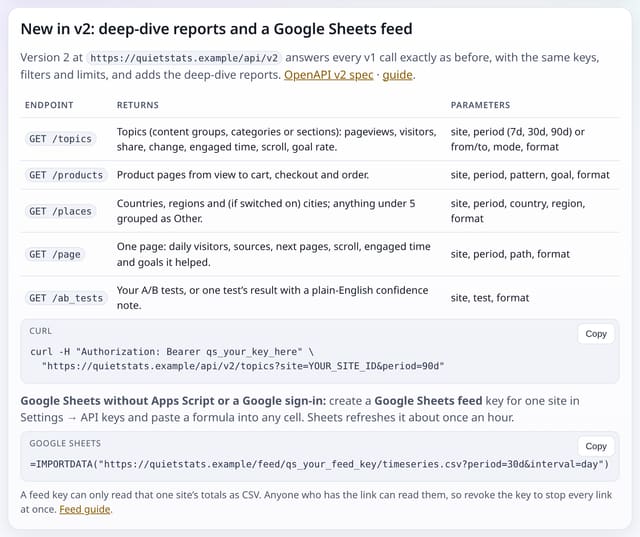
Version 2 of the Stats API keeps every v1 call exactly as it was and adds topics, products, places, page deep dives and A/B test results.
Why use it: The deep dives answer bigger questions than a single breakdown.
About Stats API v2How to use it: Stats API v2QS-080, QS-082
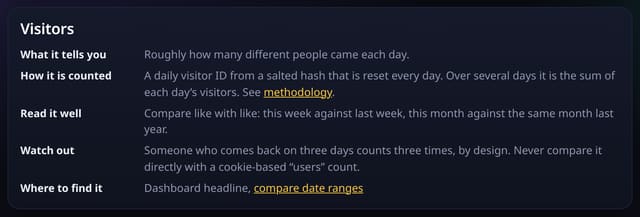
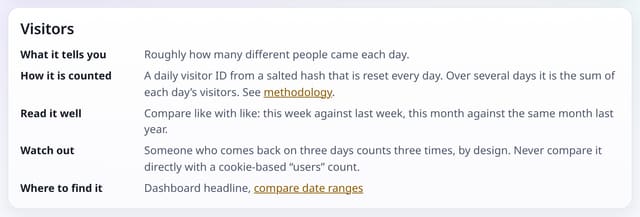
A plain-English handbook to every number on your dashboard: what it tells you, how it is counted, how to read it well and when not to trust it.
Why use it: Analytics numbers are only useful if you know what they mean.
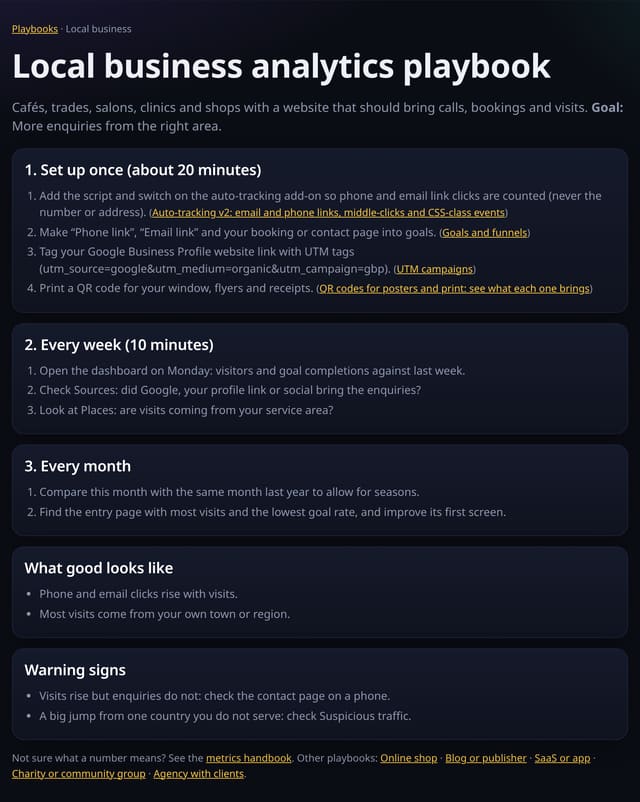
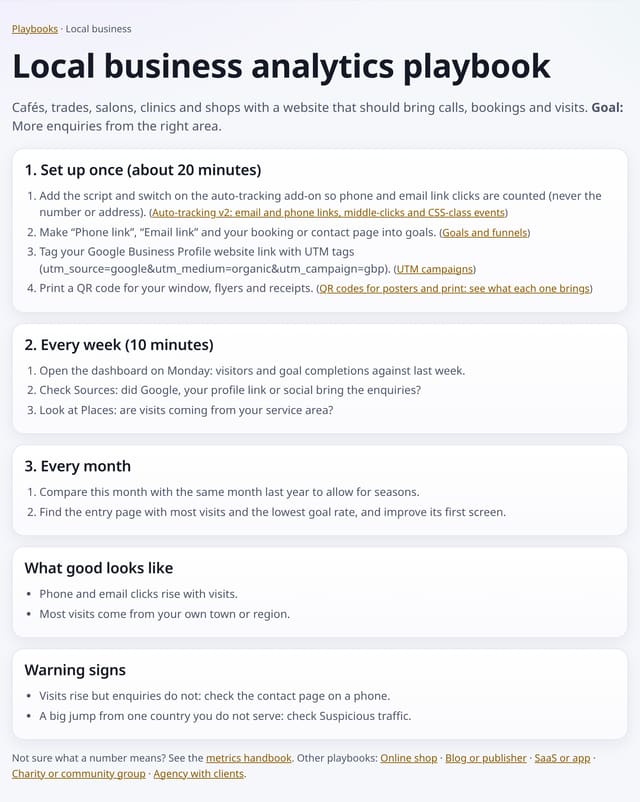
Step-by-step plans for local businesses, online shops, blogs, SaaS, charities and agencies: what to set up once, what to check each week and what good looks like.
Why use it: Most people open analytics, look at a chart and close it again.
About Analytics playbooksHow to use it: Analytics playbooksQS-281
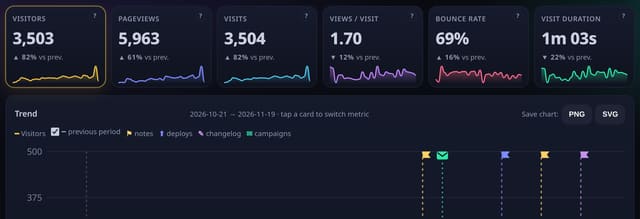
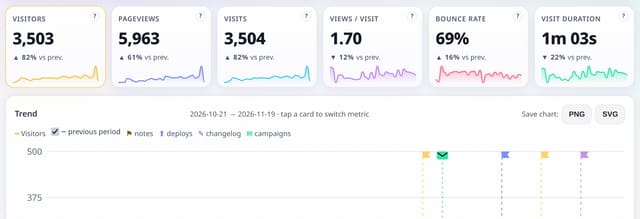
Hover the small question mark on any headline number to see what it means; click it for the full glossary of analytics words in plain English.
Why use it: Analytics has its own jargon, and cookie-free counting uses some words differently.
About Glossary and dashboard tooltipsHow to use it: Glossary and dashboard tooltipsQS-283
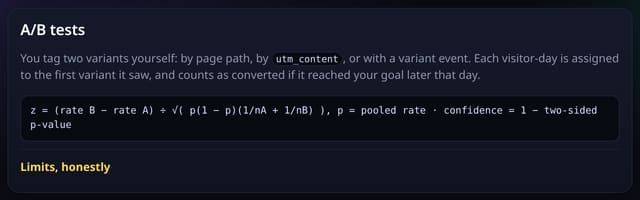
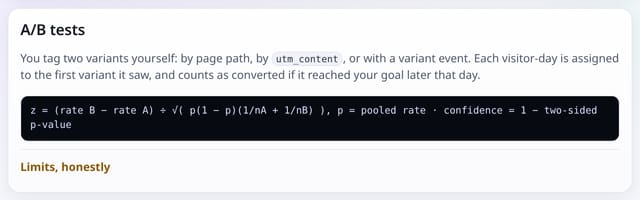
The methodology page now explains how the newer reports are worked out: deep dives, regions and cities, products, A/B tests, single-page apps, milestones and API feeds.
Why use it: You should be able to check how every number is made.
About Methodology for every deep-dive reportHow to use it: Methodology for every deep-dive reportQS-285
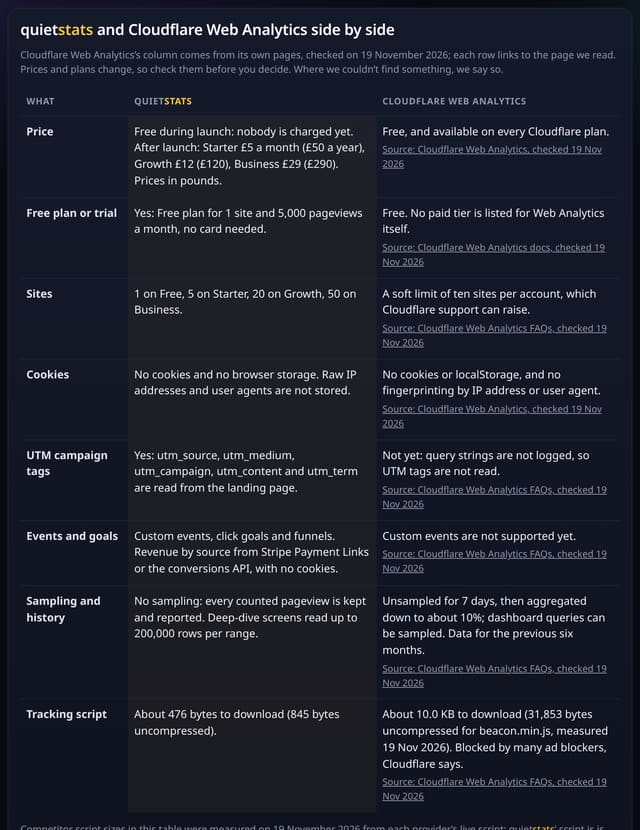
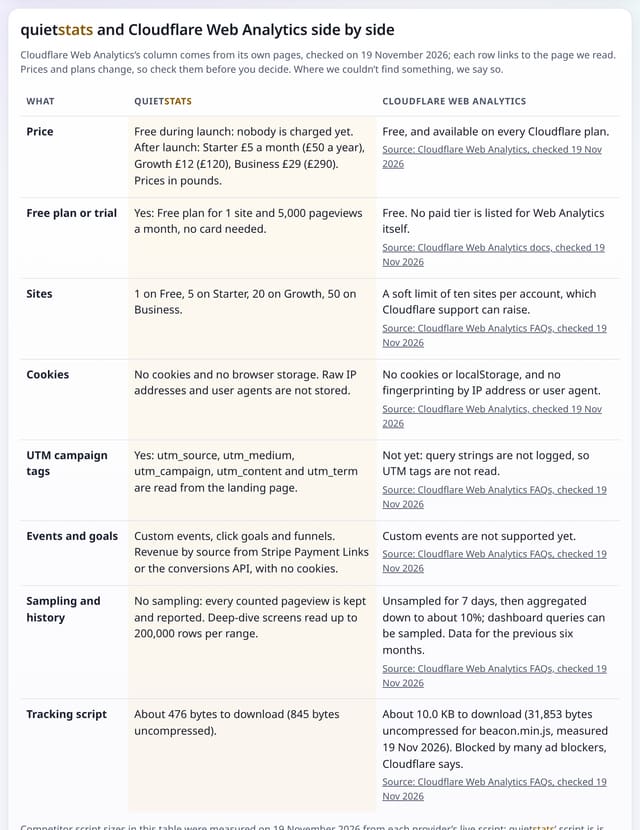
Side-by-side tables of quietstats against Cloudflare Web Analytics, Simple Analytics, Umami and Matomo, with every fact taken from the provider’s own live page on 19 November 2026.
Why use it: Choosing an analytics tool should not mean trusting a sales page.
About Head-to-head comparison guidesHow to use it: Head-to-head comparison guidesQS-286
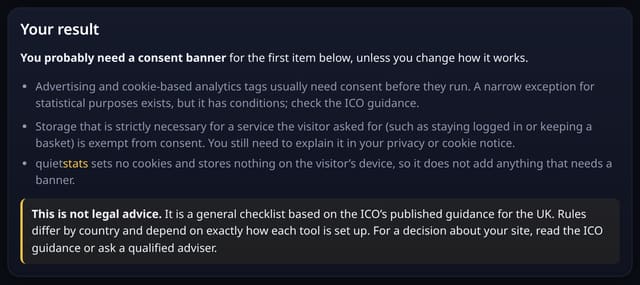
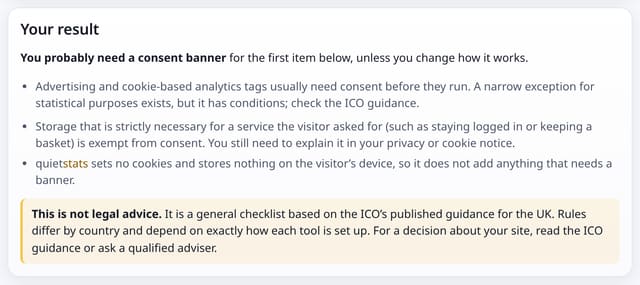
Two free explainers: see how much data and CO₂e your analytics script adds each month, and get a plain-English idea of whether your site needs a cookie banner (not legal advice).
Why use it: Two questions every small site owner asks before choosing analytics: how heavy is it, and will I need a banner?
The Analysis lab is under Deep dives in your dashboard, and in All reports. Each report reads your totals only when you open it, and every table downloads as CSV.
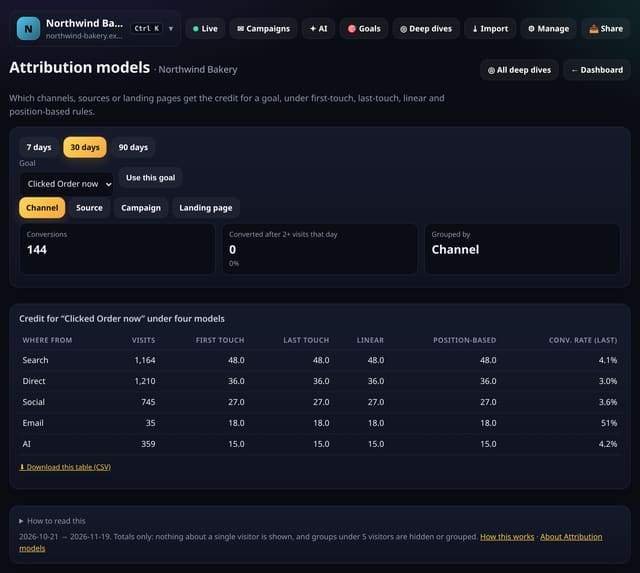
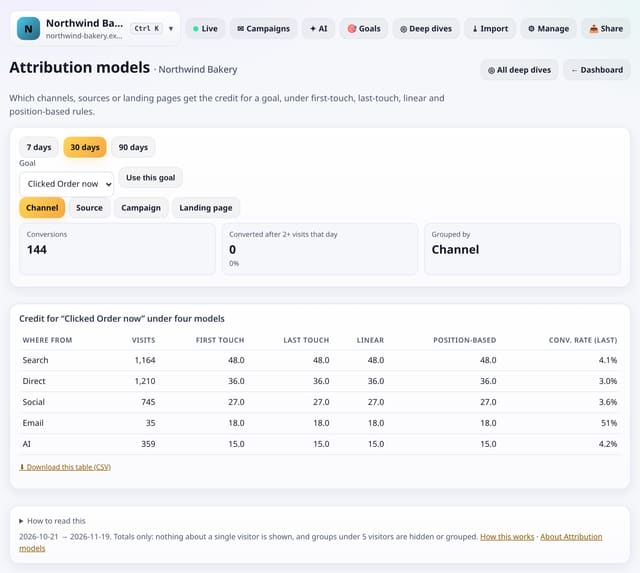
See which channels, sources, campaigns or landing pages earn the credit for a goal, under four common attribution rules side by side.
Why use it: Most dashboards only show the last click.
About Attribution modelsHow to use it: Attribution modelsQS-288
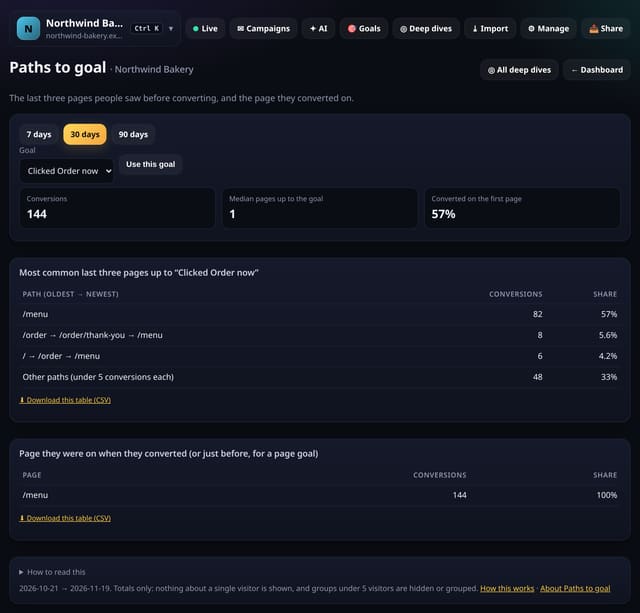
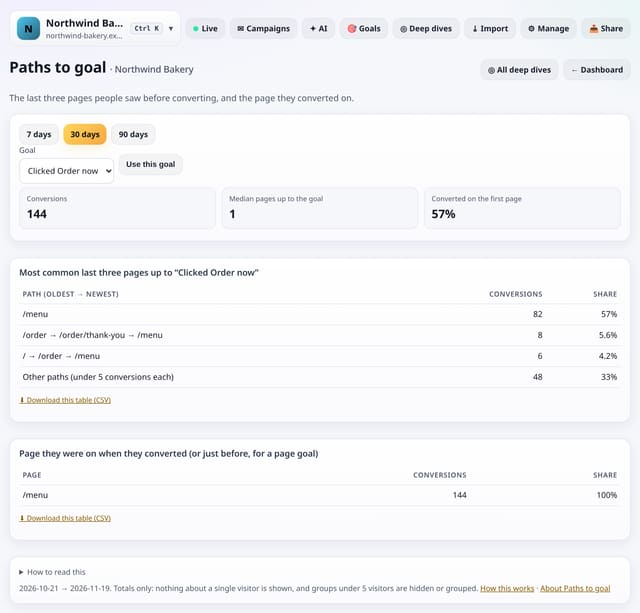
The most common last three pages before a goal, and the page people were on when they converted.
Why use it: Funnels test the route you expect.
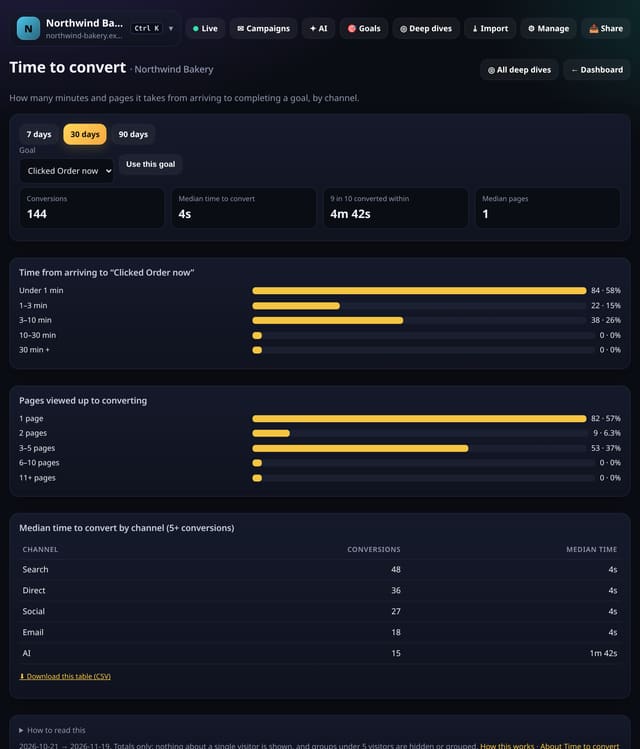
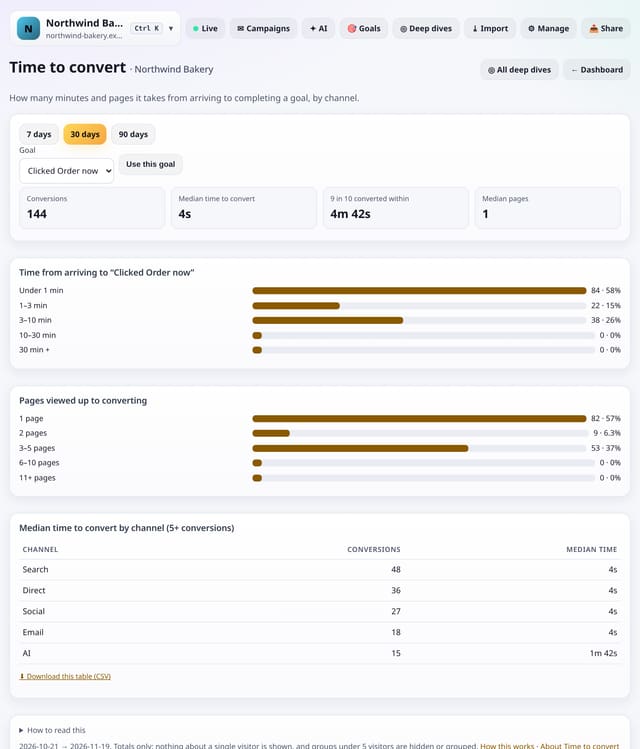
How long people take from landing to completing a goal, how many pages they view first, and how that differs by channel.
Why use it: If most people convert within a minute, your landing page does the selling.
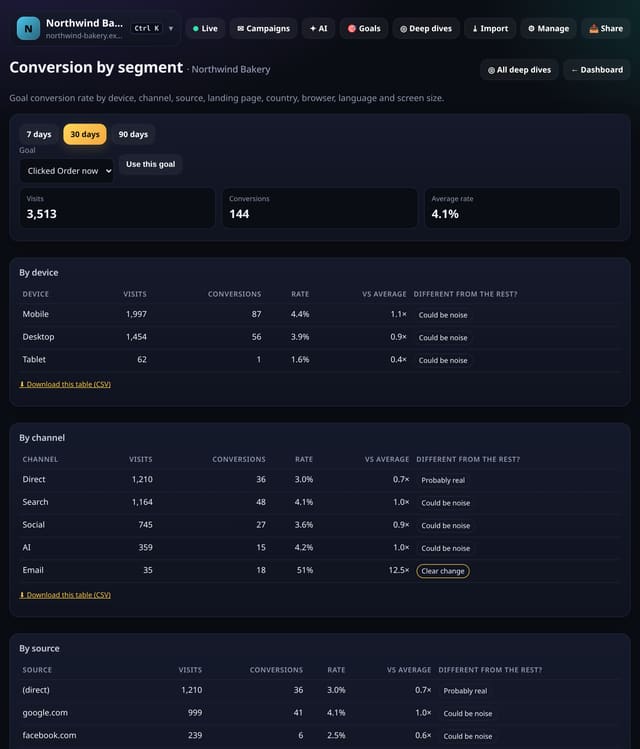
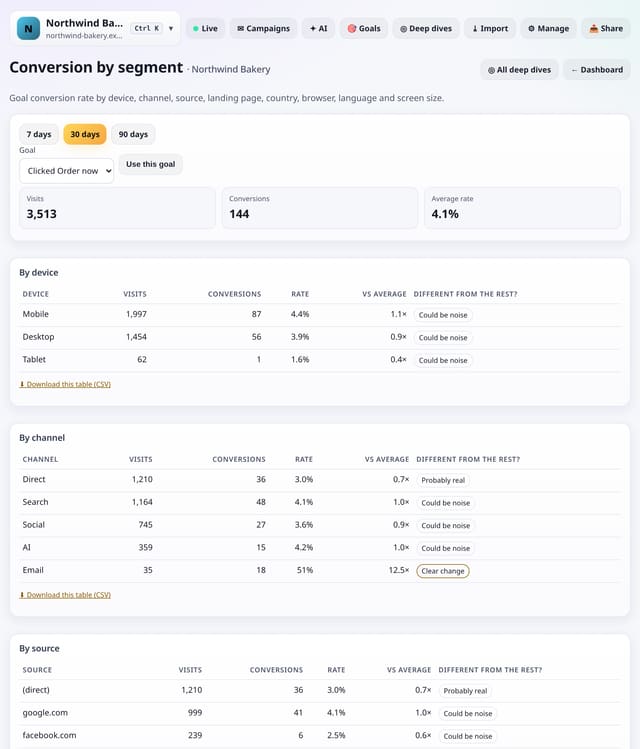
Goal conversion rate split by device, channel, source, landing page, country, browser, language and screen size, with a plain test of whether each difference is real.
Why use it: A single conversion rate hides where it comes from.
About Conversion by segmentHow to use it: Conversion by segmentQS-291
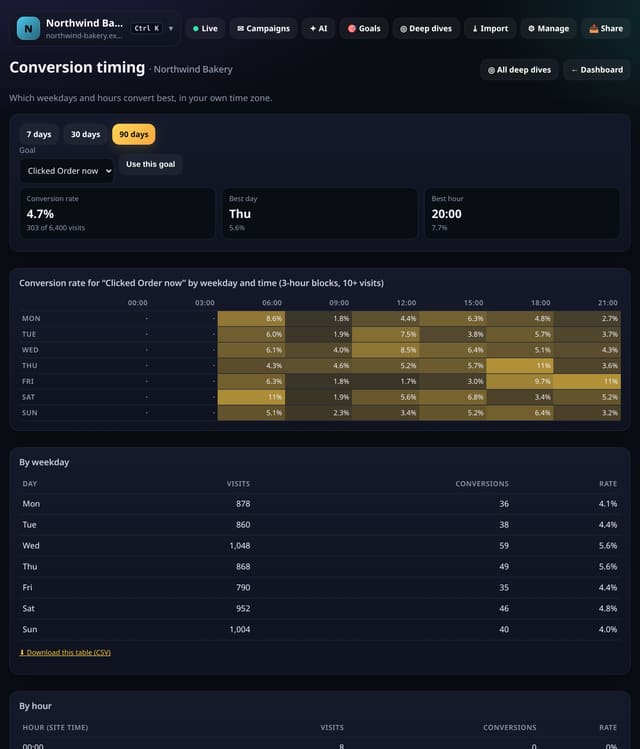
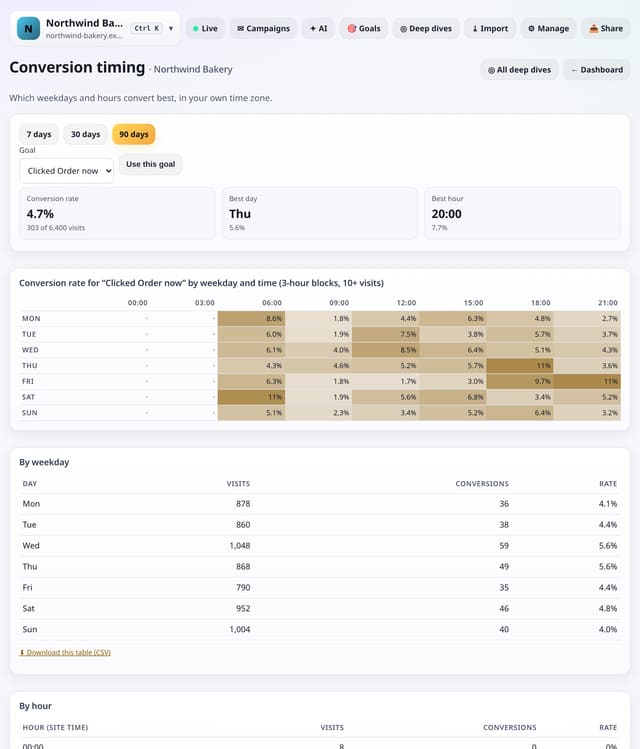
A weekday-by-time grid of conversion rate for any goal, in your own time zone, with the best day and hour named.
Why use it: The busiest hours are not always the best-converting ones.
About Conversion timingHow to use it: Conversion timingQS-292
Set a monthly target for visitors, pageviews or a goal, then see month to date, a weekday-aware projection and what you need each day to hit it.
Why use it: Clients ask “are we on track?”.
About Targets and pacingHow to use it: Targets and pacingQS-293
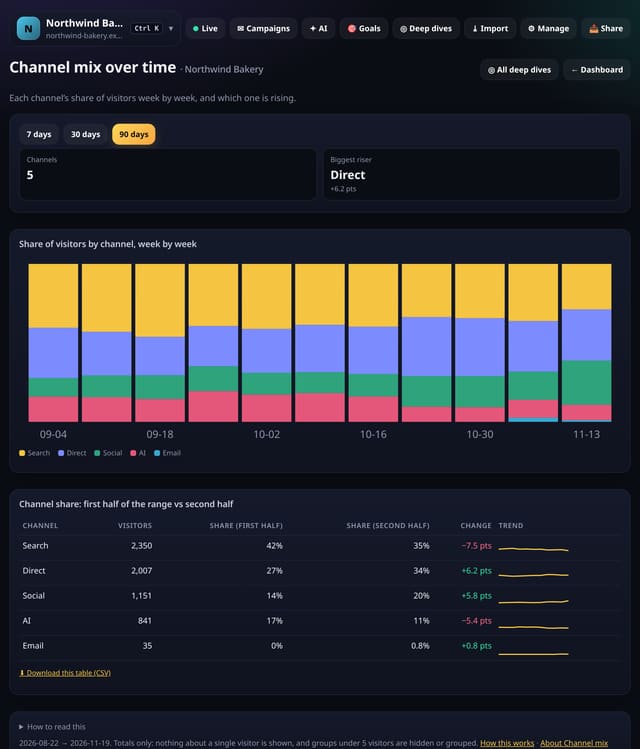
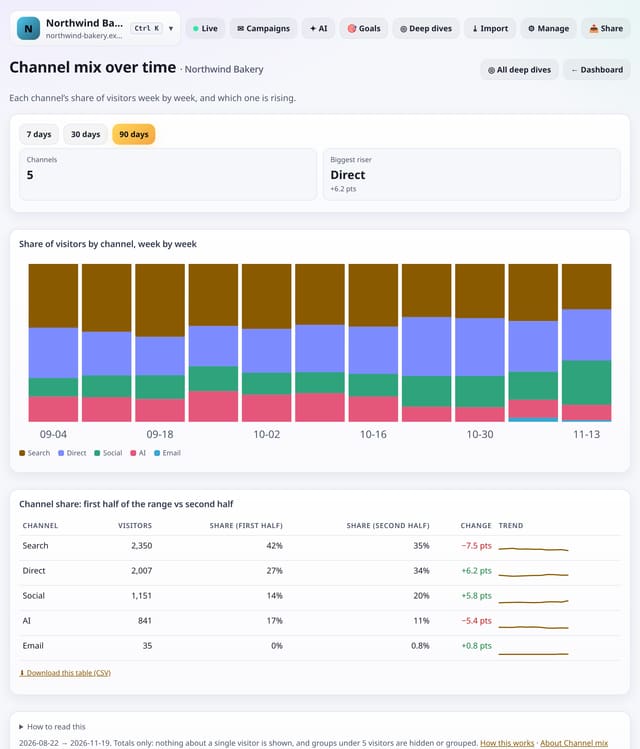
A stacked chart of how your visitors split between Search, Social, AI, Email, Referral, Direct and campaigns, week by week, and which channel is rising.
Why use it: Total visitors can stay flat while the mix underneath shifts, for example from search to AI assistants.
About Channel mix over timeHow to use it: Channel mix over timeQS-294
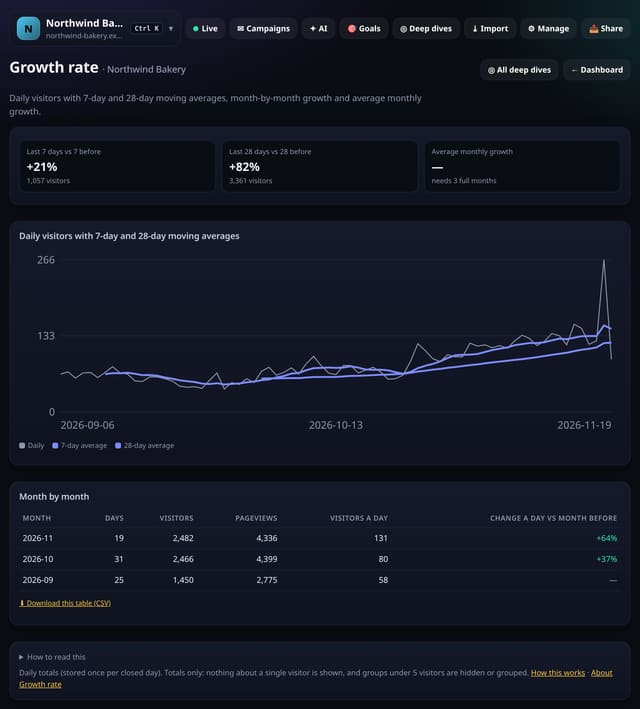
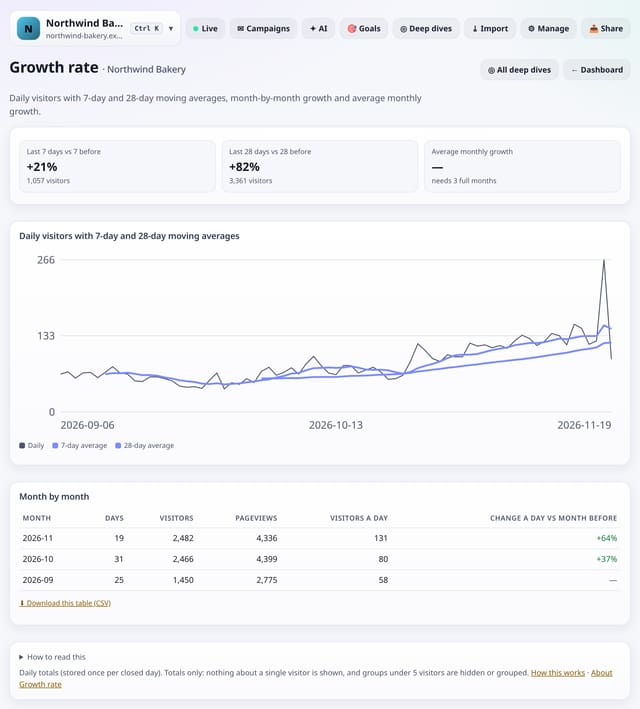
Daily visitors with 7-day and 28-day moving averages, the last 7 and 28 days against the period before, a month-by-month table and your average monthly growth.
Why use it: Day-to-day numbers are noisy.
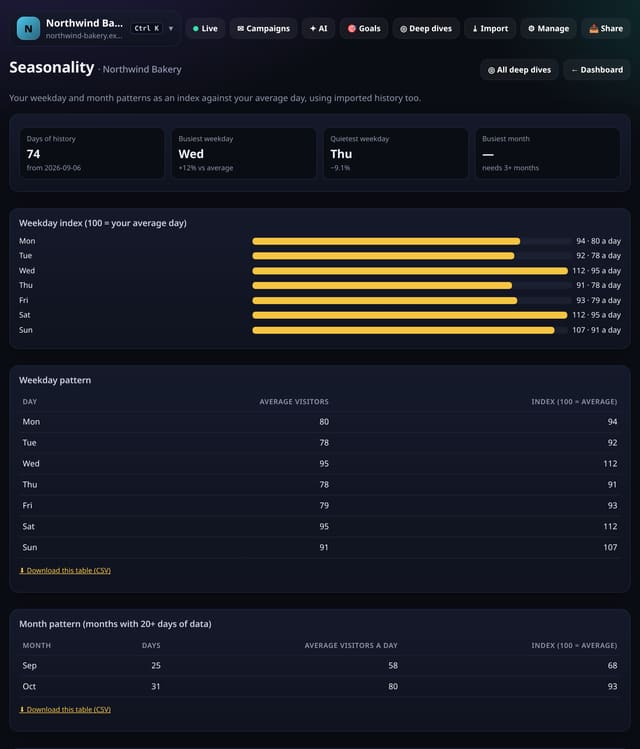
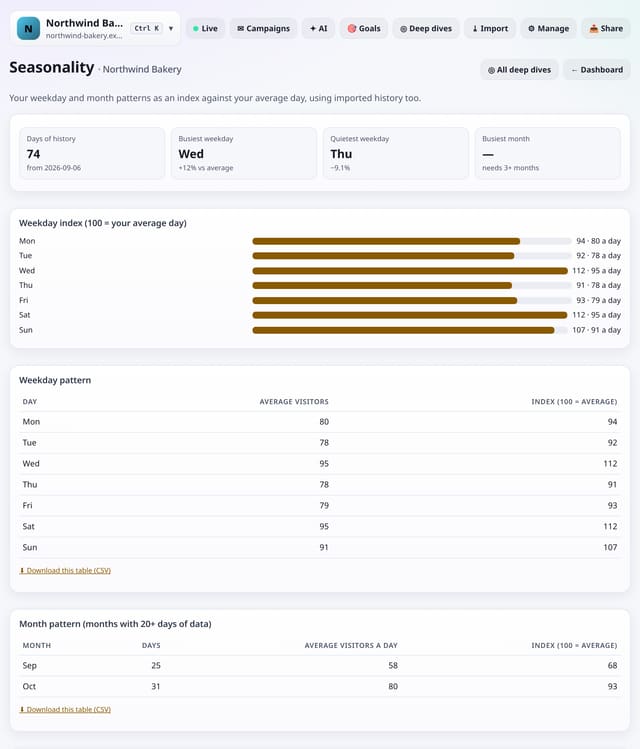
An index of each weekday and each month against your average day, using up to 400 days of live data plus any history you imported.
Why use it: Knowing that Mondays run 20% above average or that December dips stops you misreading normal seasonal swings as wins or problems, and helps plan launches.
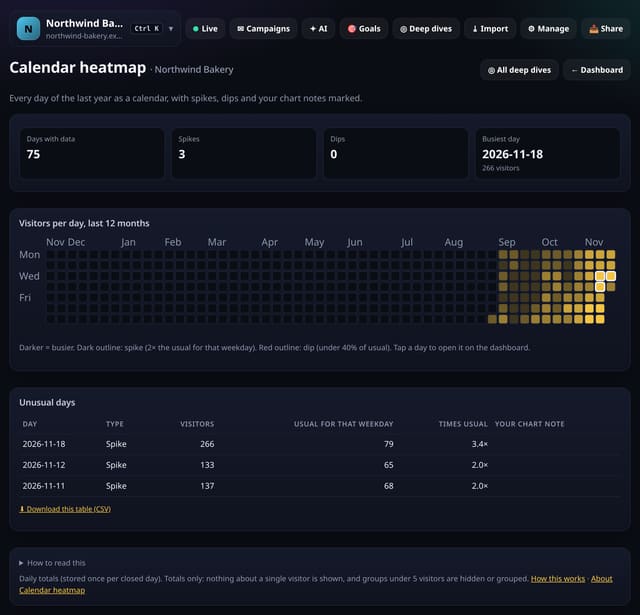
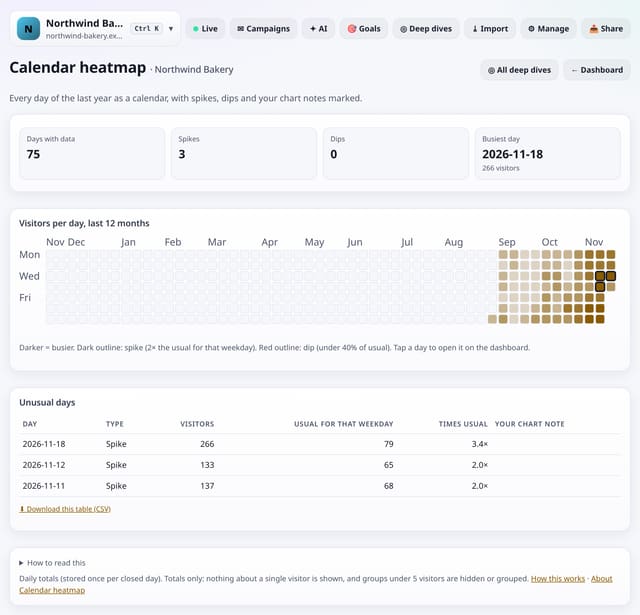
A year-long calendar of daily visitors, shaded by how busy each day was, with spikes, dips and your chart notes marked.
Why use it: A year at a glance shows launches, outages, seasonal runs and quiet spells that a 30-day chart hides.
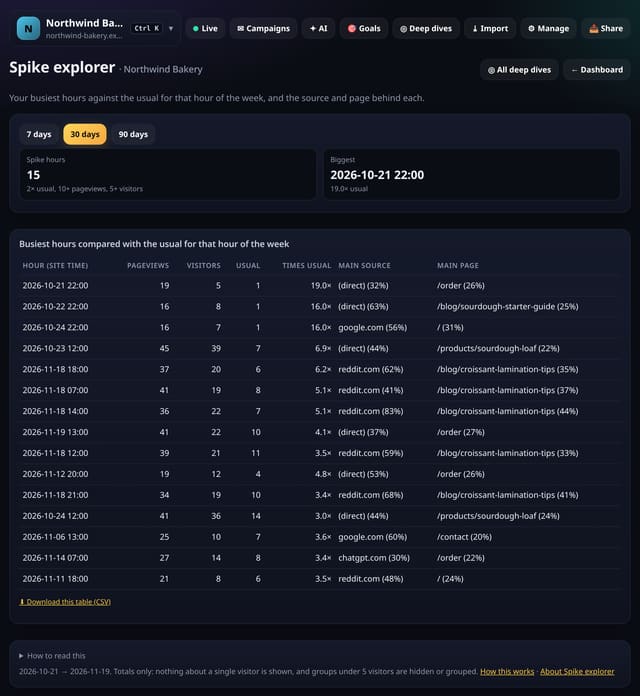
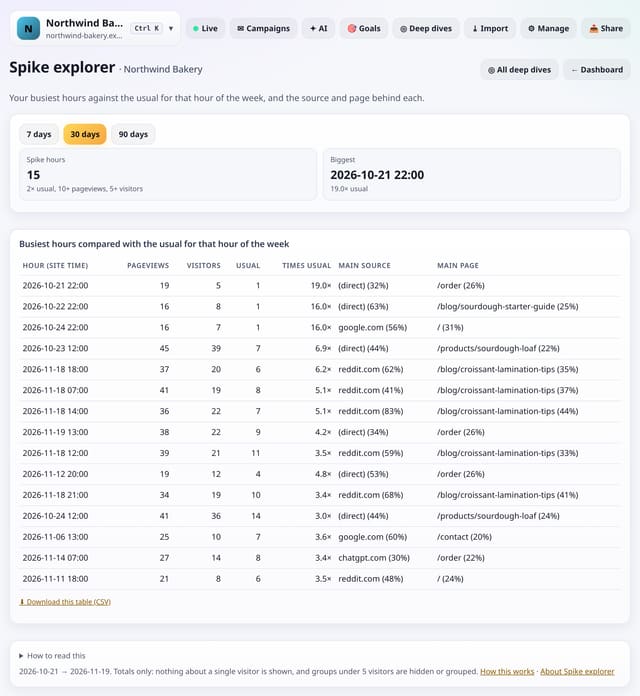
The hours when traffic jumped to at least twice the usual for that hour of the week, with the source and page behind each spike.
Why use it: A spike is a clue: a post, a mention or a newsletter.
Every headline number, channel, top page, country and device against the period before, with a plain label: Clear change, Probably real or Could be noise.
Why use it: Small sites swing a lot by chance.
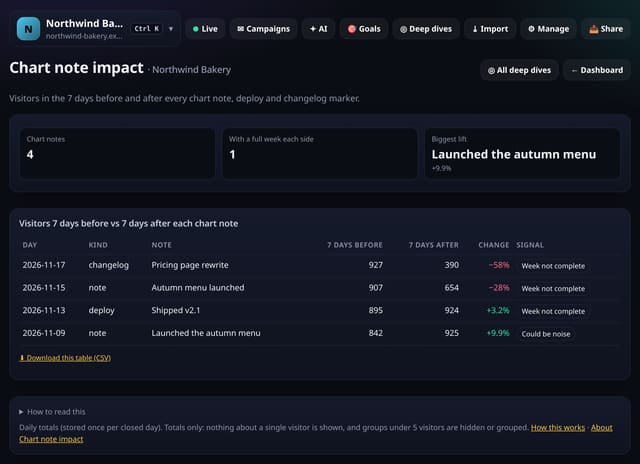
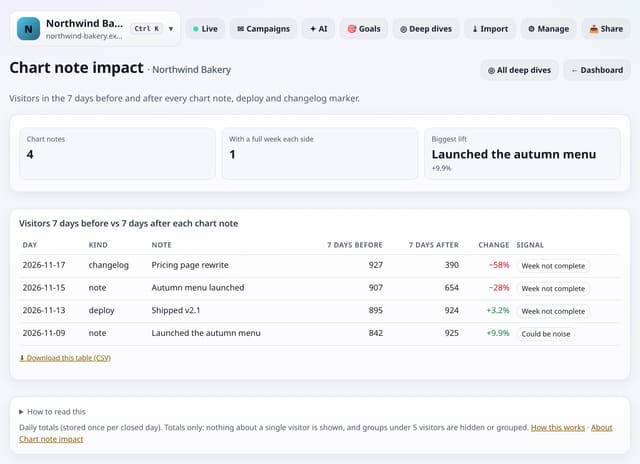
Visitors in the 7 days before and the 7 days after each chart note, deploy and changelog marker, with a plain label on whether the change is bigger than noise.
Why use it: You already log launches and changes as chart notes.
About Chart note impactHow to use it: Chart note impactQS-300
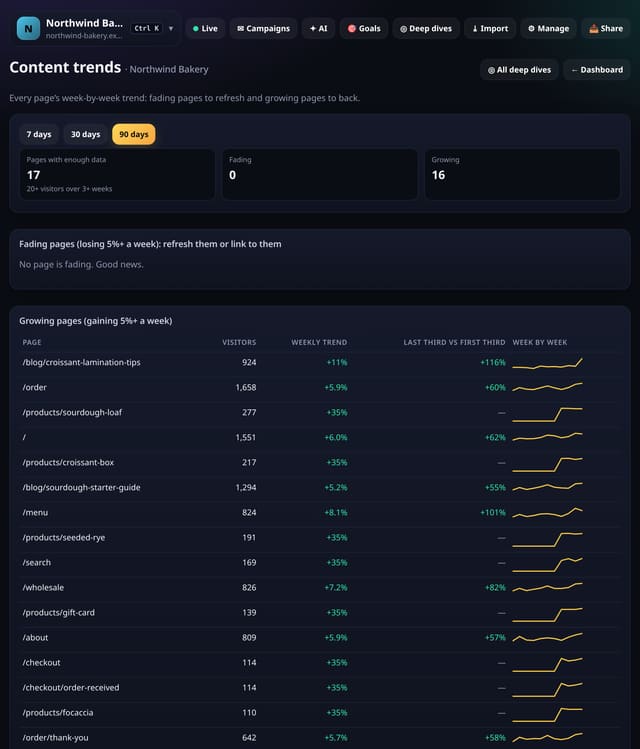
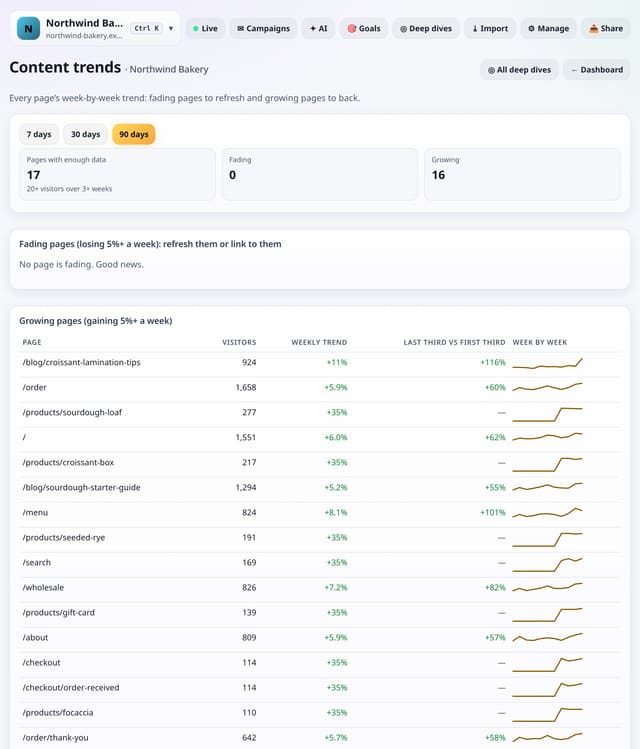
Every page’s week-by-week visitors with a trend line, so you can see which pages are fading and need a refresh and which are growing and deserve backing.
Why use it: Content decays quietly.
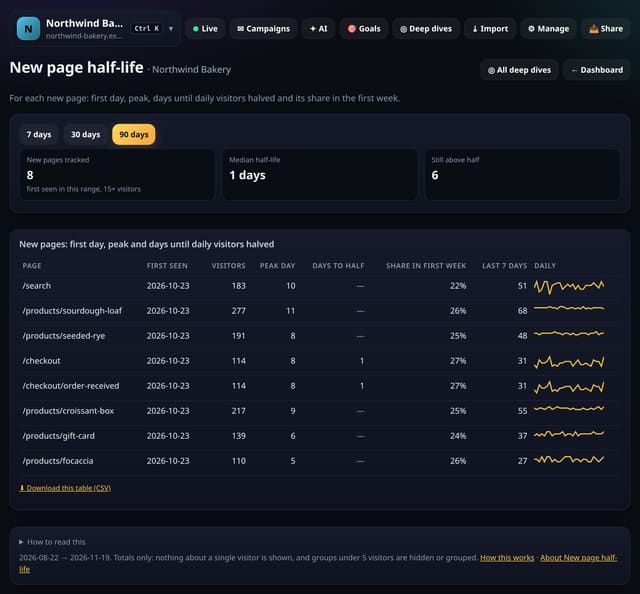
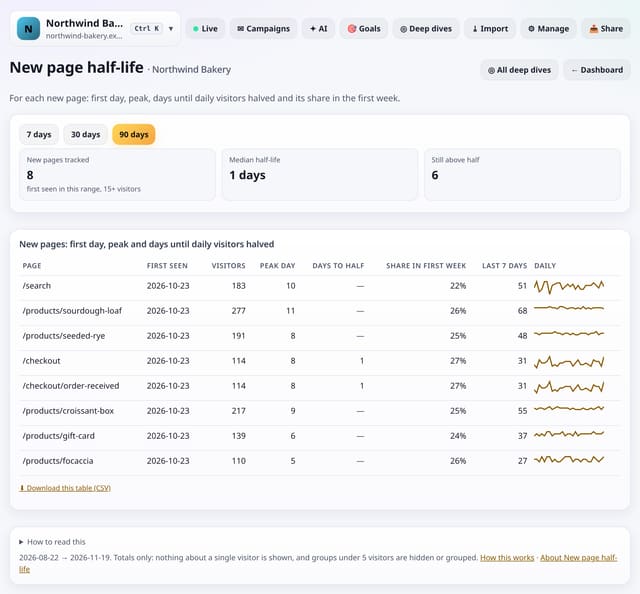
For every new page: the day it first got visitors, its busiest day, how many days until daily visitors halved, and how much of its traffic came in the first week.
Why use it: Some pages are news, some are evergreen.
About New page half-lifeHow to use it: New page half-lifeQS-302
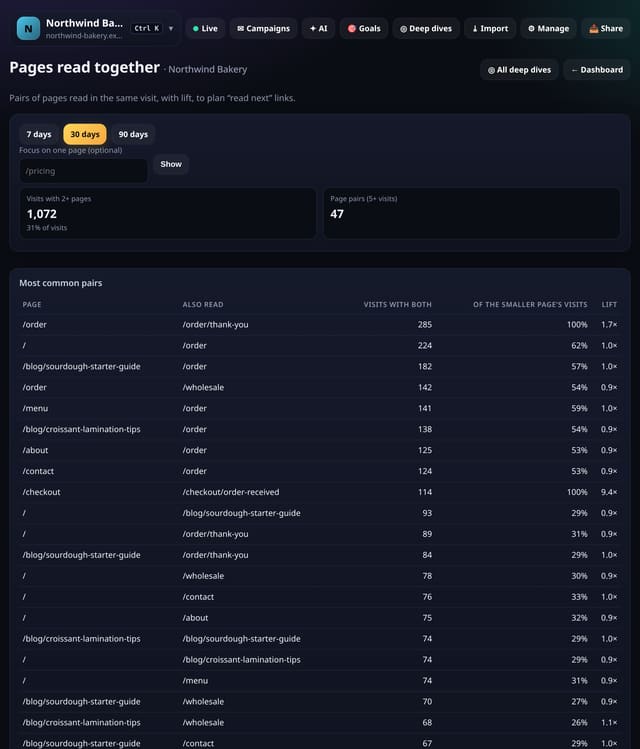
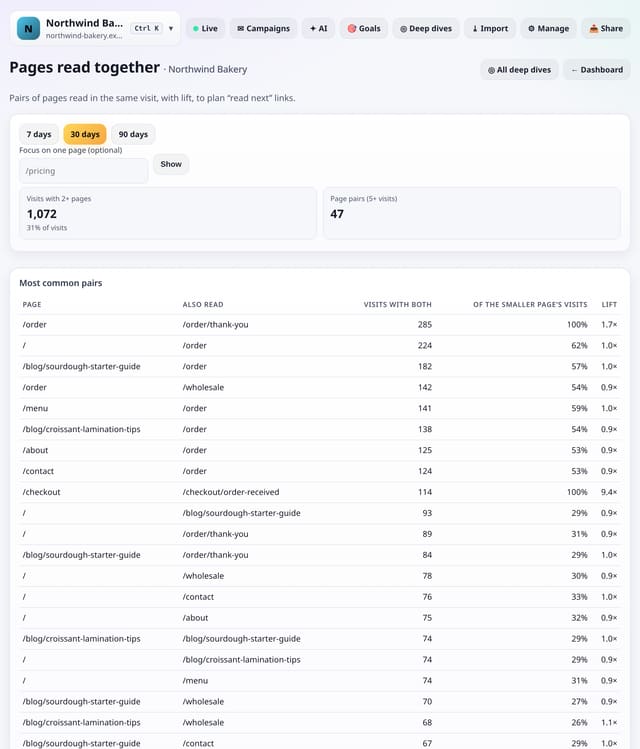
Pairs of pages people read in the same visit, how strongly they go together (lift), and an optional view for one page.
Why use it: Good internal links follow what readers already do.
About Pages read togetherHow to use it: Pages read togetherQS-303
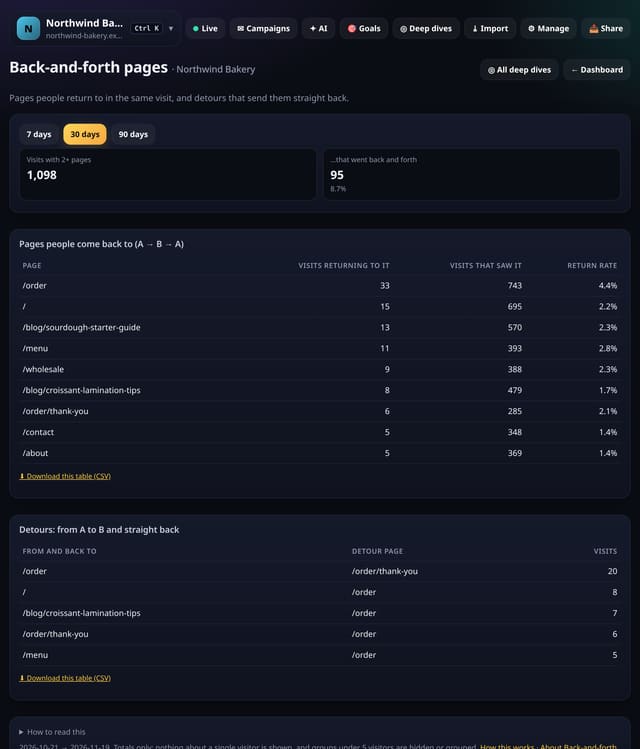
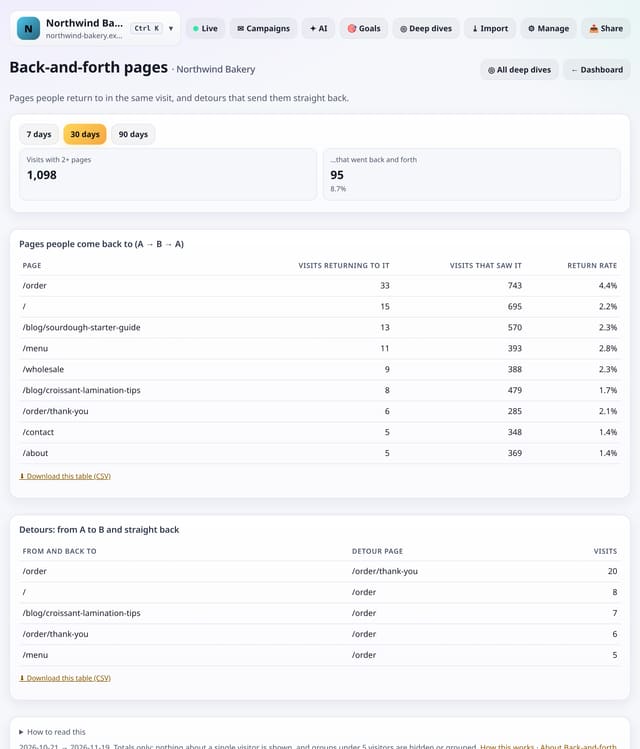
Pages people come back to in the same visit (A → B → A), and detours that send people straight back where they came from.
Why use it: A pricing table or a menu is meant to be returned to.
About Back-and-forth pagesHow to use it: Back-and-forth pagesQS-304
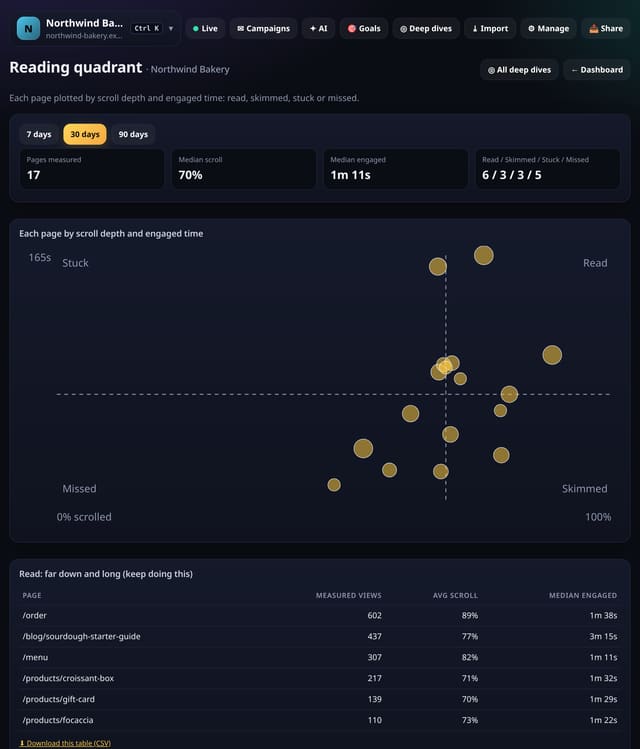
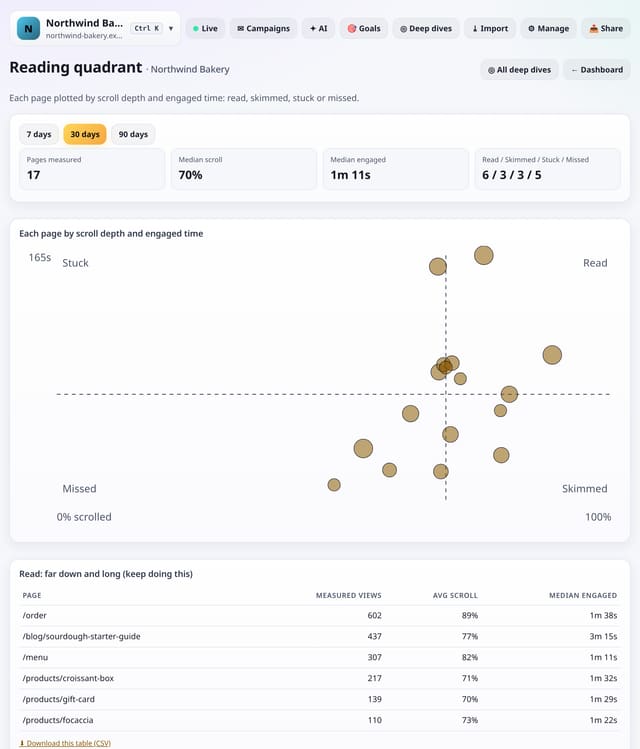
Every page plotted by scroll depth and engaged time against your own medians, sorted into four groups with a fix for each.
Why use it: One number per page hides why it works or not.
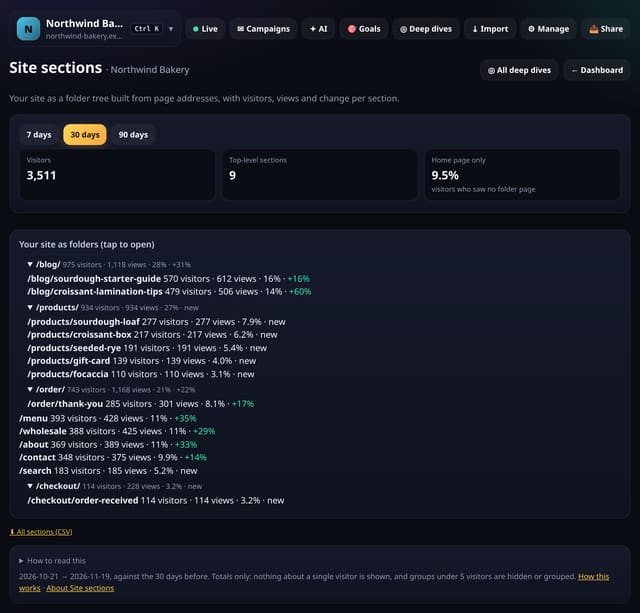
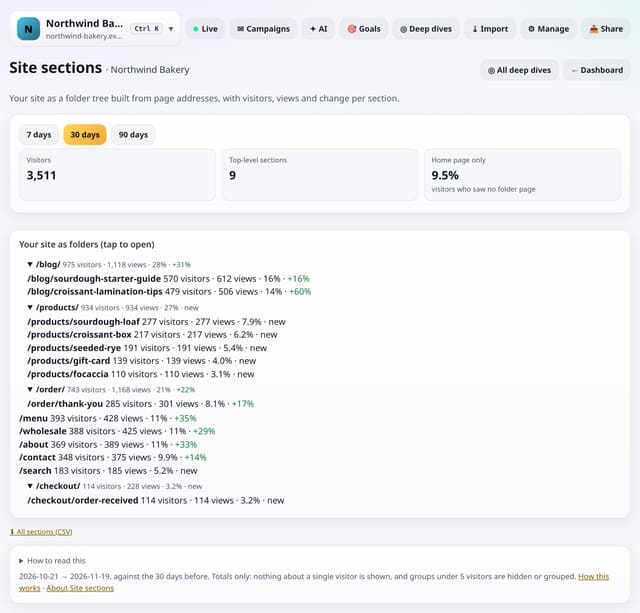
Traffic rolled up by URL folder, three levels deep, with visitors, pageviews, share and change for each section, built automatically.
Why use it: Content groups need setting up.
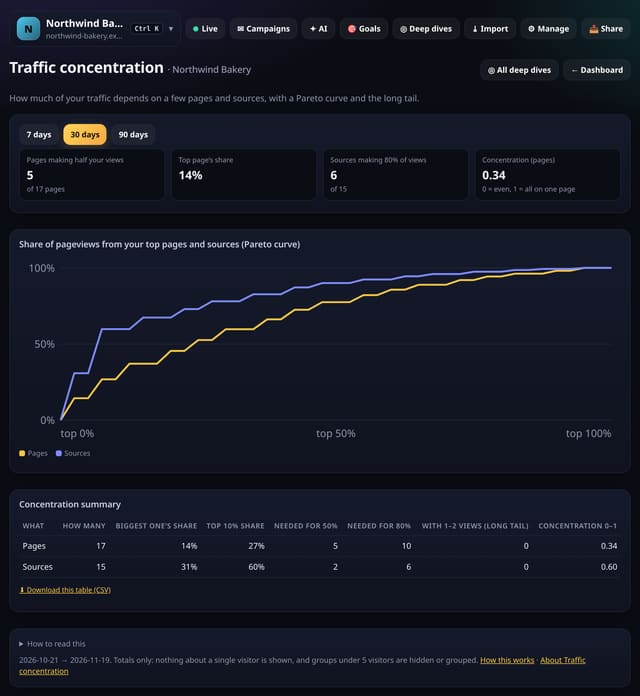
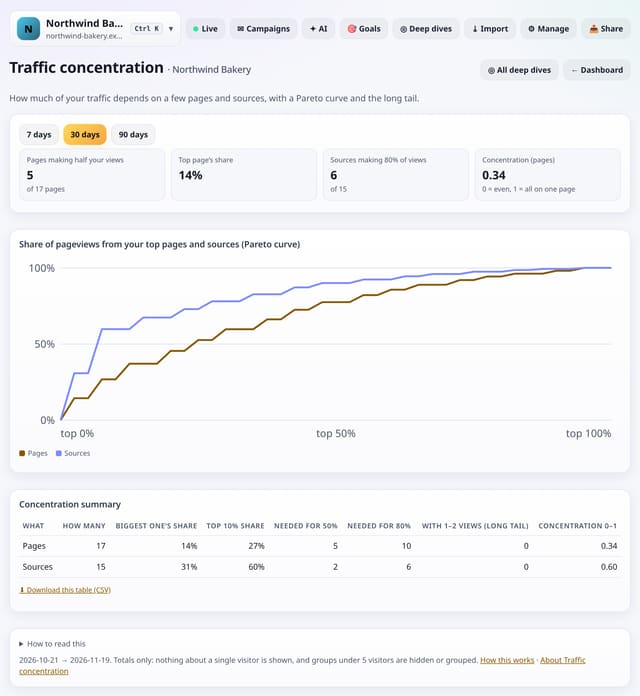
A Pareto curve and summary of how much of your traffic comes from your top pages and sources, plus the size of your long tail.
Why use it: If one page or one referrer carries the site, a single change can sink it.
About Traffic concentrationHow to use it: Traffic concentrationQS-307
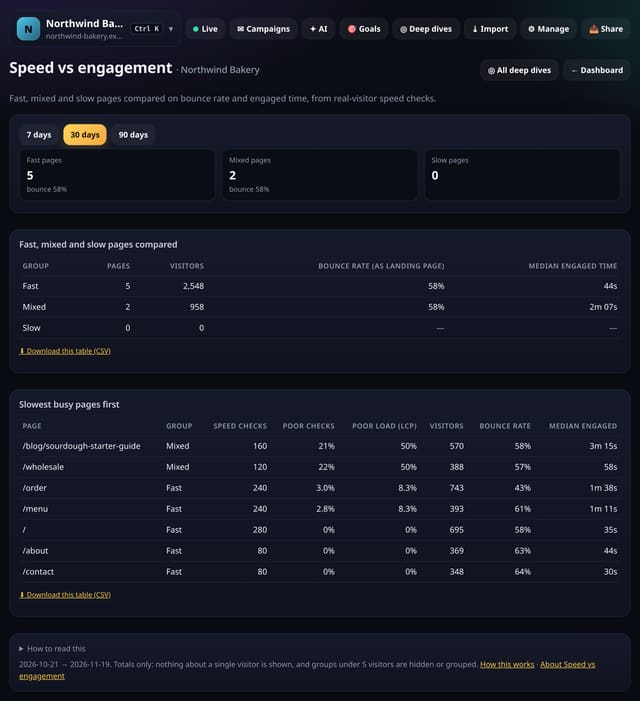
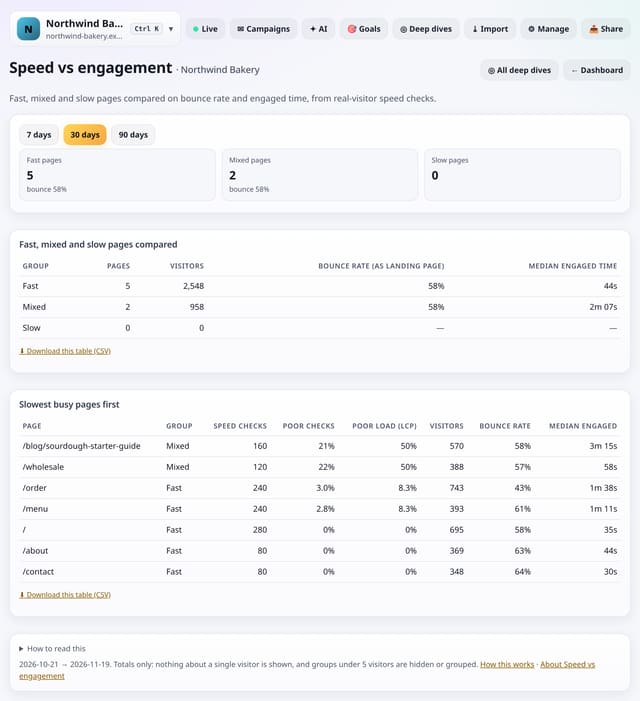
Pages grouped as fast, mixed or slow from real-visitor speed checks, compared on bounce rate and engaged time, with the slowest busy pages listed.
Why use it: Speed scores are abstract.
About Speed vs engagementHow to use it: Speed vs engagementQS-308
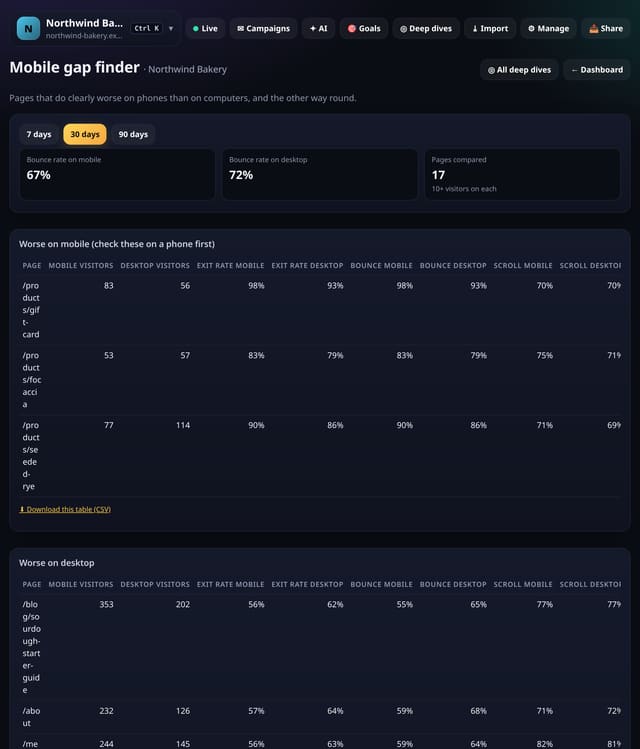
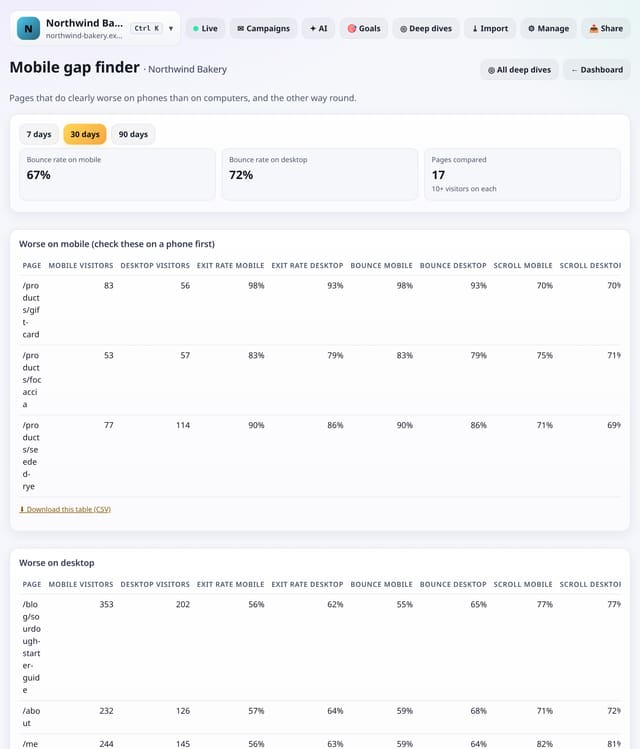
Pages that do clearly worse on phones than on computers (and the other way round), by exit rate, bounce rate and scroll depth.
Why use it: Most visits are on phones, but most pages are built on a laptop.
About Mobile gap finderHow to use it: Mobile gap finderQS-309
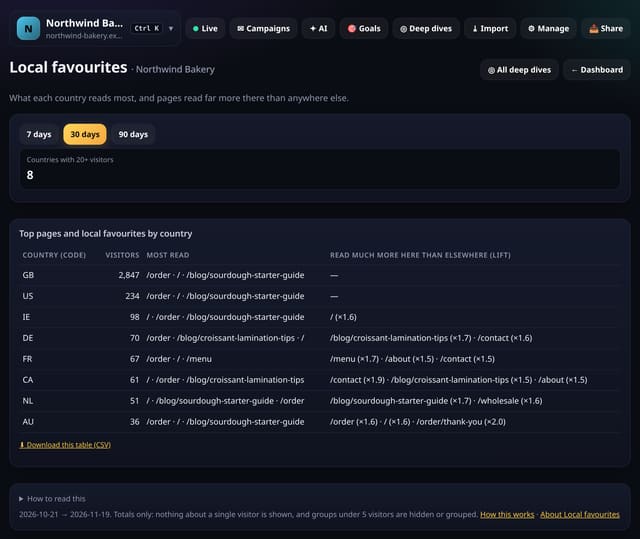
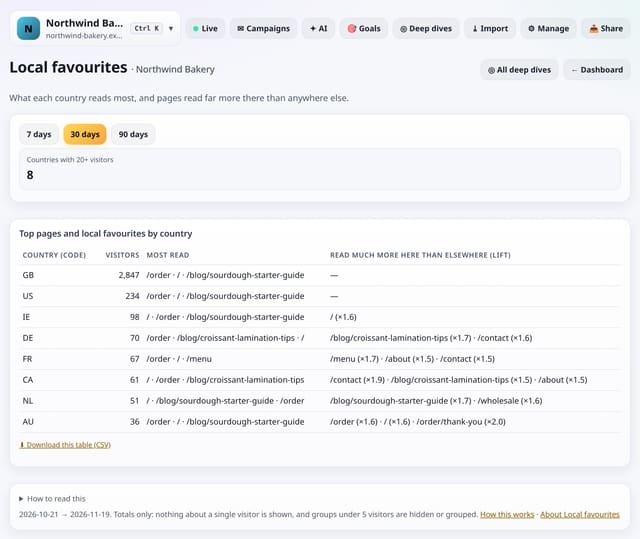
For each country with 20+ visitors: its most-read pages and the pages it reads far more than everyone else.
Why use it: A page that over-performs in one country is a cue for local offers, translations or timing posts for that audience.
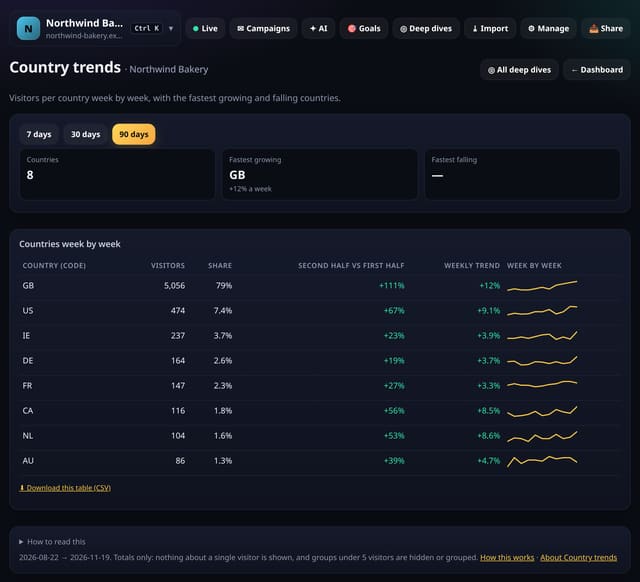
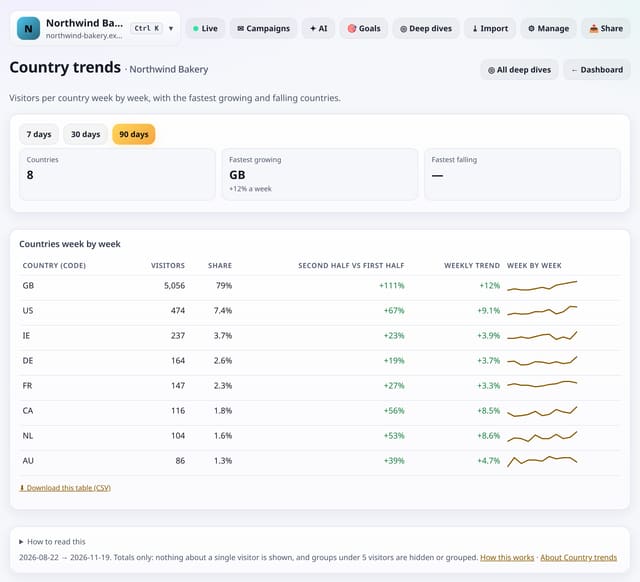
Visitors per country week by week, with each country’s trend, the second half of the range against the first, and the fastest growing and falling countries named.
Why use it: A new market often shows up as a small, fast-growing country long before it is big enough to notice on the map.
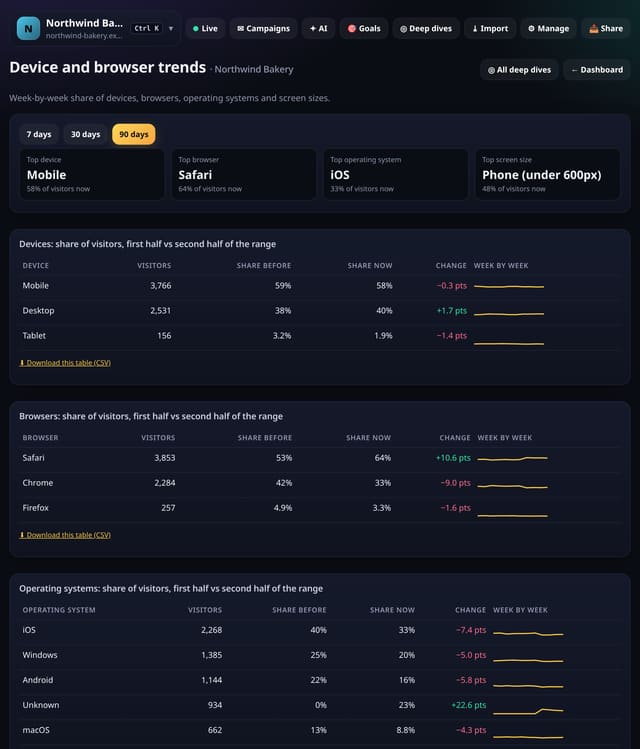
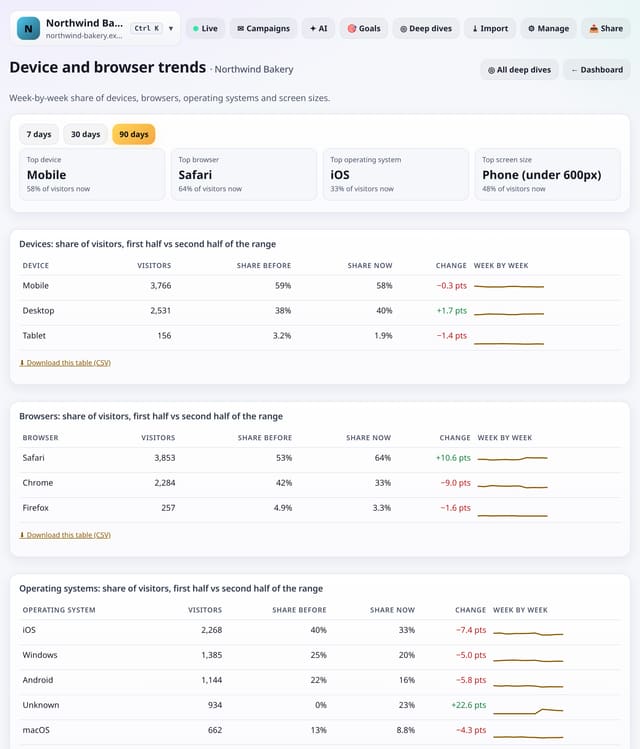
The share of visitors on each device, browser, operating system and screen size, week by week, with the change between the first and second half of the range.
Why use it: What you test on should follow what your visitors use.
About Device and browser trendsHow to use it: Device and browser trendsQS-312
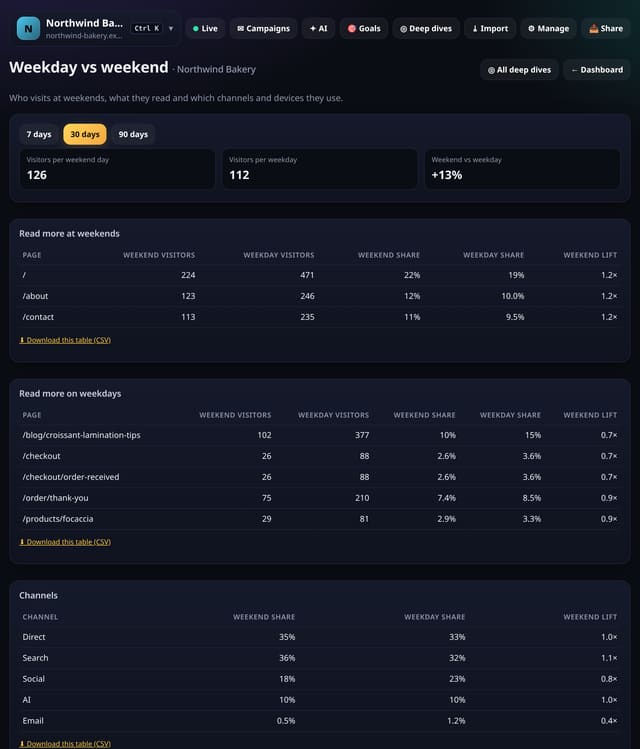
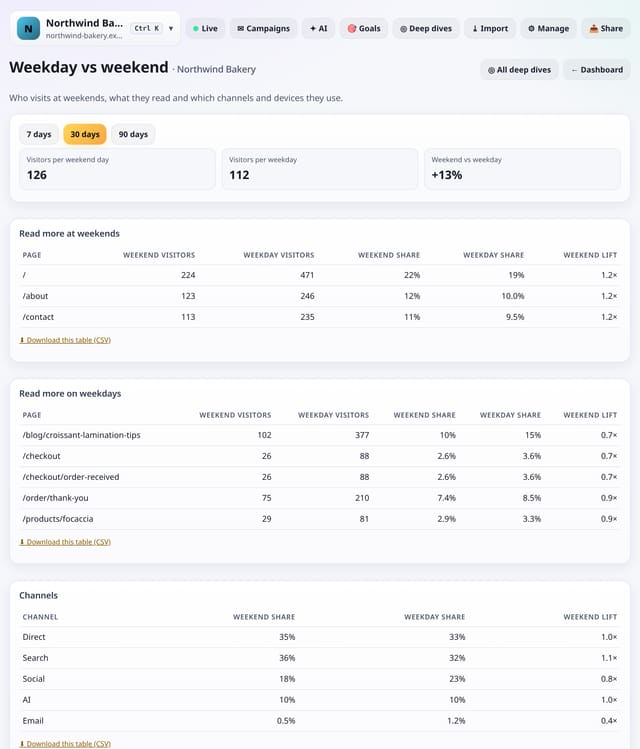
Visitors per weekend day against per weekday, the pages read more at weekends or on weekdays, and how channels and devices shift.
Why use it: Weekend readers are often a different audience.
About Weekday vs weekendHow to use it: Weekday vs weekendQS-313
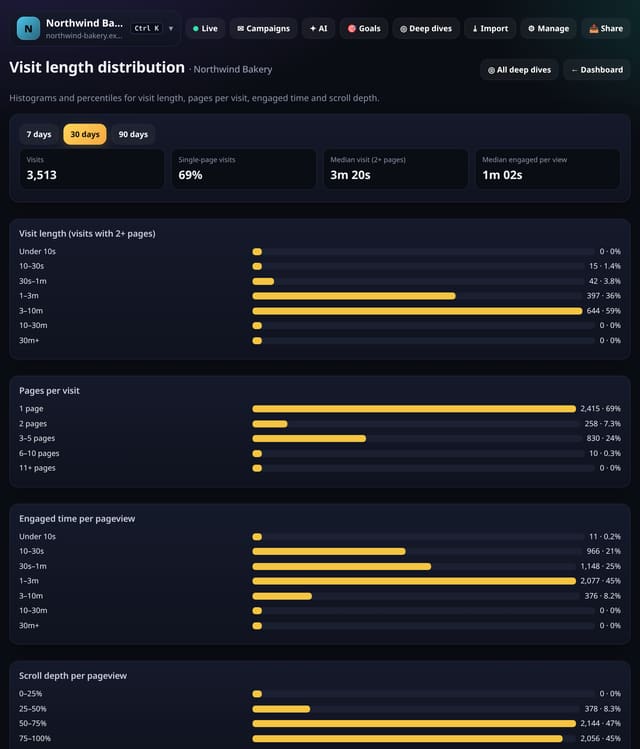
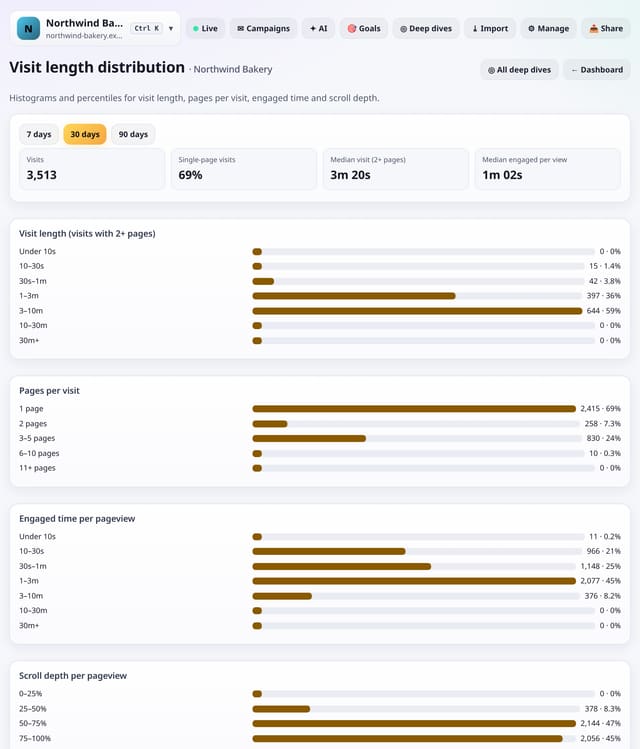
Histograms and percentiles for visit length, pages per visit, engaged time per pageview and scroll depth, so you can see the shape, not just the average.
Why use it: An average visit of 2 minutes can mean everyone stays 2 minutes or most leave at once and a few stay 20.
About Visit length distributionHow to use it: Visit length distributionQS-314
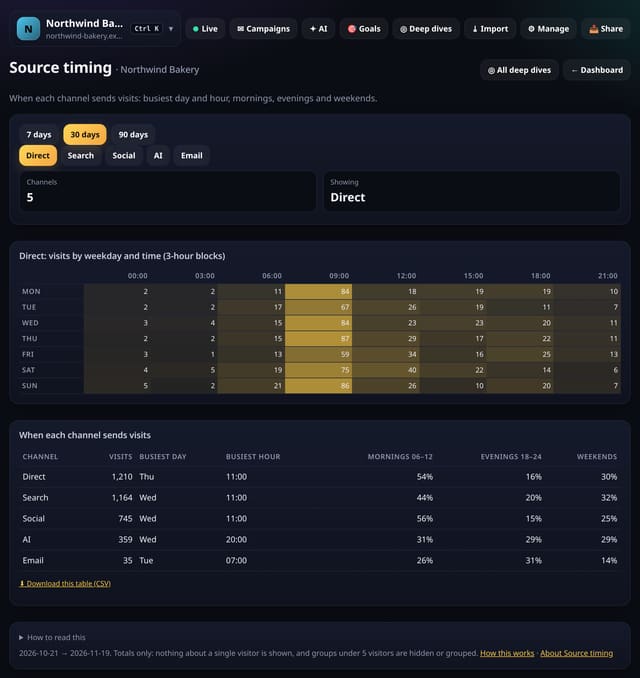
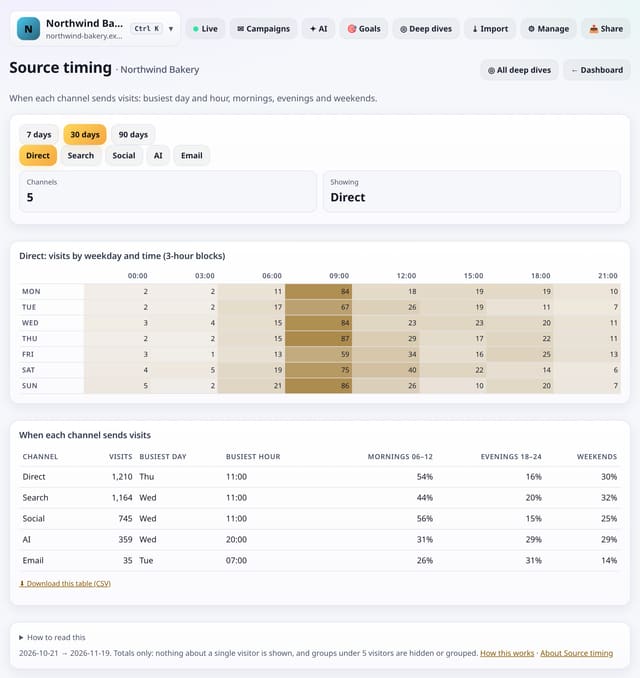
For each channel: its busiest day and hour, its share of mornings, evenings and weekends, and a weekday-by-time grid for the channel you pick.
Why use it: Search traffic, social traffic and newsletter traffic arrive at different times.
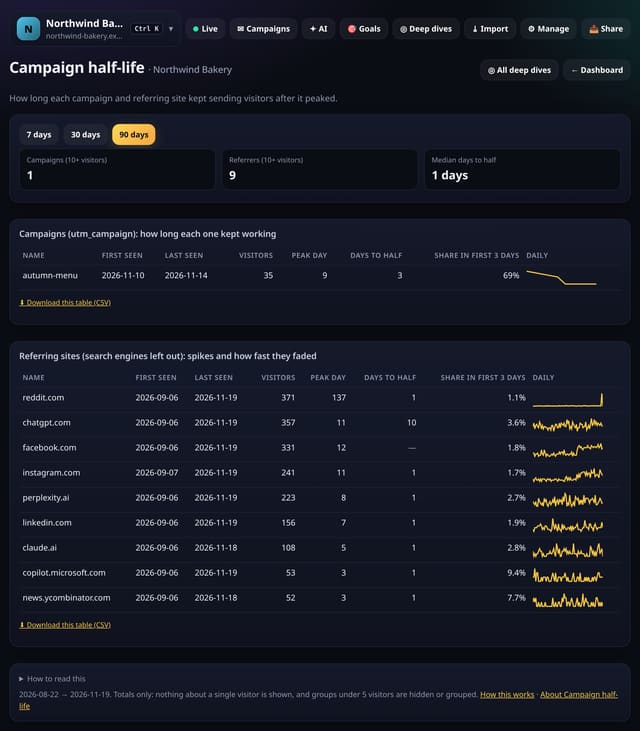
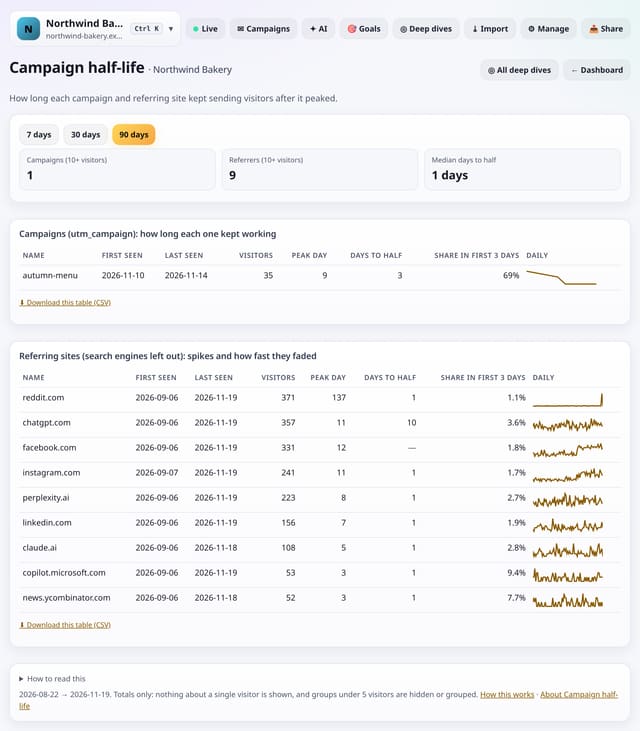
For each campaign tag and referring site: first and last day, peak day, days until it halved, and how much came in the first 3 days.
Why use it: A newsletter fades in a day, a good backlink keeps sending.
About Campaign half-lifeHow to use it: Campaign half-lifeQS-316
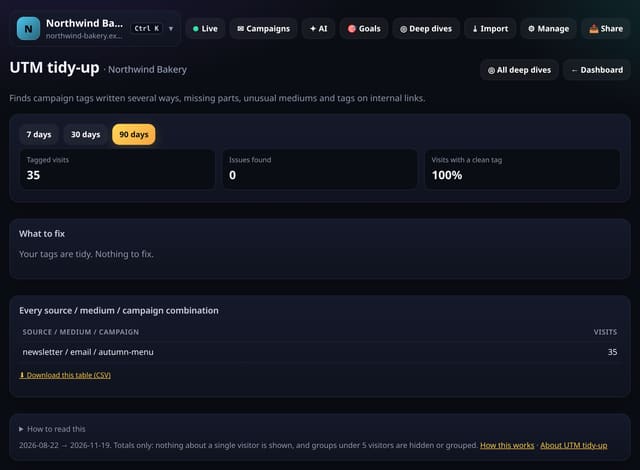
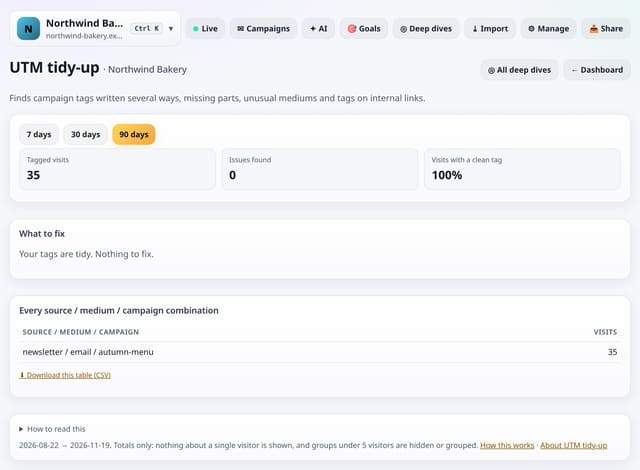
Finds campaign tags written several ways, campaigns missing a source or medium, unusual mediums, messy values and tags on links inside your own site, with a fix for each.
Why use it: Messy tags split one campaign into several rows and send visits to the wrong channel.
Cross any two of page, landing page, source, channel, country, device, browser, operating system, screen size, language, campaign, weekday and hour, counting visitors, pageviews or visits.
Why use it: Most questions are two-dimensional: which pages do mobile readers open, which countries come from which source.
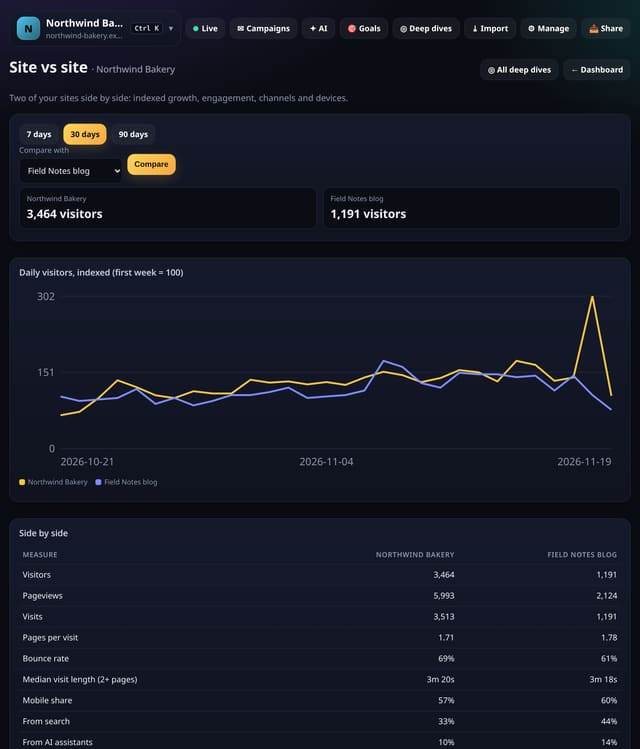
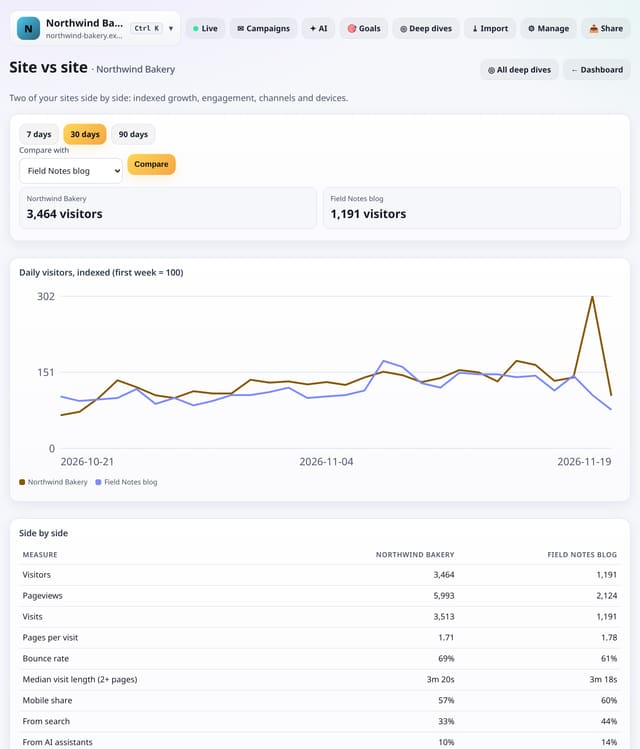
Two sites from your account side by side: daily visitors indexed to 100, and visitors, pageviews, pages per visit, bounce rate, visit length, mobile share, search and AI share and top channel.
Why use it: Agencies and owners of several sites want to know which one is really growing and which audience behaves best, whatever their size.
50 more Analysis lab stats, added later the same day. Find them under Deep dives → Analysis lab, or search for any of them on All reports.
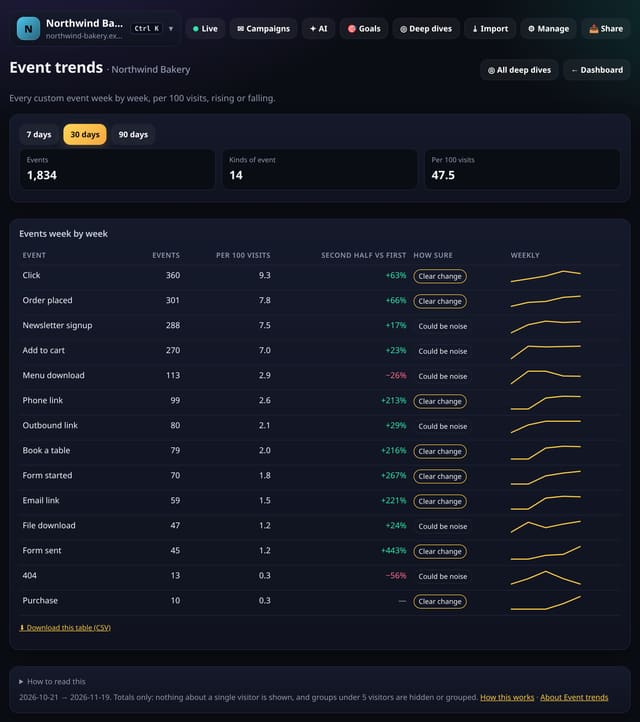
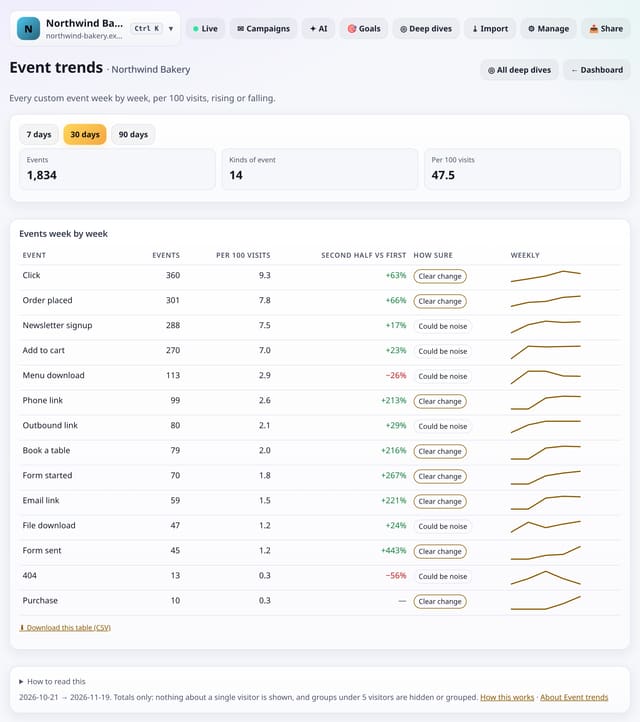
See every custom event week by week, per 100 visits, with a plain label saying whether the change is real or could be noise.
Why use it: Events are easy to set up and easy to forget.
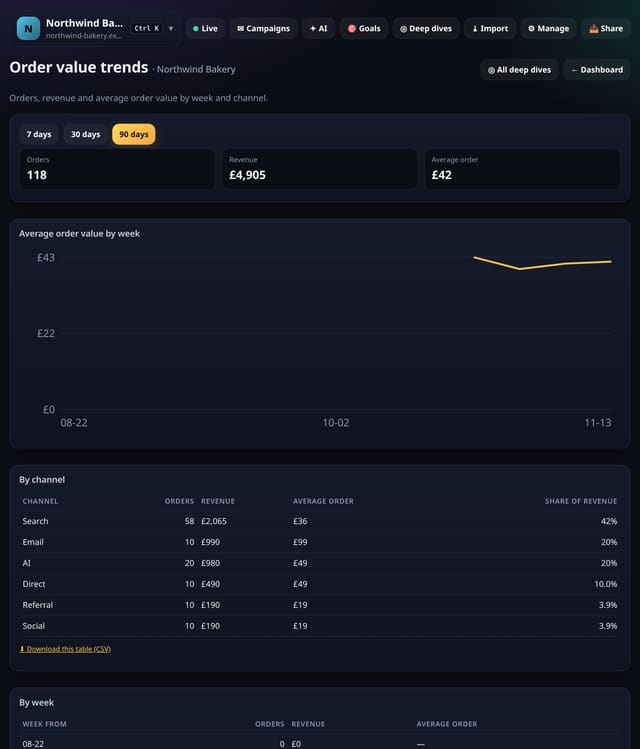
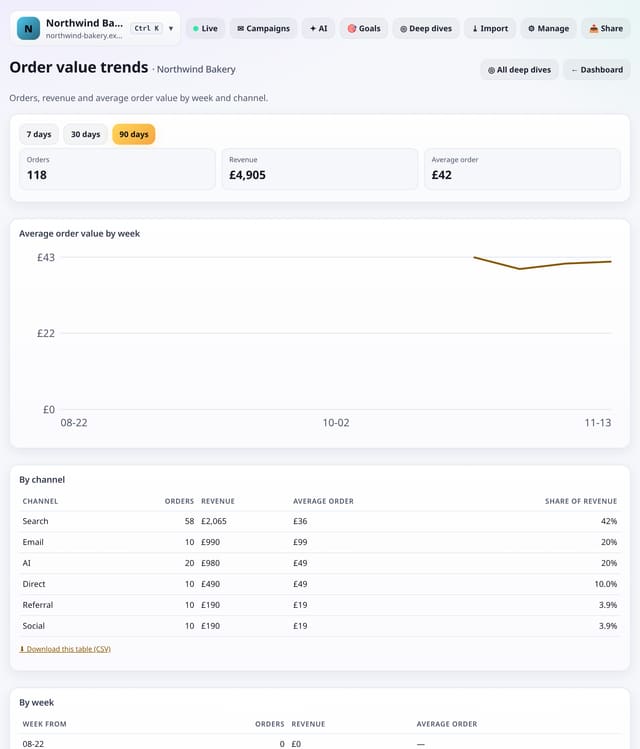
Orders, revenue and average order value by week and by channel, from the revenue quietstats already records.
Why use it: Revenue going up can mean more orders or bigger orders.
About Order value trendsHow to use it: Order value trendsQS-321
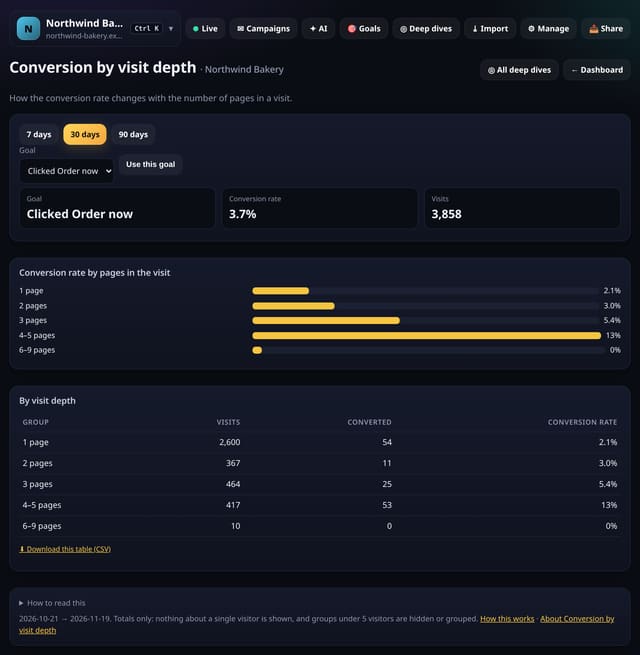
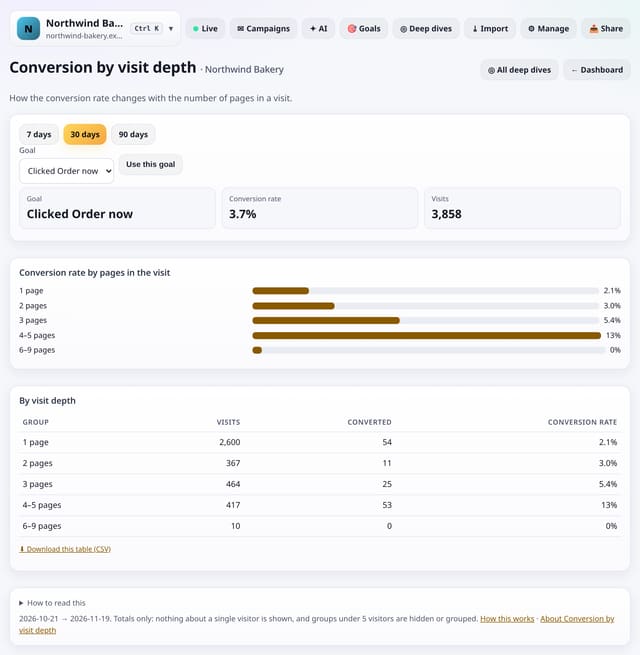
How the conversion rate changes with the number of pages in a visit: one page, two, three, up to ten and more.
Why use it: If two-page visits convert several times better than one-page visits, the cheapest win is helping people reach a second page.
About Conversion by visit depthHow to use it: Conversion by visit depthQS-322
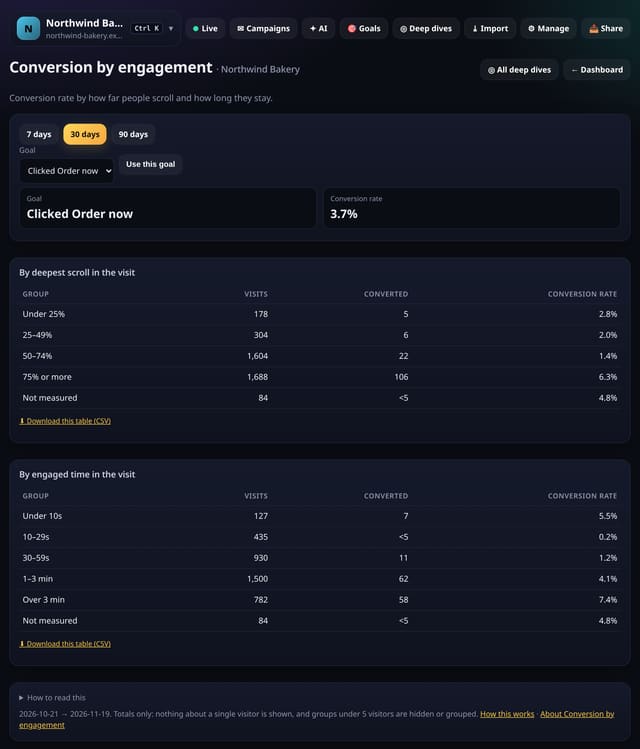
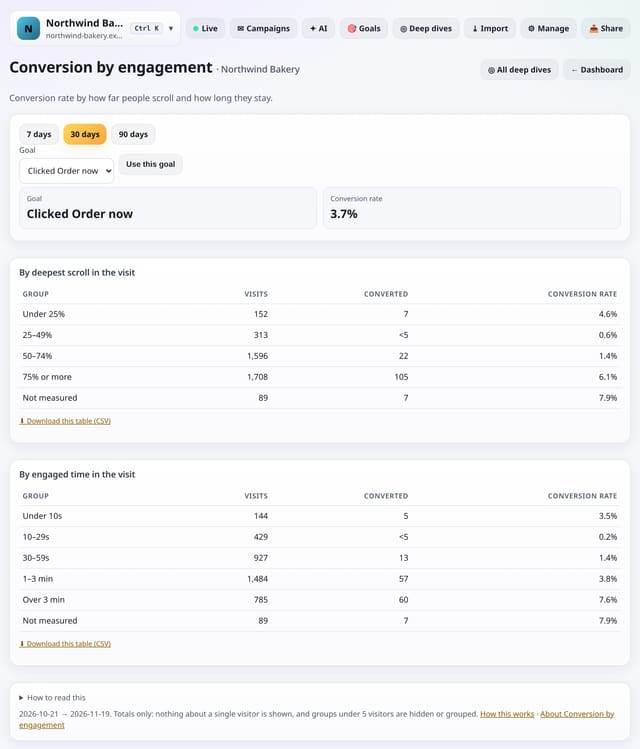
Conversion rate by how far people scroll and how long they engage, so you can see where interest turns into action.
Why use it: It shows whether people who read further convert more, which tells you whether to move your call to action up or make the page easier to read.
About Conversion by engagementHow to use it: Conversion by engagementQS-323
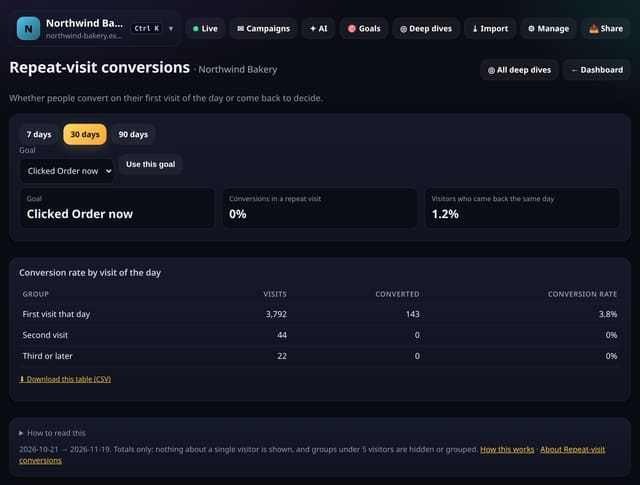
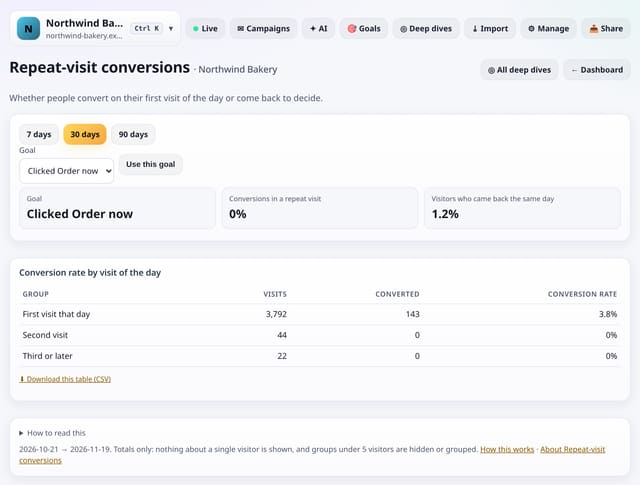
Whether people convert on their first visit of the day or come back later that day to decide.
Why use it: If many conversions come in a second visit, people are comparing or checking.
About Repeat-visit conversionsHow to use it: Repeat-visit conversionsQS-324
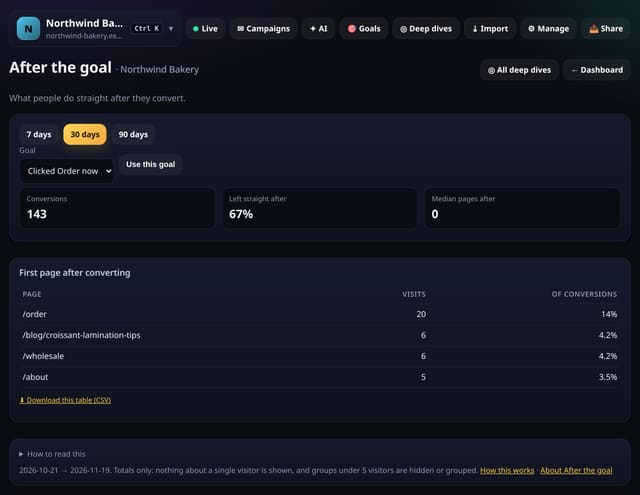
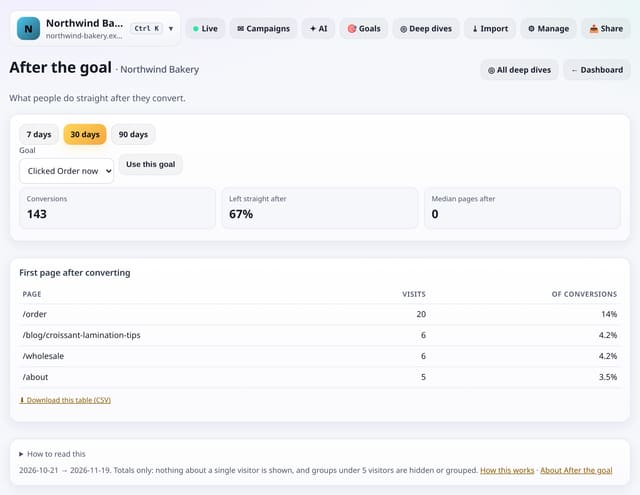
What people do straight after converting: leave, or go on to another page, and which pages they visit next.
Why use it: The moment after a conversion is when people trust you most.
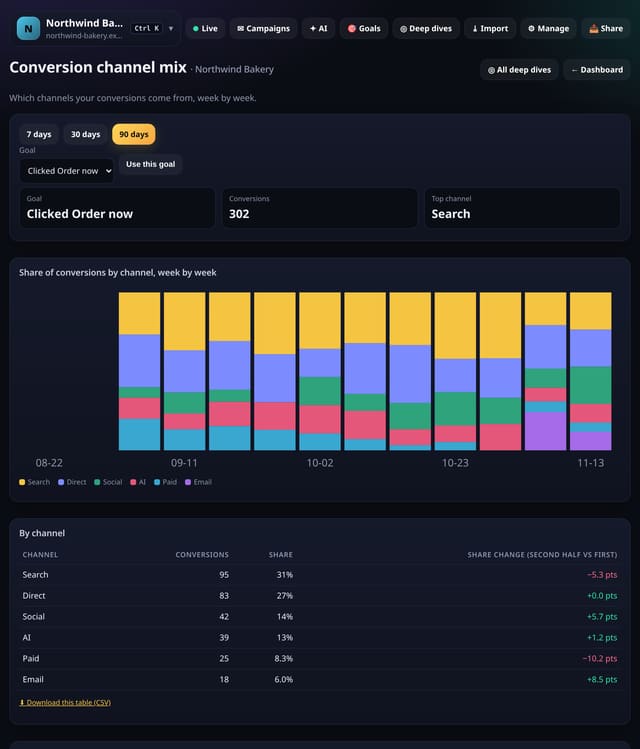
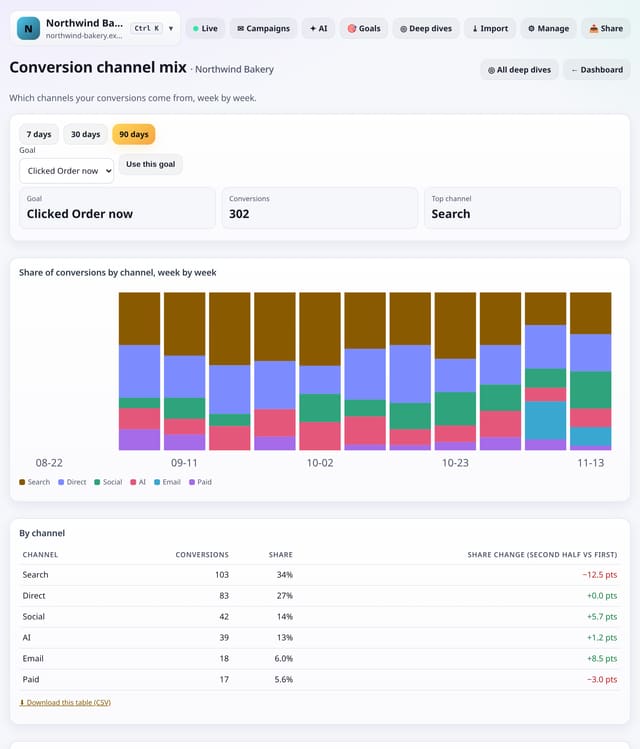
Each channel’s share of your conversions, week by week, and whether it is gaining or losing ground.
Why use it: Channel mix by visitors can hide what matters.
About Conversion channel mixHow to use it: Conversion channel mixQS-326
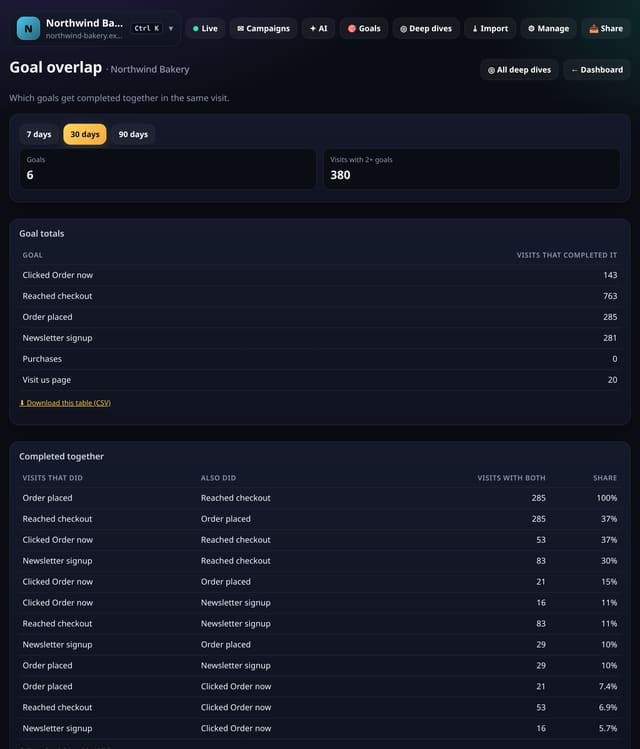
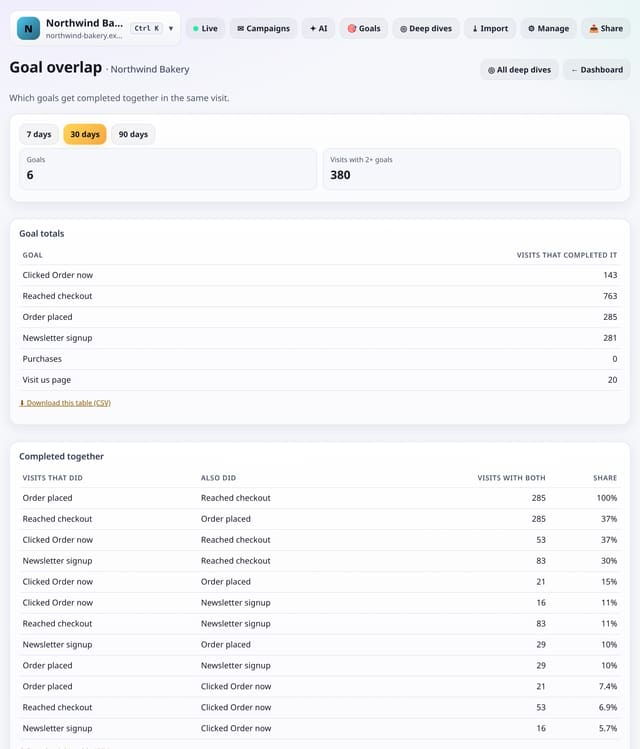
Which of your goals are completed together in the same visit, so you can see how goals relate.
Why use it: If almost everyone who signs up also reads pricing first, the two goals are linked.
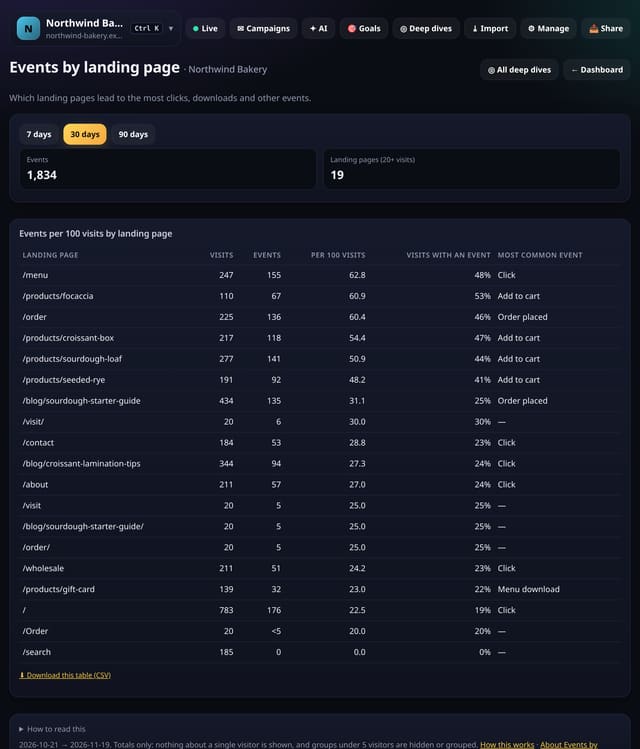
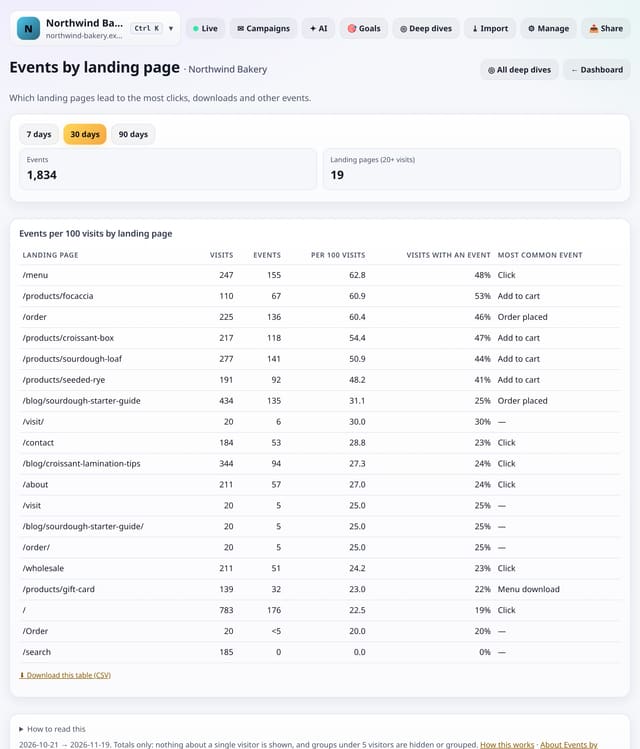
Which landing pages lead to the most clicks, downloads, form sends and other events, per 100 visits.
Why use it: Some landing pages bring people who do things; others bring people who just look.
About Events by landing pageHow to use it: Events by landing pageQS-328
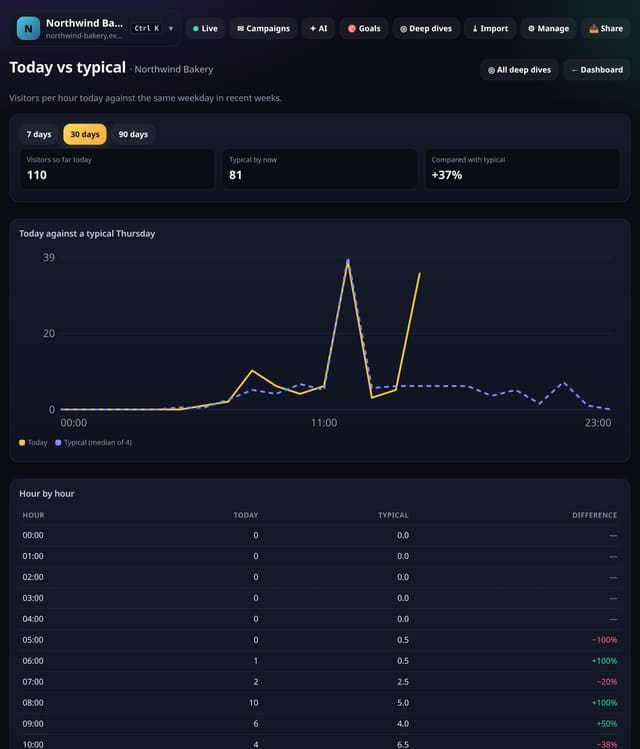
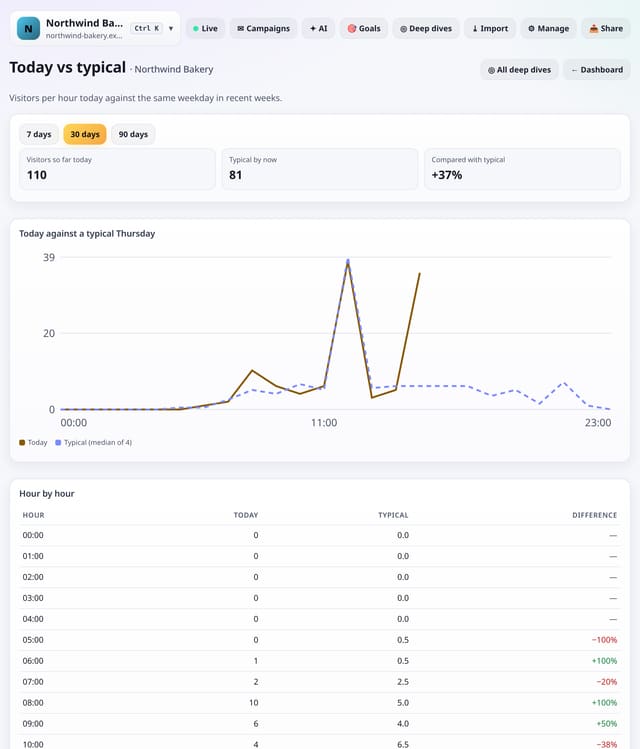
Visitors per hour today against the median of the same weekday over recent weeks, with a running total.
Why use it: A quiet morning on a Monday may be normal.
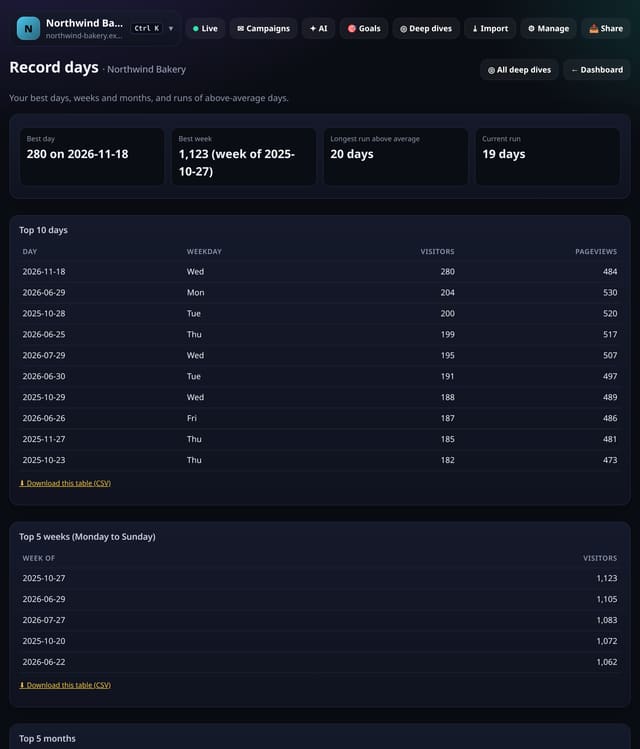
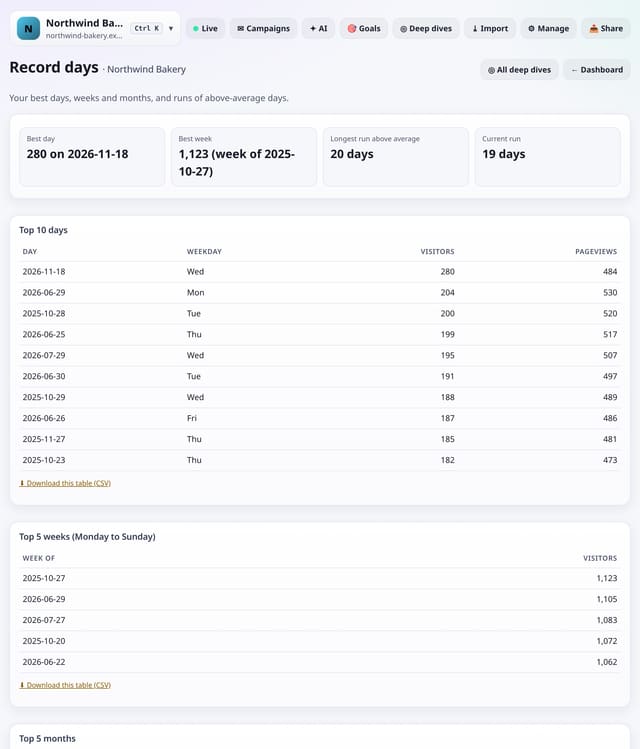
Your top 10 days, top weeks and top months, and your longest run of above-average days.
Why use it: Milestones are fun, but records are useful too: they show what a great day looks like, and what caused it.
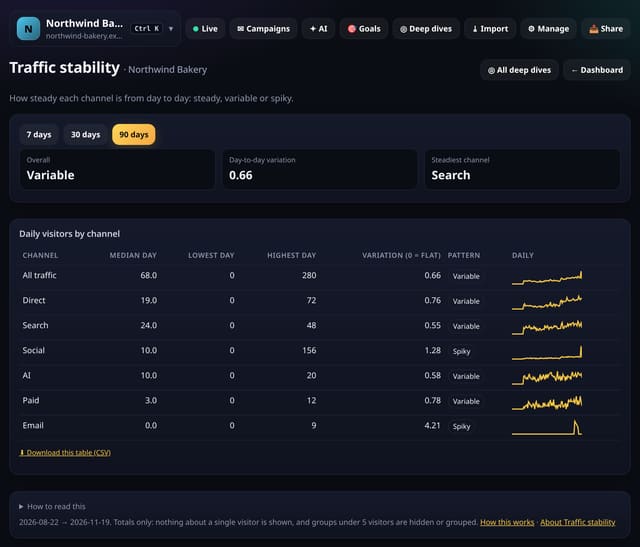
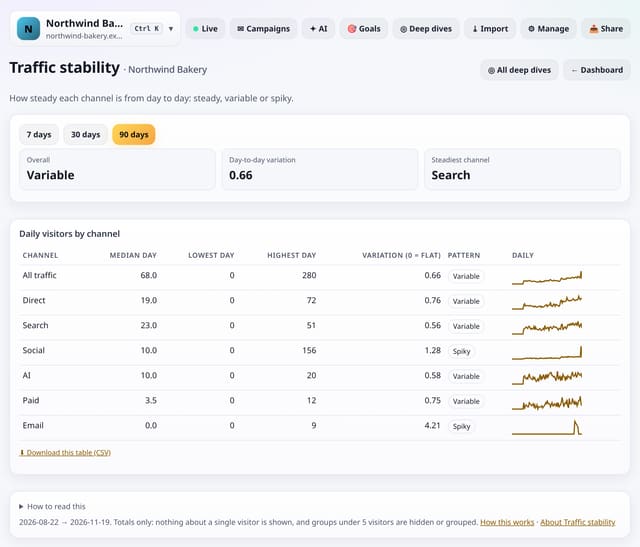
How steady your traffic is from day to day, overall and for each channel, with a plain Steady, Variable or Spiky label.
Why use it: Steady channels are easy to plan around; spiky ones are not.
About Traffic stabilityHow to use it: Traffic stabilityQS-331
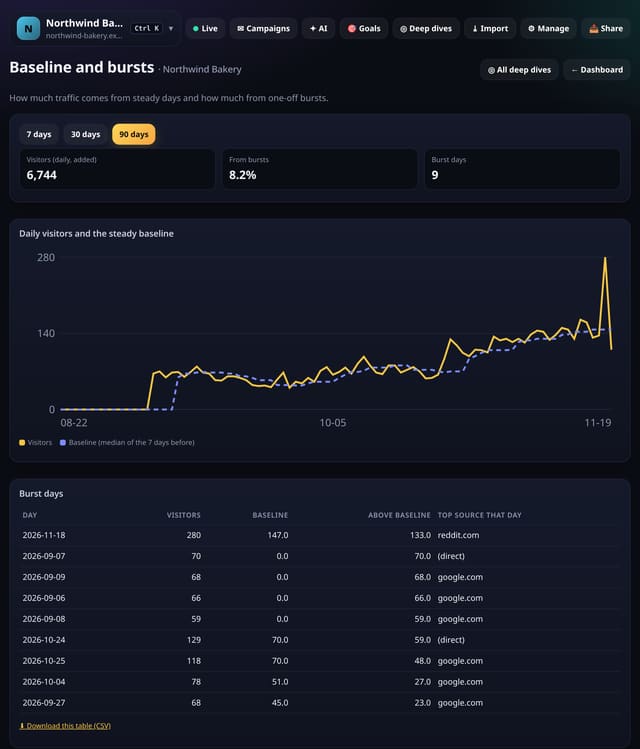
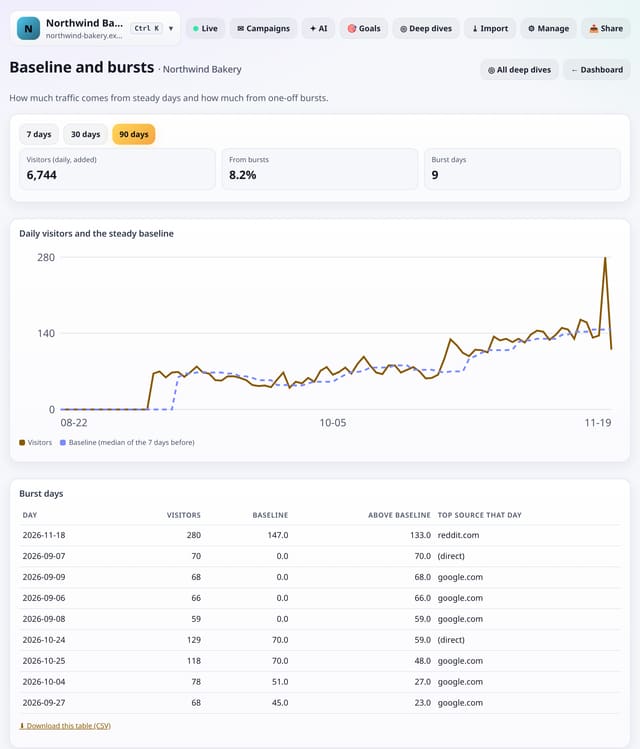
How much of your traffic comes from steady days and how much from bursts, with the source behind each burst day.
Why use it: A site that lives on bursts needs a steady source too.
About Baseline and burstsHow to use it: Baseline and burstsQS-332
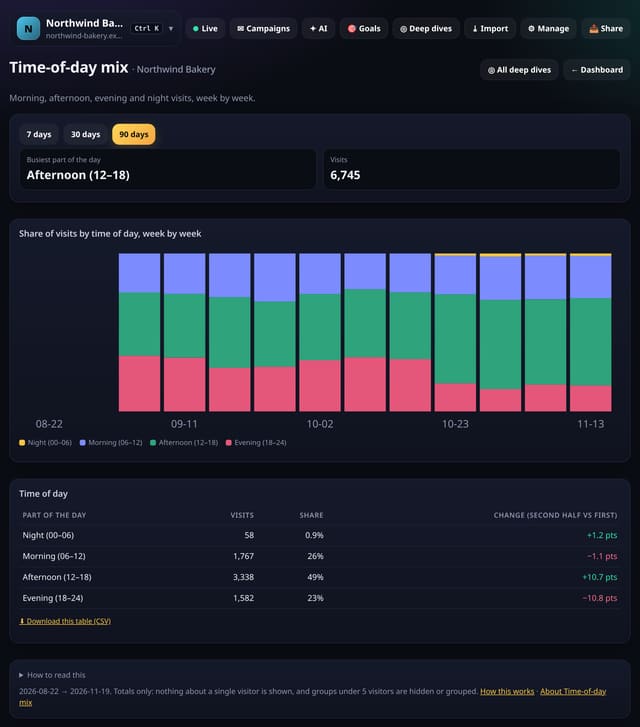
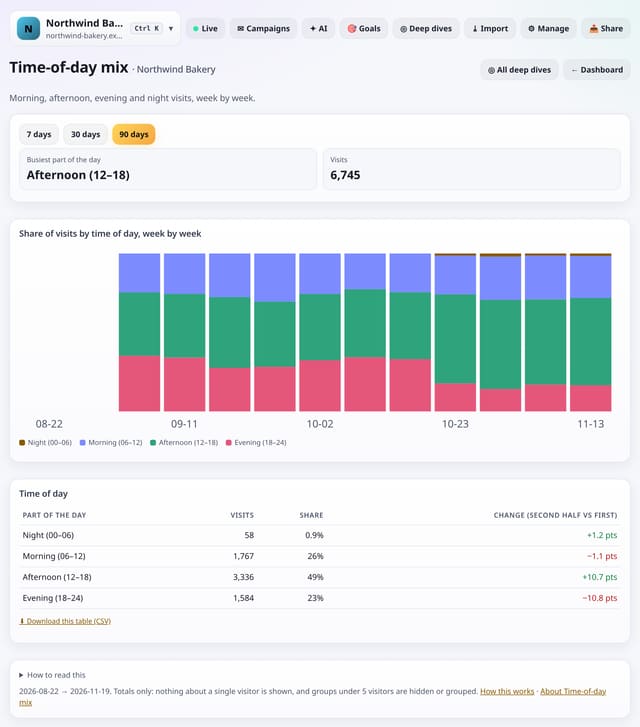
The share of visits in the morning, afternoon, evening and night, week by week, and how it is shifting.
Why use it: Audiences move: a new channel or season can turn a morning site into an evening one.
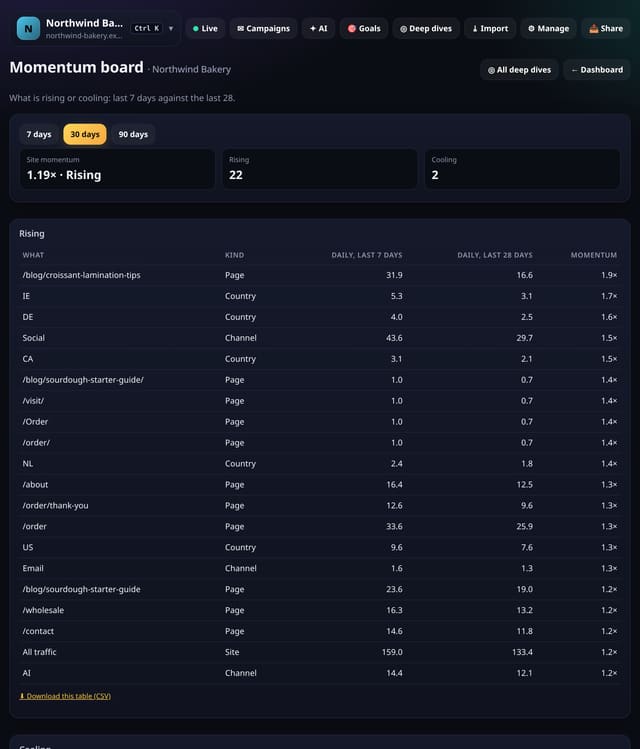
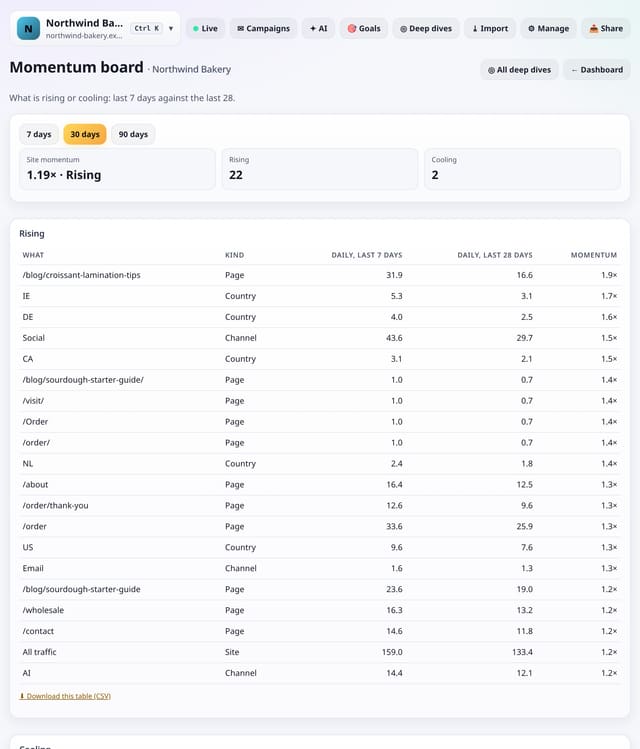
Your site, channels, pages and countries, sorted into Rising and Cooling by comparing the last 7 days with the last 28.
Why use it: Momentum is the quickest way to see what deserves attention this week: back the things rising, check the things cooling.
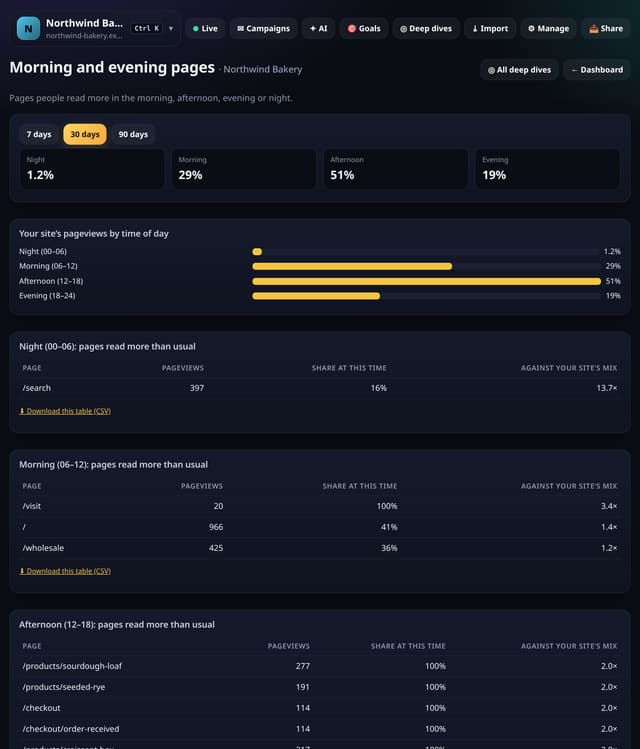
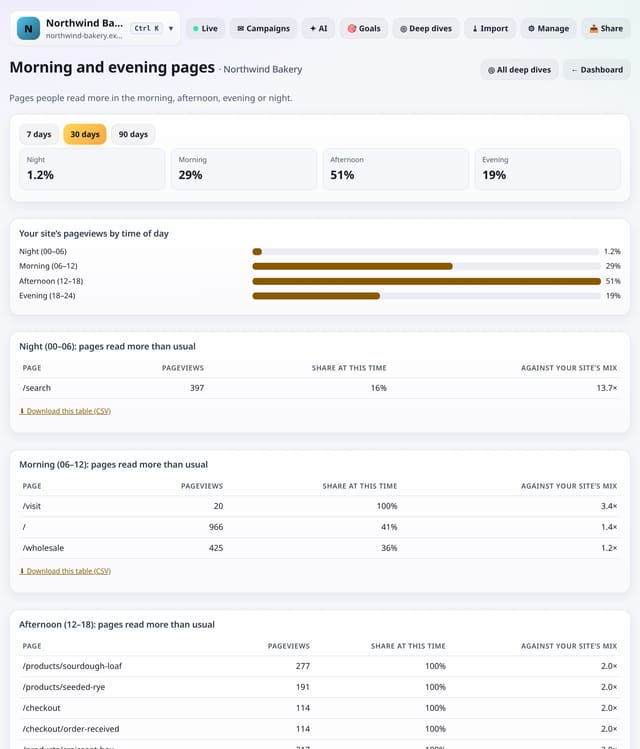
Pages people read more than usual in the morning, afternoon, evening or night, against your site’s own mix.
Why use it: Different topics have different hours.
About Morning and evening pagesHow to use it: Morning and evening pagesQS-335
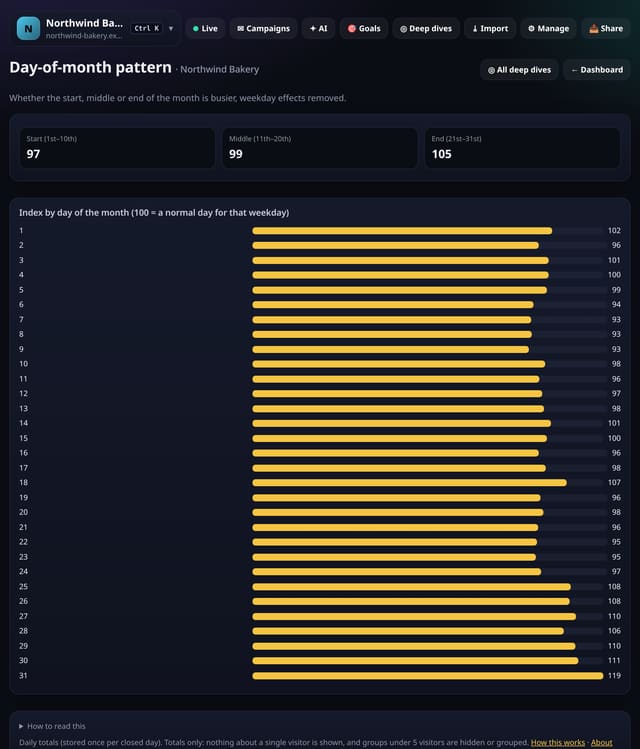
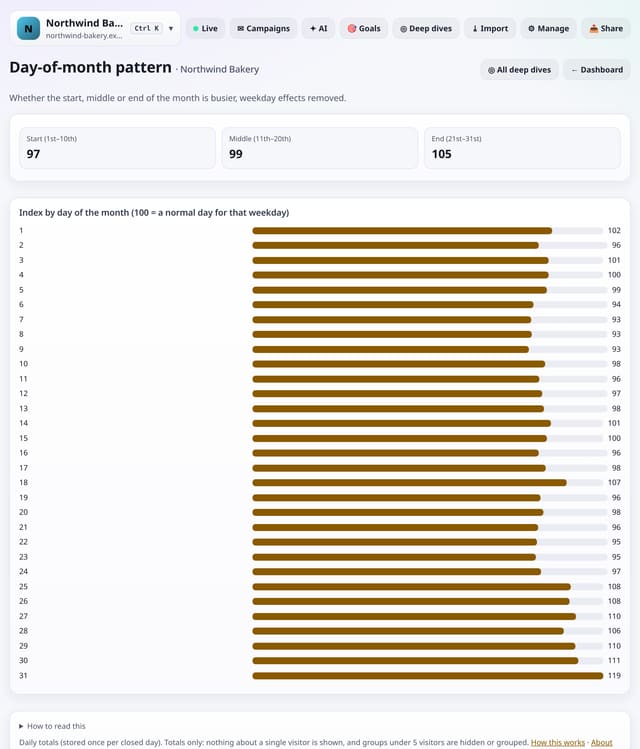
Whether the start, middle or end of the month is busier, with weekday effects taken out.
Why use it: Payday, billing and month-end patterns are real for shops, B2B and finance sites.
About Day-of-month patternHow to use it: Day-of-month patternQS-368
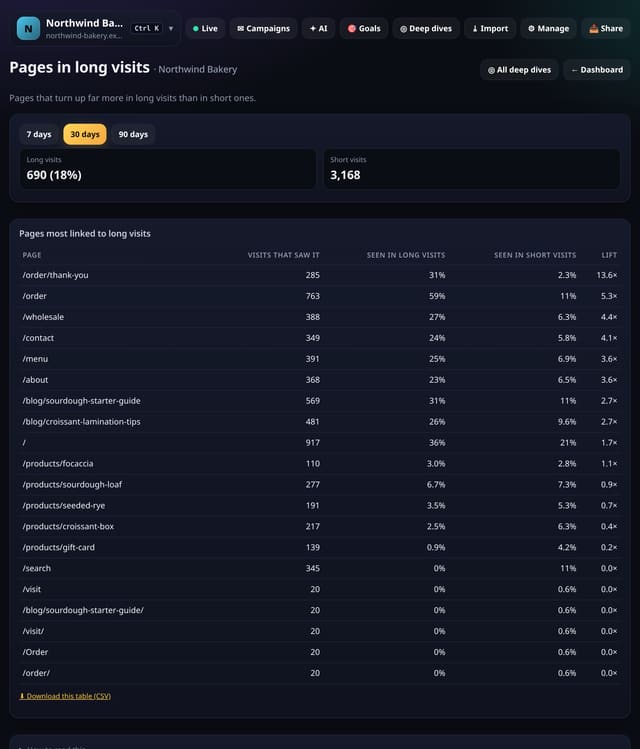
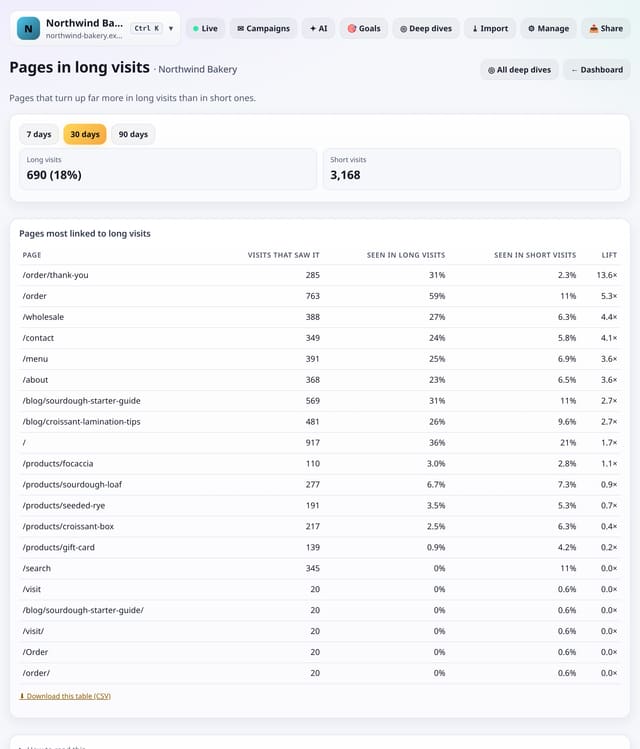
Pages that turn up far more in long visits than in short ones, with a lift score.
Why use it: These are the pages that pull people deeper.
About Pages in long visitsHow to use it: Pages in long visitsQS-336
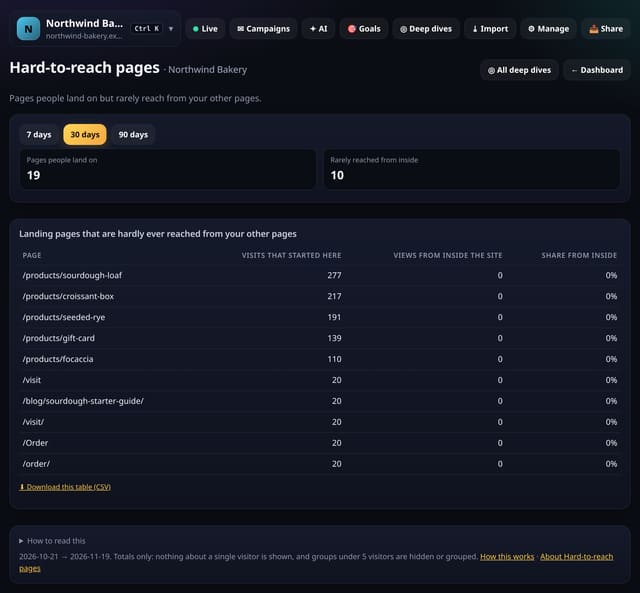
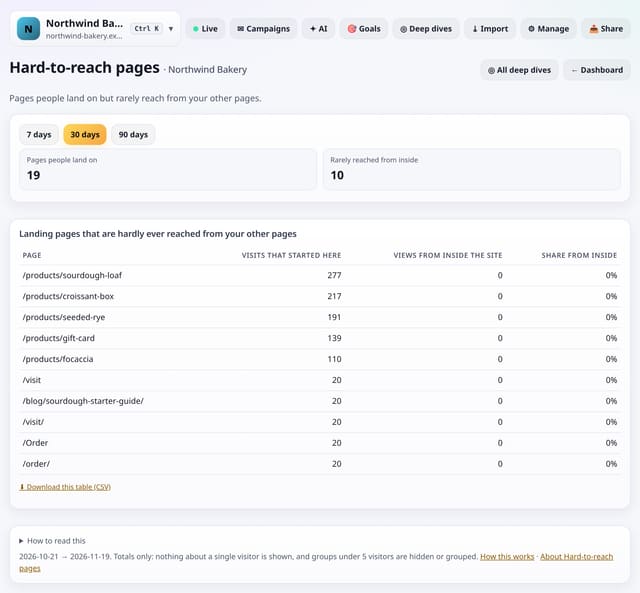
Pages people land on from outside but rarely reach from your other pages.
Why use it: If search or social brings people to a page your own visitors never find, it may deserve a link from your menu or from related pages.
About Hard-to-reach pagesHow to use it: Hard-to-reach pagesQS-337
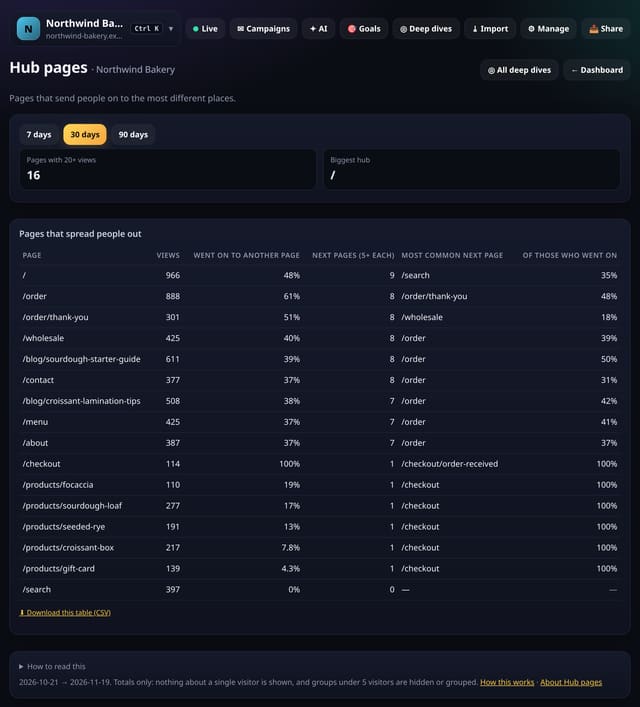
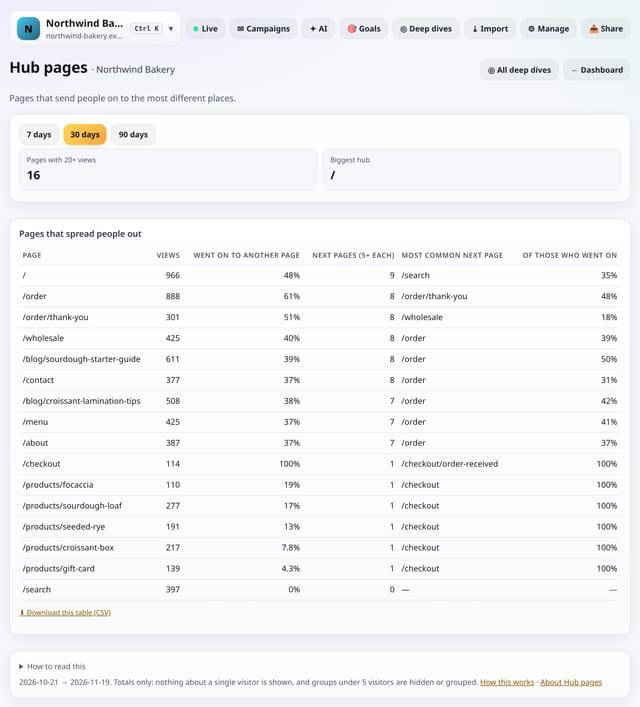
Pages that send people on to the most different places, with the share that go on and the main next page.
Why use it: Good hubs spread people out.
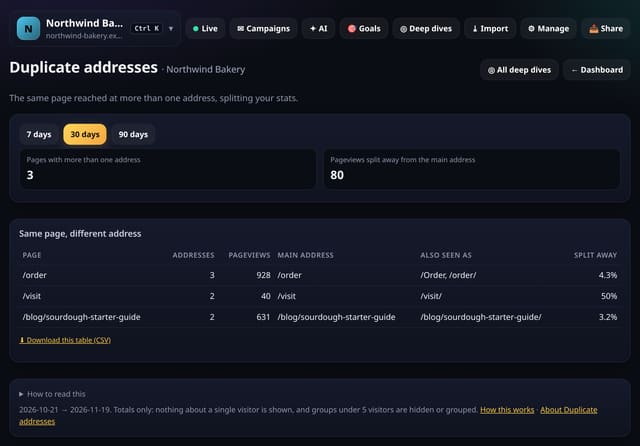
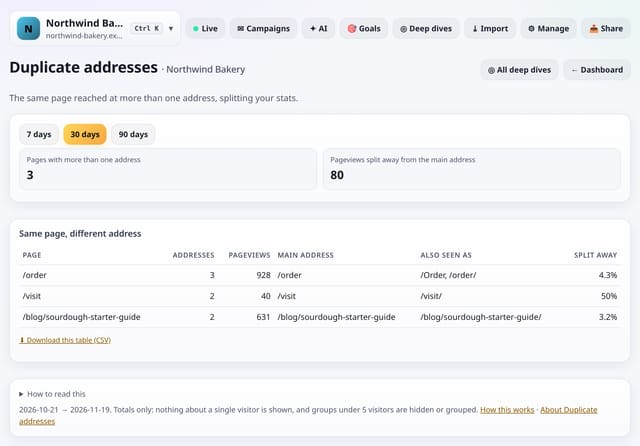
Pages reached at more than one address (a trailing slash, upper case or /index.html), which splits your stats.
Why use it: Duplicate addresses split your page stats and can split search ranking too.
About Duplicate addressesHow to use it: Duplicate addressesQS-339
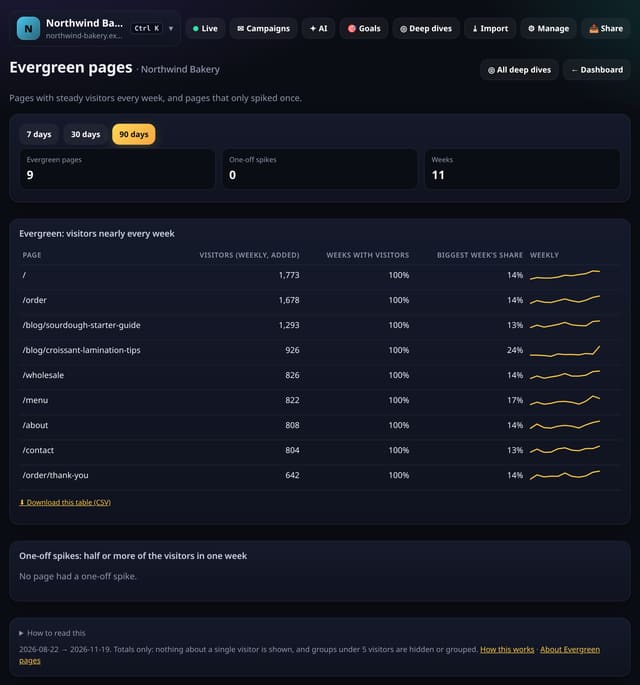
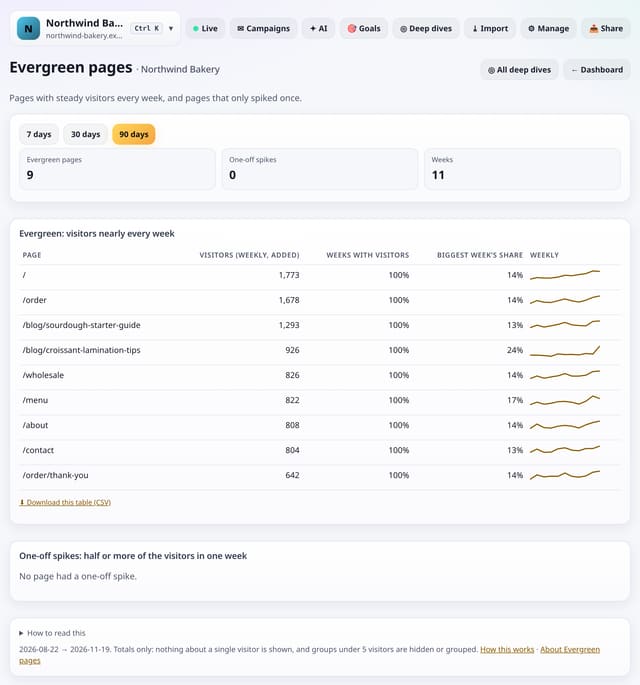
Pages that get visitors nearly every week, and pages that only spiked once.
Why use it: Evergreen pages keep paying back, so they are worth updating.
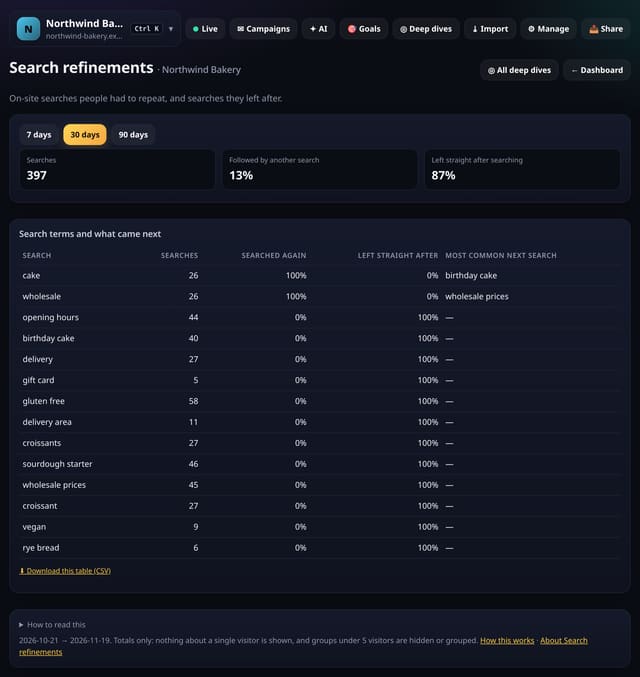
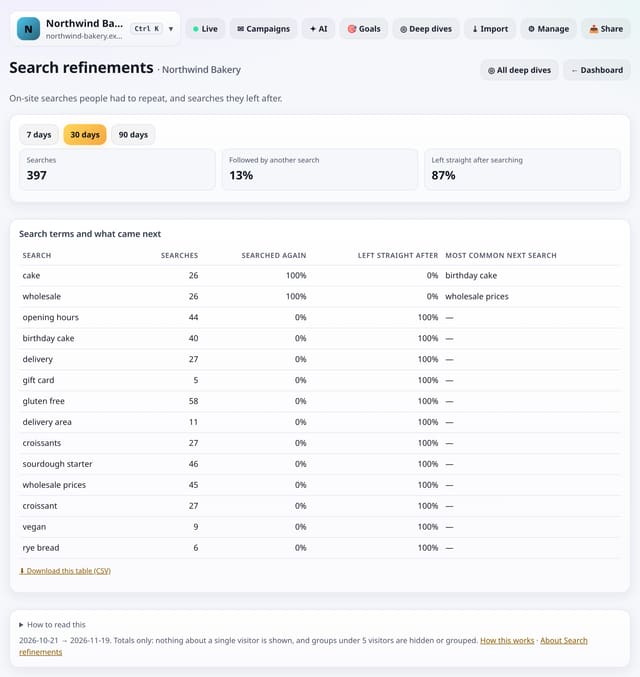
On-site search terms people searched again straight after, and searches people left after.
Why use it: A term that is often searched again means the first results did not help.
About Search refinementsHow to use it: Search refinementsQS-341
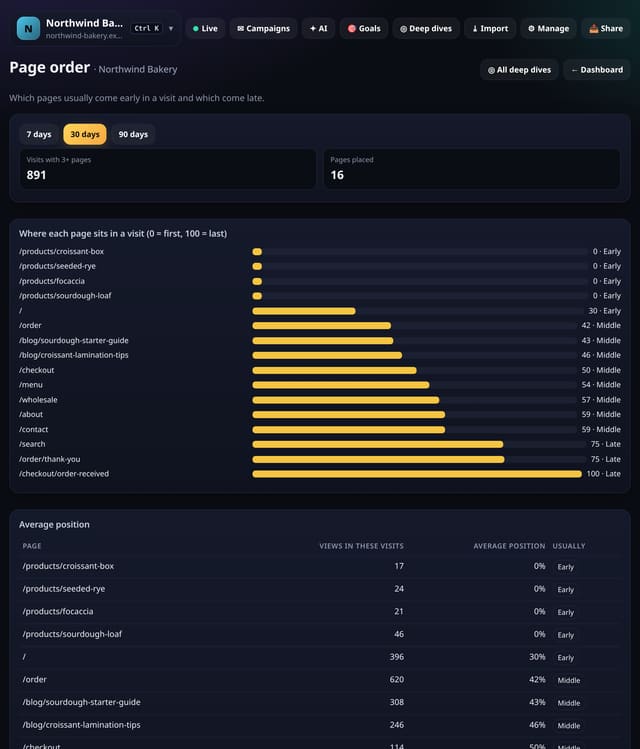
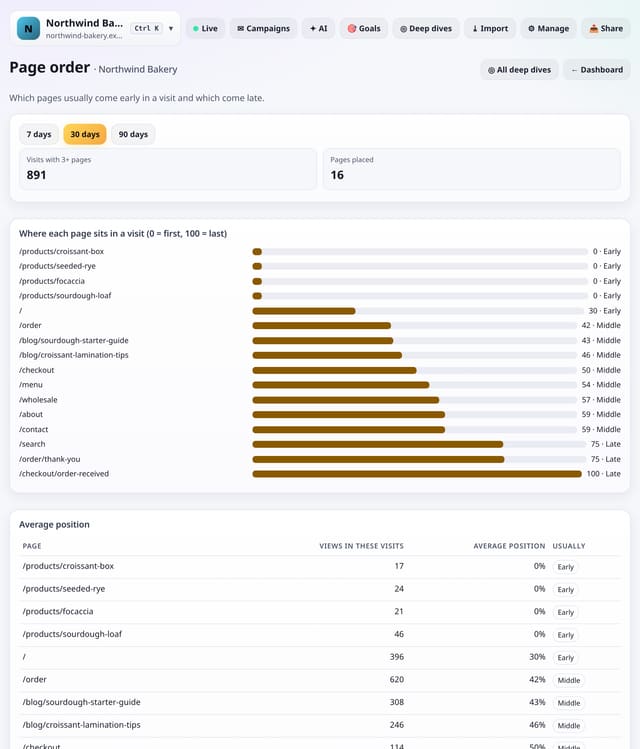
Where each page usually sits in a visit, from first (0) to last (100).
Why use it: Late pages are where visits end.
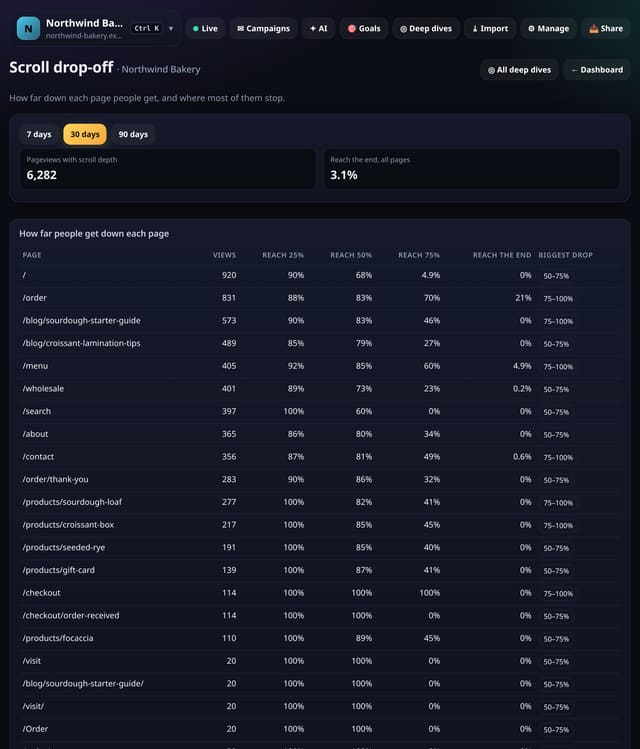
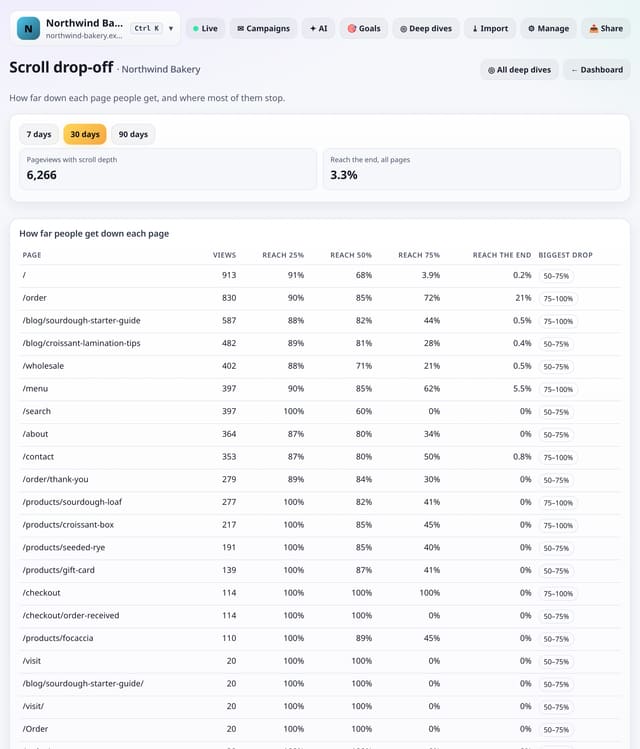
For each page, the share of views that reach 25%, 50%, 75% and the end, and where most readers stop.
Why use it: Put what matters above the biggest drop.
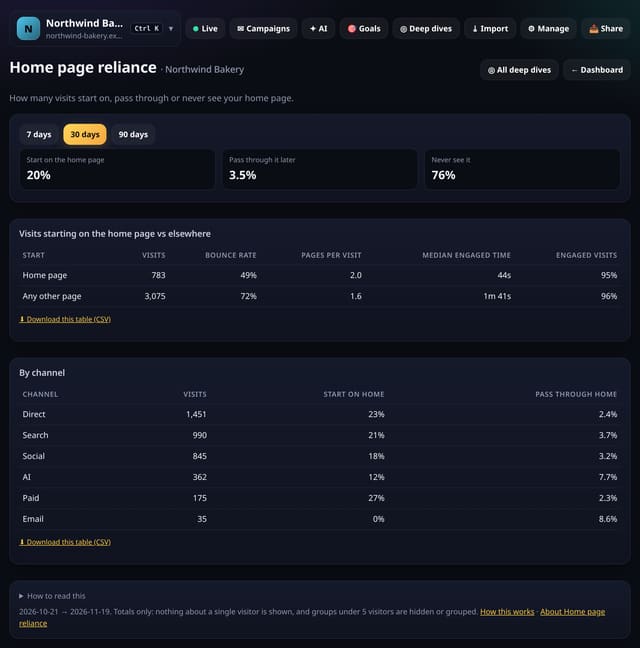
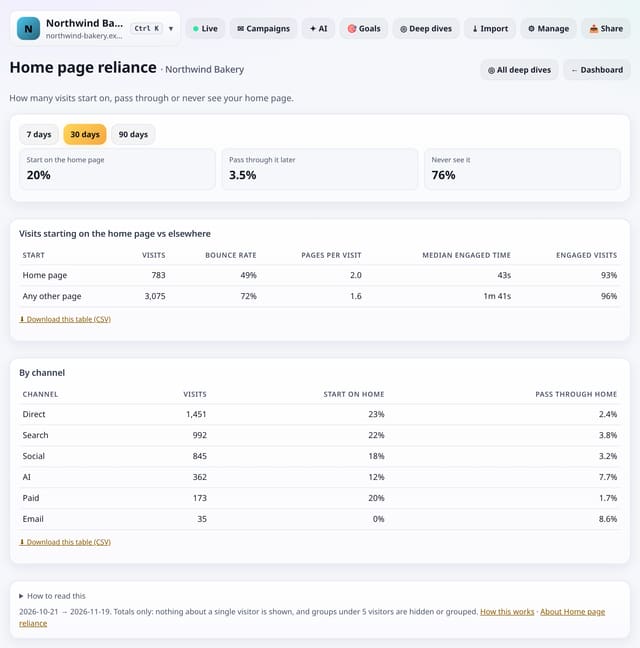
How many visits start on your home page, pass through it later, or never see it, by channel.
Why use it: If most visits never see the home page, your inner pages are your real front doors and need to explain who you are.
About Home page relianceHow to use it: Home page relianceQS-344
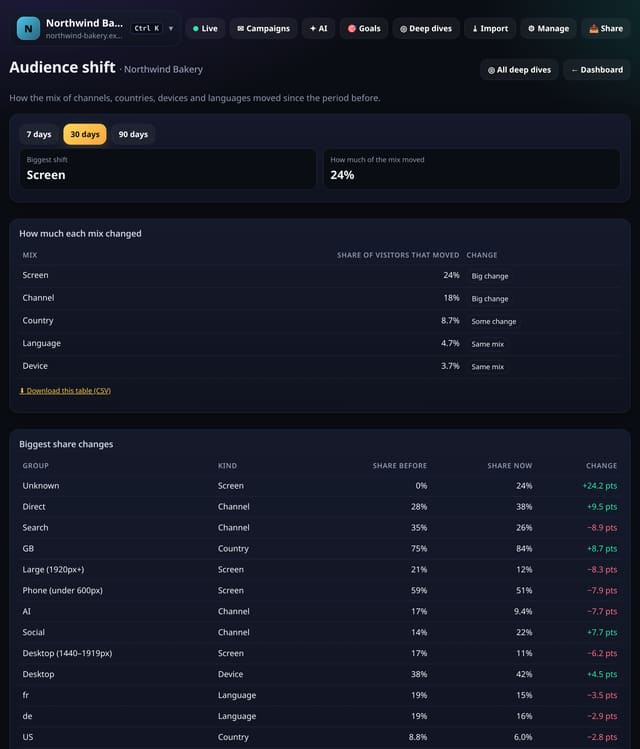
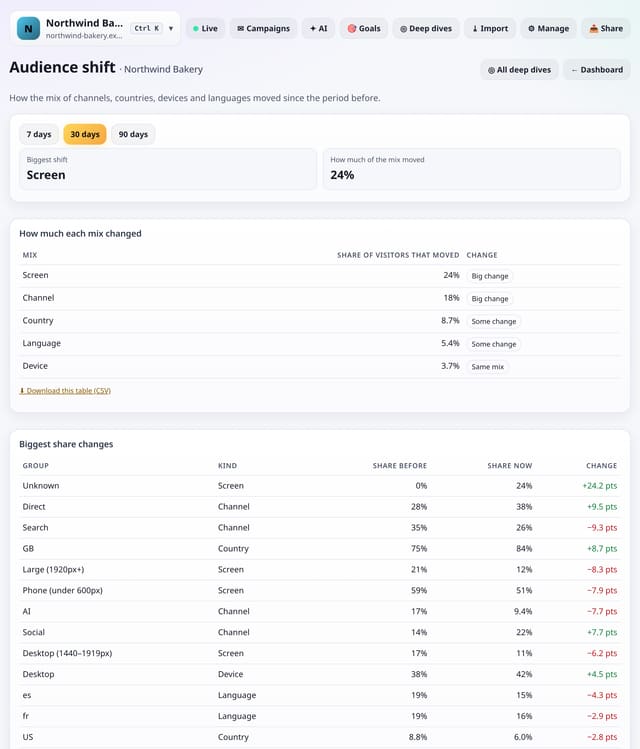
How the mix of channels, countries, devices, languages and screen sizes moved against the period before.
Why use it: When the mix changes, averages such as bounce rate move even if nothing on the site did.
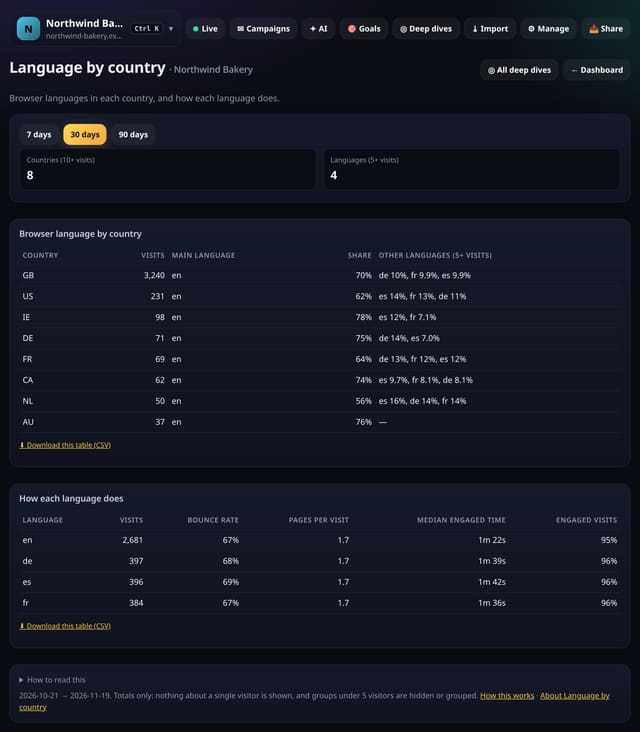
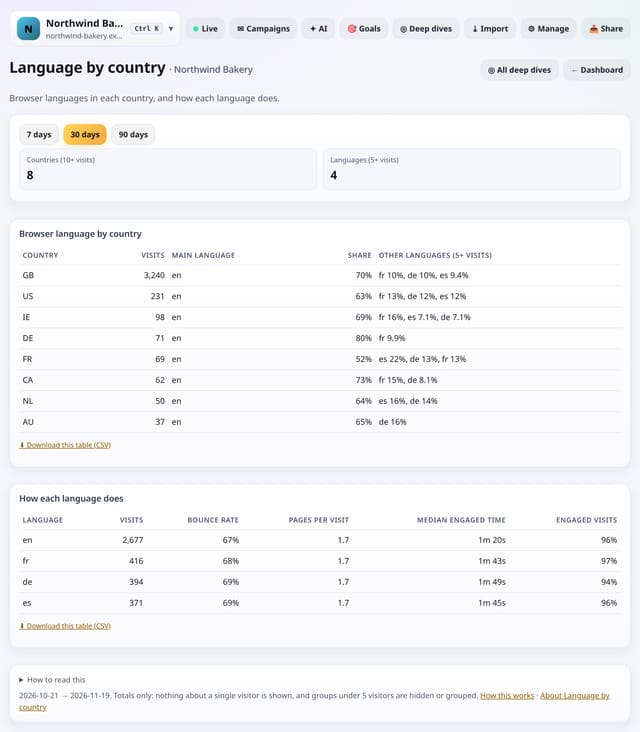
Browser languages in each country, and how visitors in each language do on your site.
Why use it: Many visitors from a country whose language you do not offer may be worth a translated page, or at least plainer English.
About Language by countryHow to use it: Language by countryQS-346
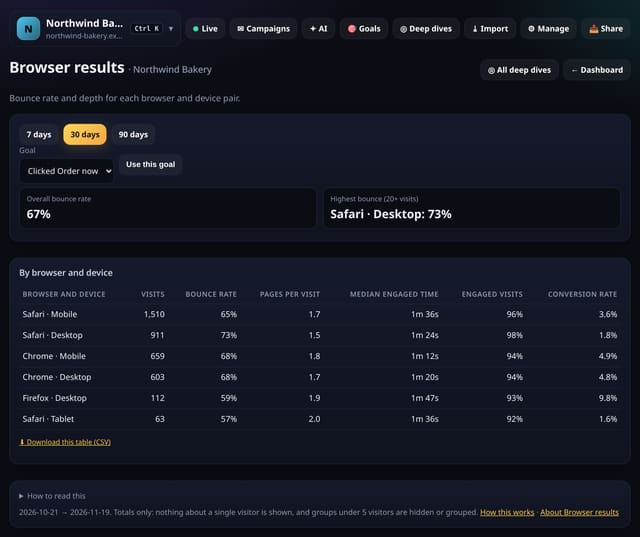
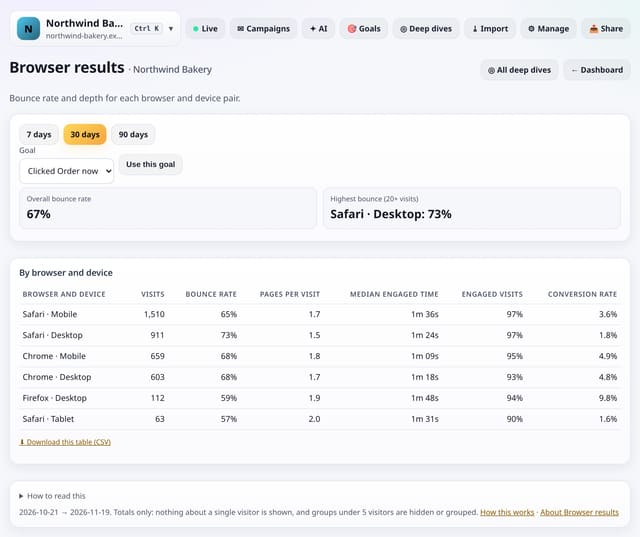
Bounce rate, pages per visit and engaged time for each browser and device pair, so you can spot one that struggles.
Why use it: A browser that bounces far more than the rest often has a layout or script problem.
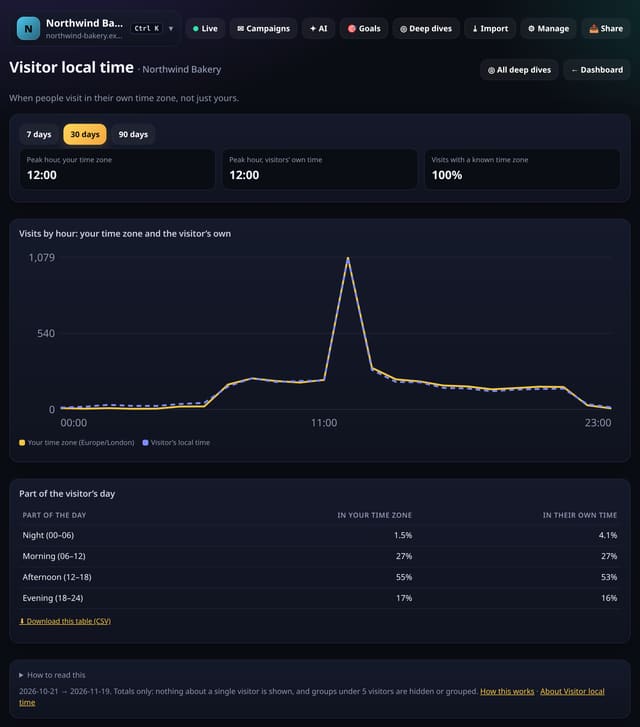
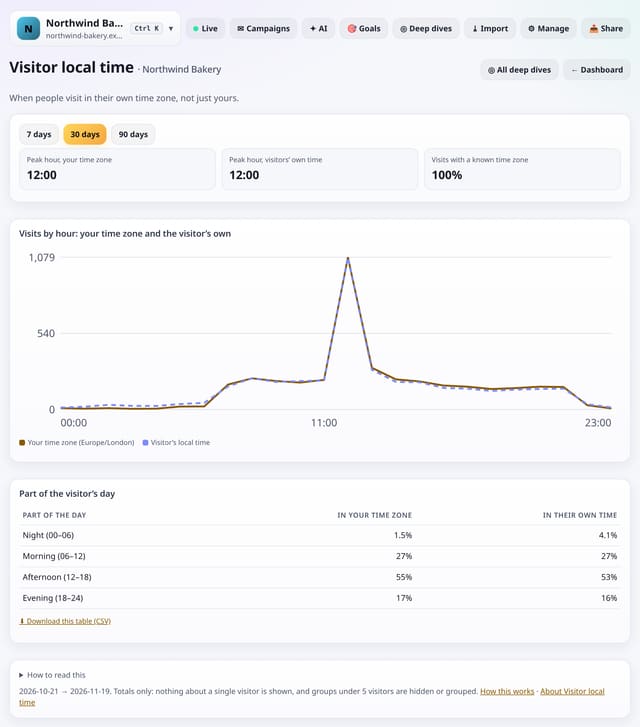
When people visit in their own time zone, not just yours, as two lines on one chart.
Why use it: If you have readers abroad, your 9am may be their bedtime.
About Visitor local timeHow to use it: Visitor local timeQS-348
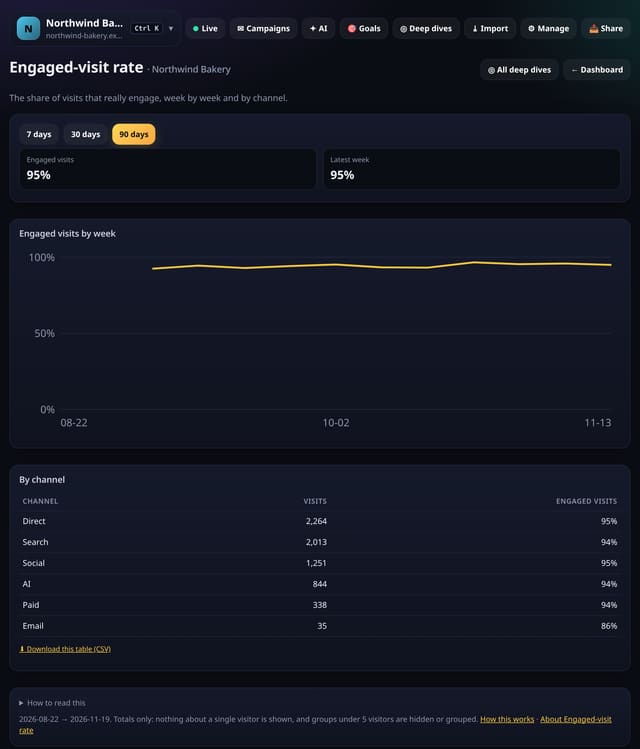
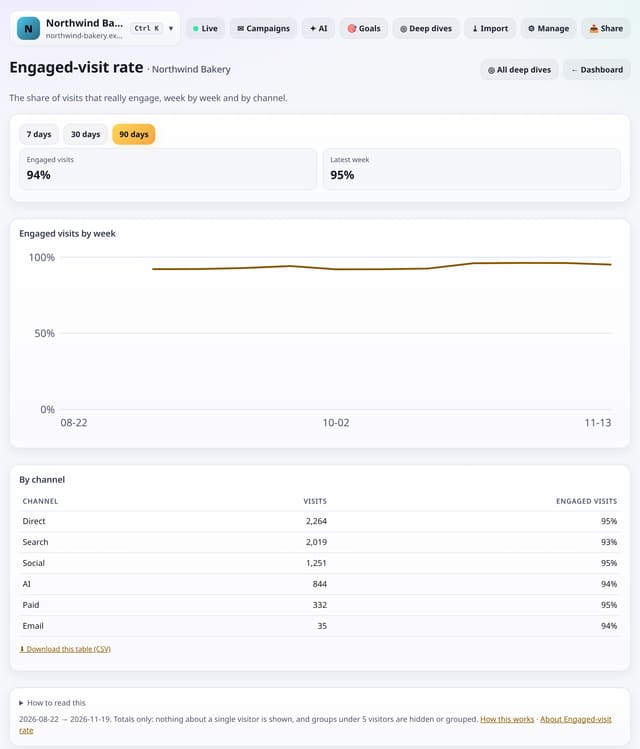
The share of visits that really engage, week by week and by channel.
Why use it: Bounce rate only counts pages.
About Engaged-visit rateHow to use it: Engaged-visit rateQS-349
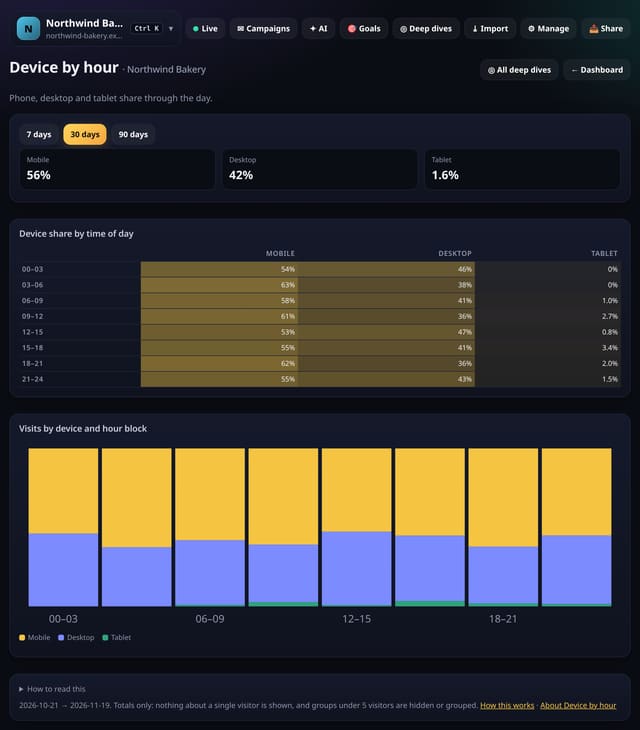
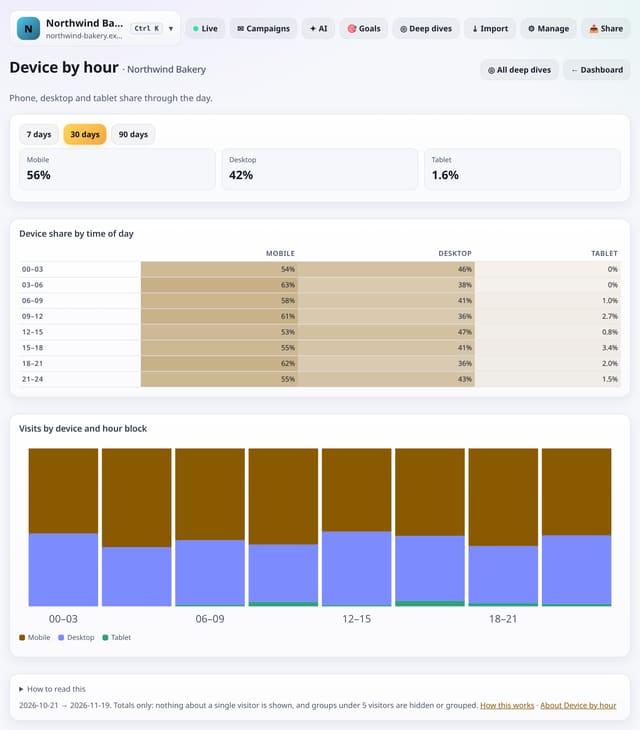
Phone, desktop and tablet share through the day in 3-hour blocks.
Why use it: If evenings are almost all phones, that is when your mobile layout matters most, and when to send mobile-friendly emails.
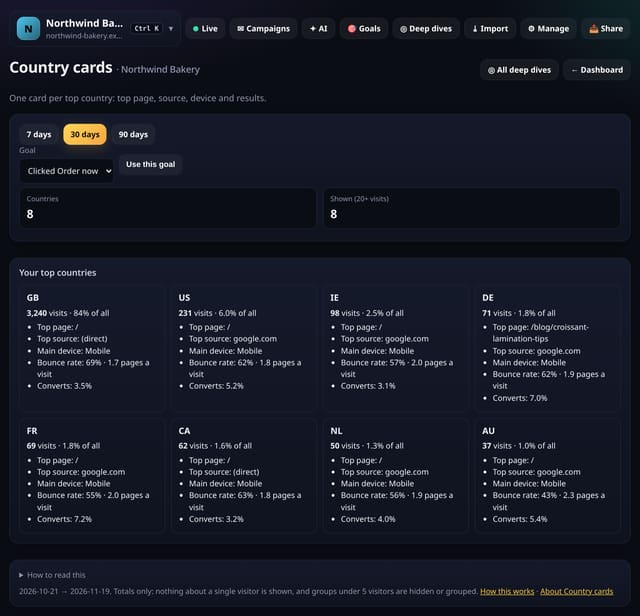
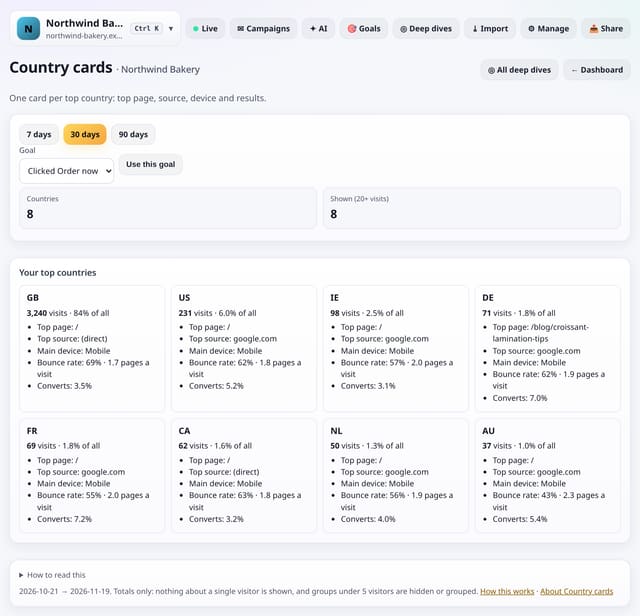
One card for each of your top countries: visits, top page, top source, main device, bounce rate and conversions.
Why use it: Cards are quick to read and easy to screenshot for a client: a one-glance profile of each market.
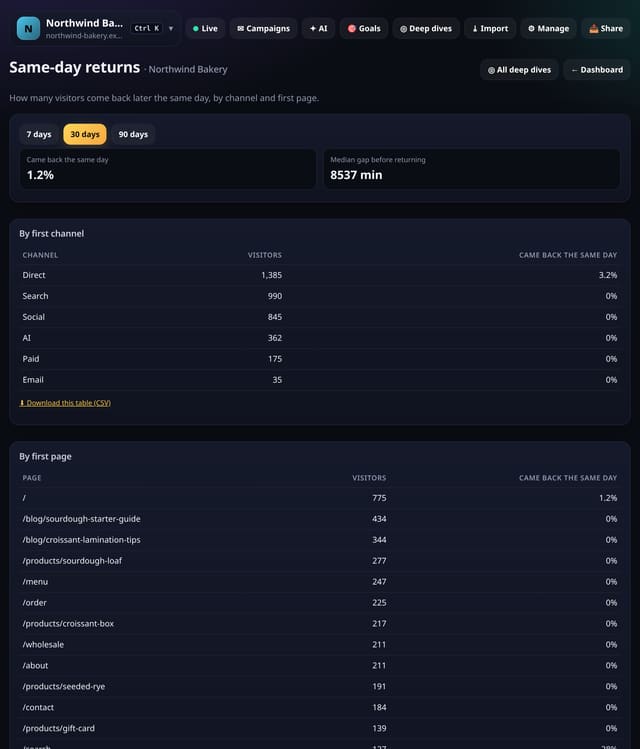
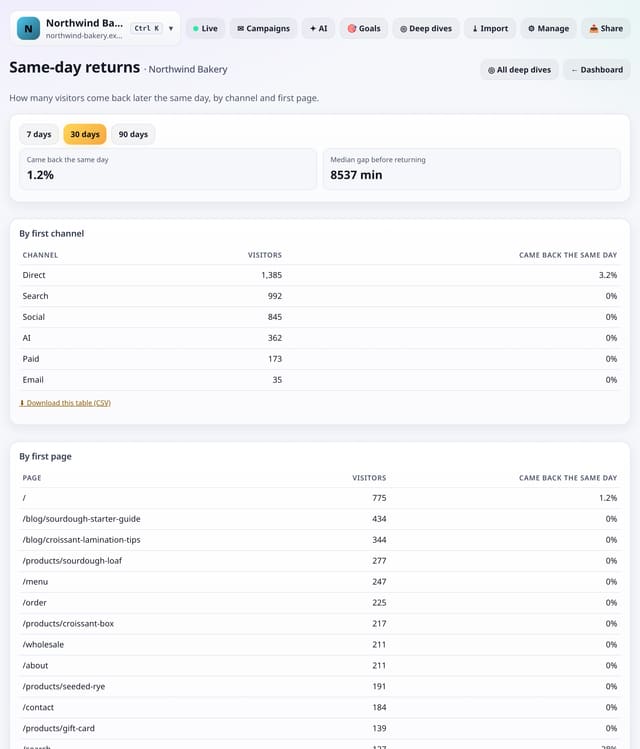
How many visitors come back later the same day, by first channel and first page, and how long they wait.
Why use it: Same-day returns show pages and channels that leave people wanting more, or people comparing you with others.
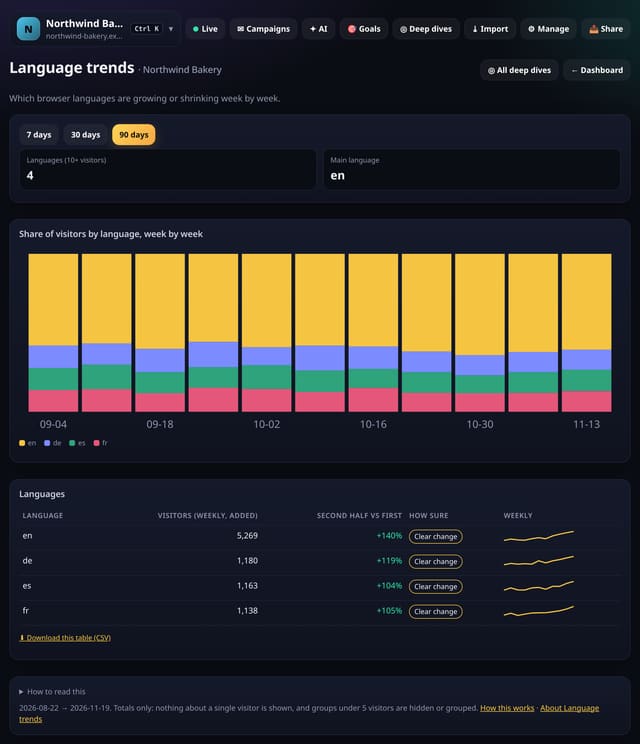
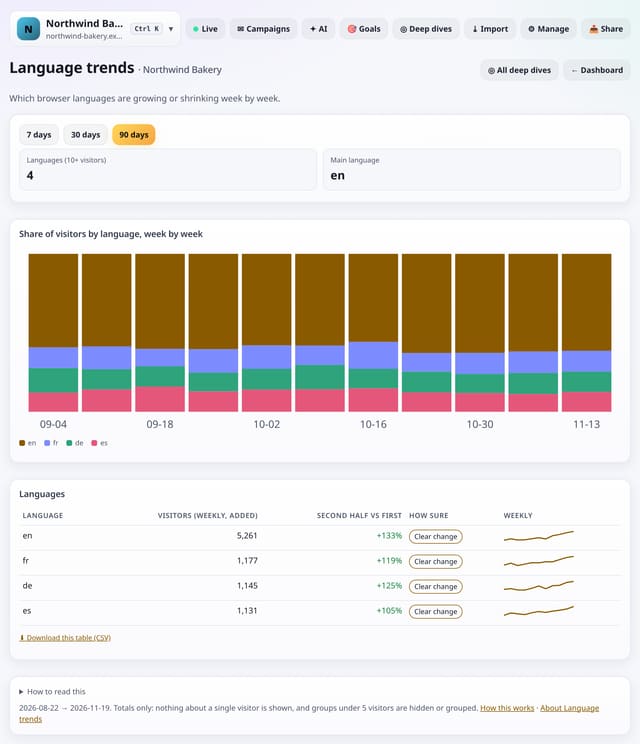
Which browser languages are growing or shrinking, week by week.
Why use it: A growing language is an early sign of a new market.
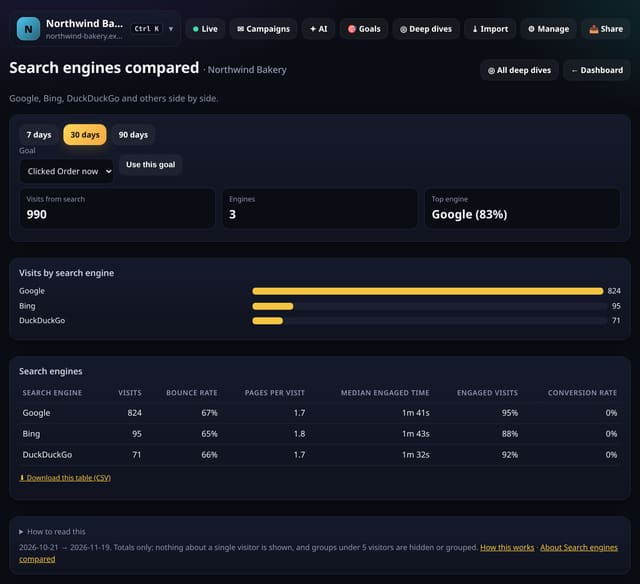
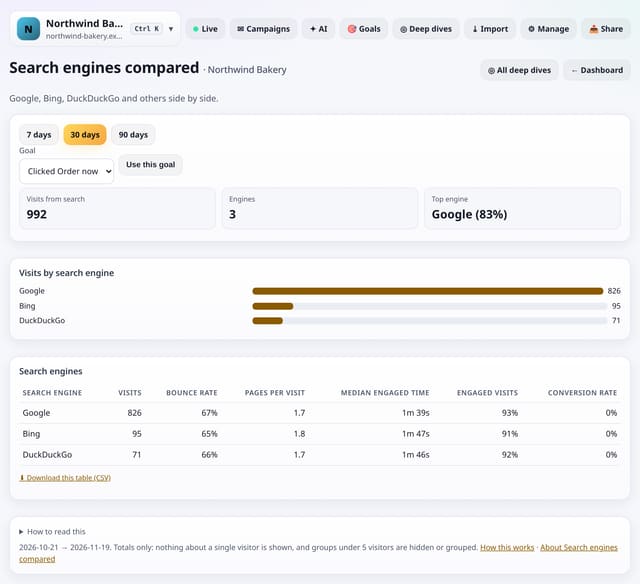
Visits from each search engine side by side, with bounce rate, depth, engaged time and conversions.
Why use it: Visitors from different engines often behave differently.
About Search engines comparedHow to use it: Search engines comparedQS-354
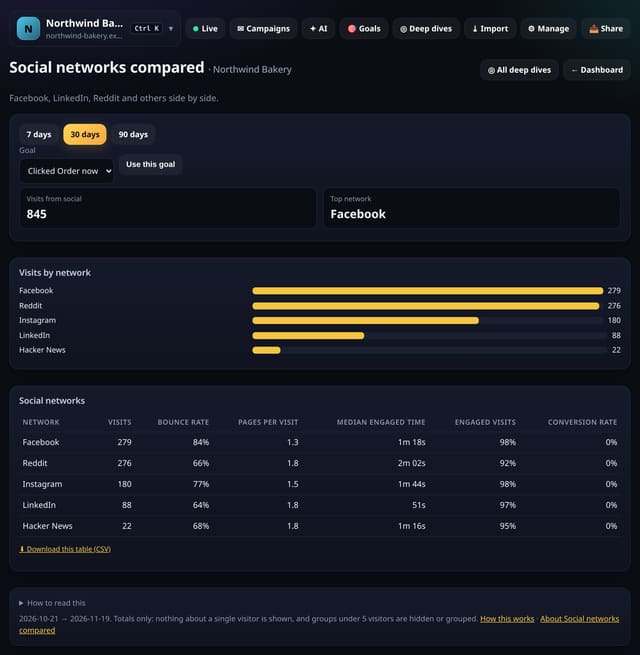
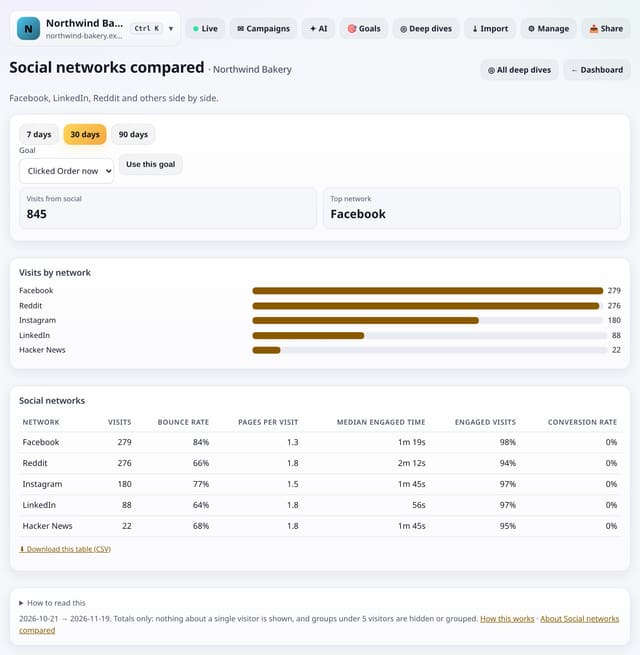
Visits from each social network side by side, with bounce rate, depth, engaged time and conversions.
Why use it: A network that sends many visitors who leave at once may be worth less than a smaller one that sends readers.
About Social networks comparedHow to use it: Social networks comparedQS-355
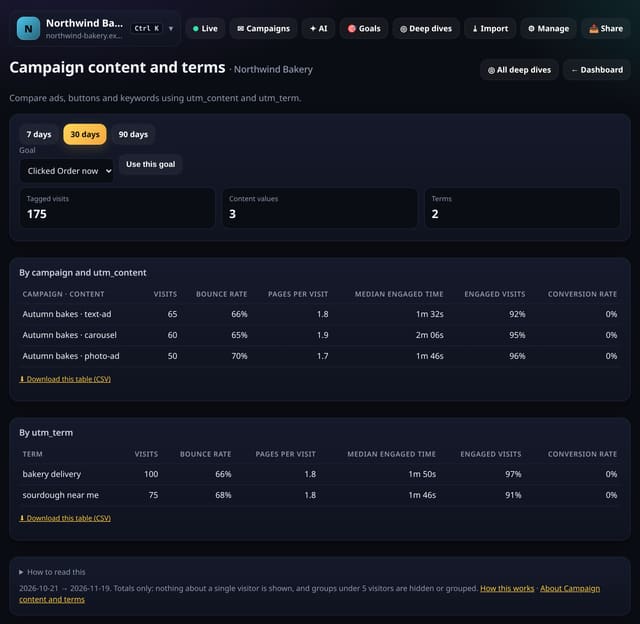
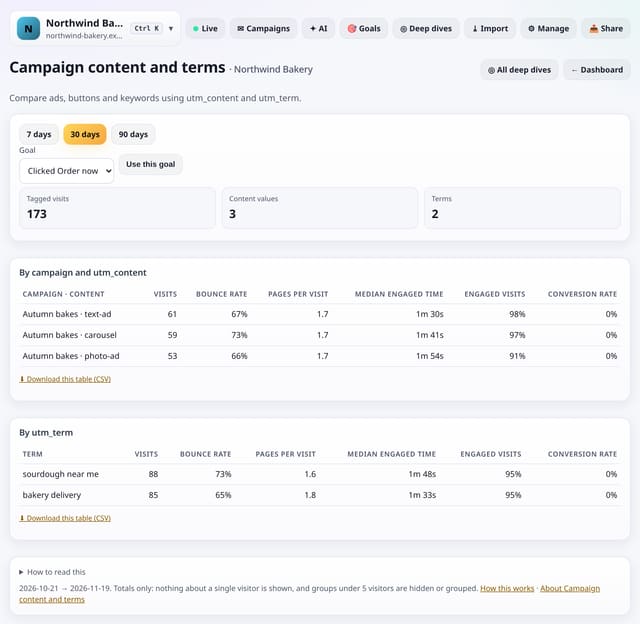
Compare ad versions, buttons and keywords using the utm_content and utm_term tags on your links.
Why use it: The campaign screen tells you which campaign worked.
About Campaign content and termsHow to use it: Campaign content and termsQS-356
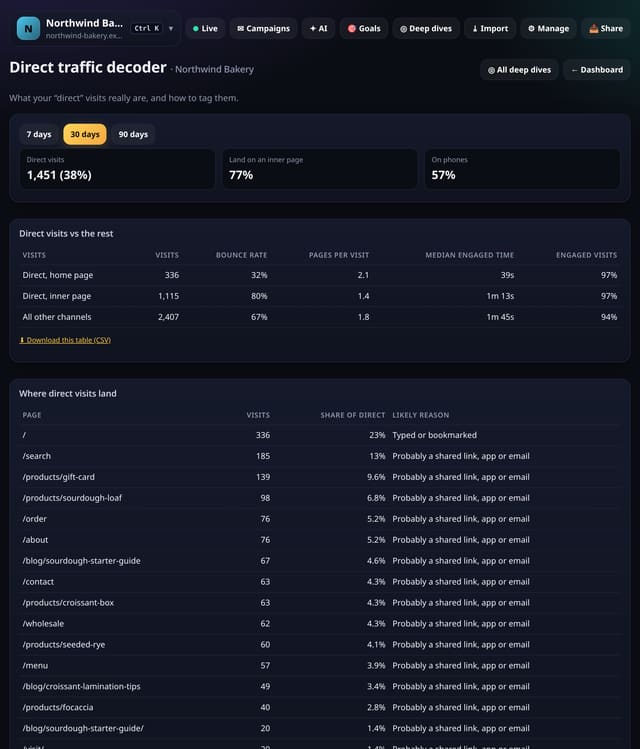
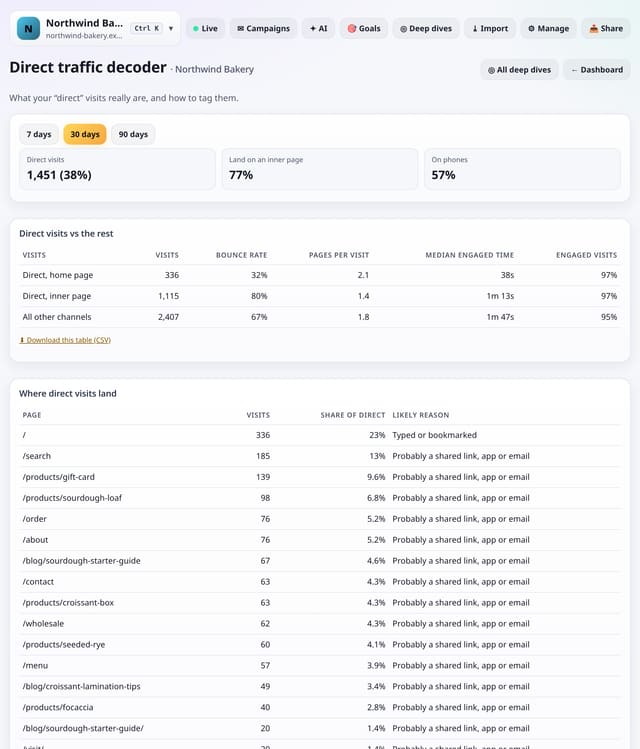
What your direct visits look like: where they land, what device they use and how they compare with other channels.
Why use it: Long inner addresses are rarely typed.
About Direct traffic decoderHow to use it: Direct traffic decoderQS-357
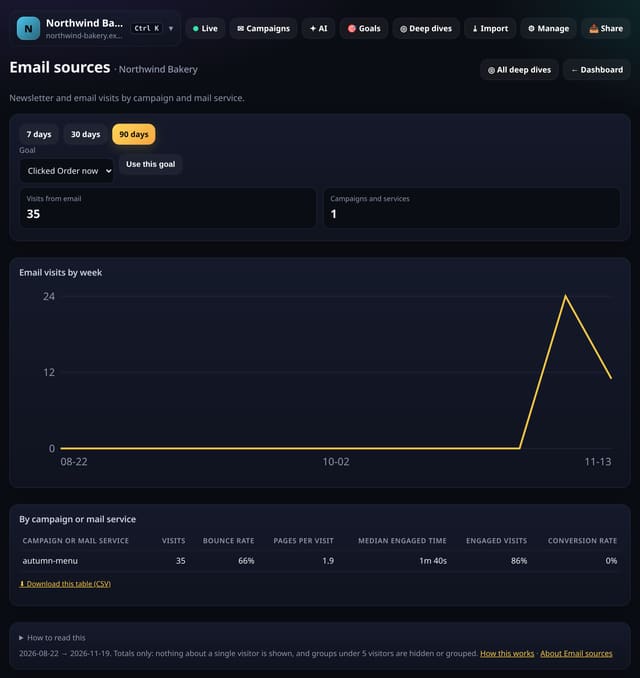
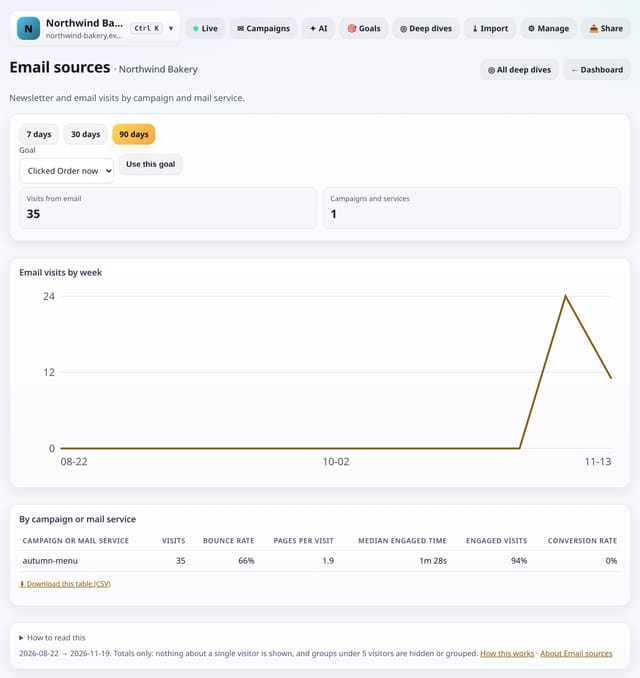
Visits from email by campaign and by webmail service, week by week.
Why use it: It shows which newsletter issues drive real reading, and how much email traffic you are missing by not tagging links.
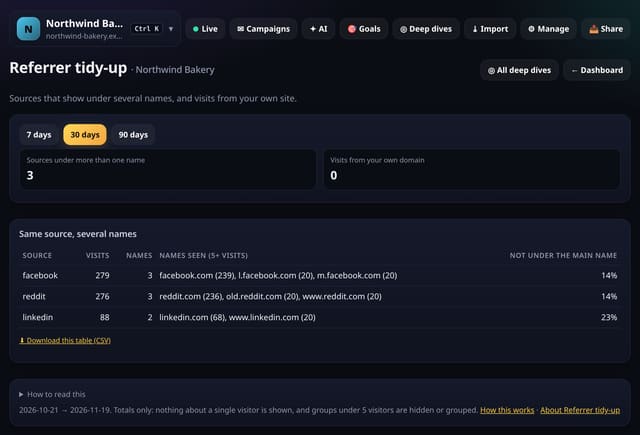
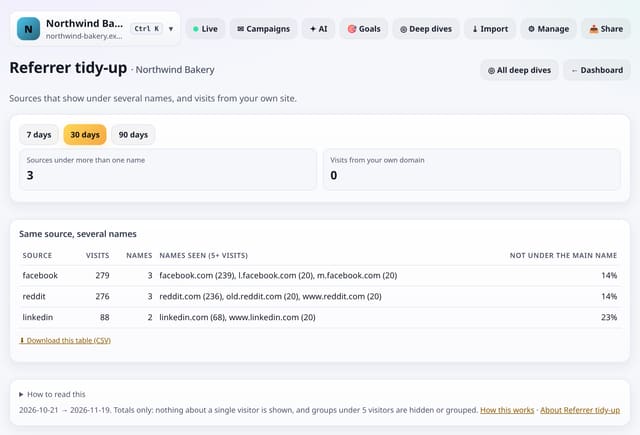
Sources that show under several names (www., m., l. and other prefixes) and visits that seem to come from your own site.
Why use it: Split names make a source look smaller than it is.
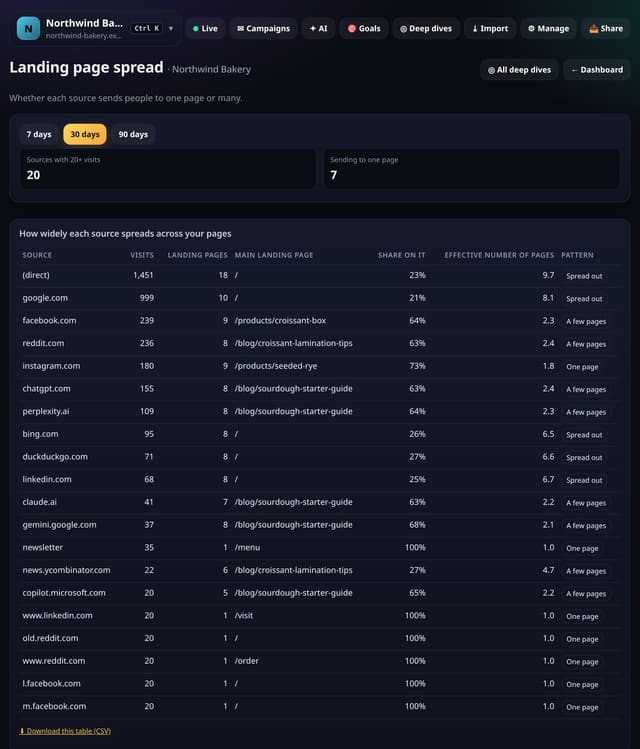
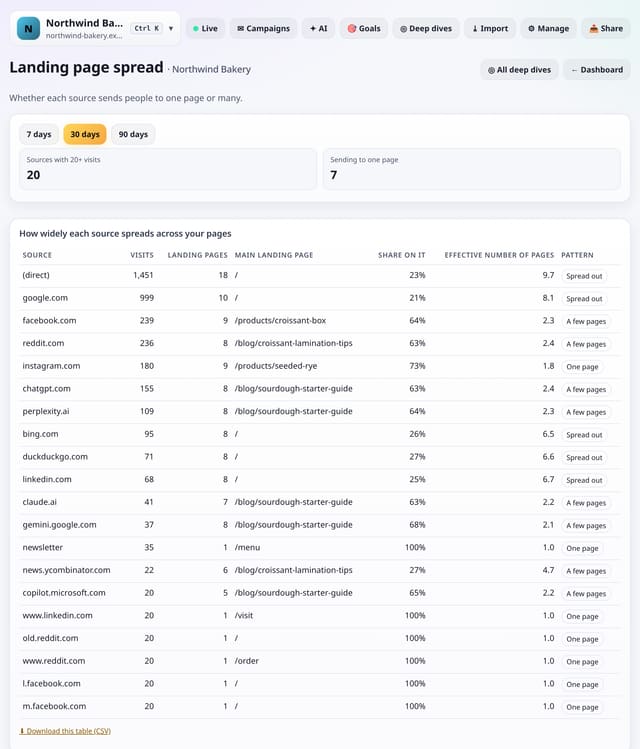
Whether each source sends people to one page or spreads them across many.
Why use it: A source tied to one page depends on that page staying good and ranking.
About Landing page spreadHow to use it: Landing page spreadQS-360
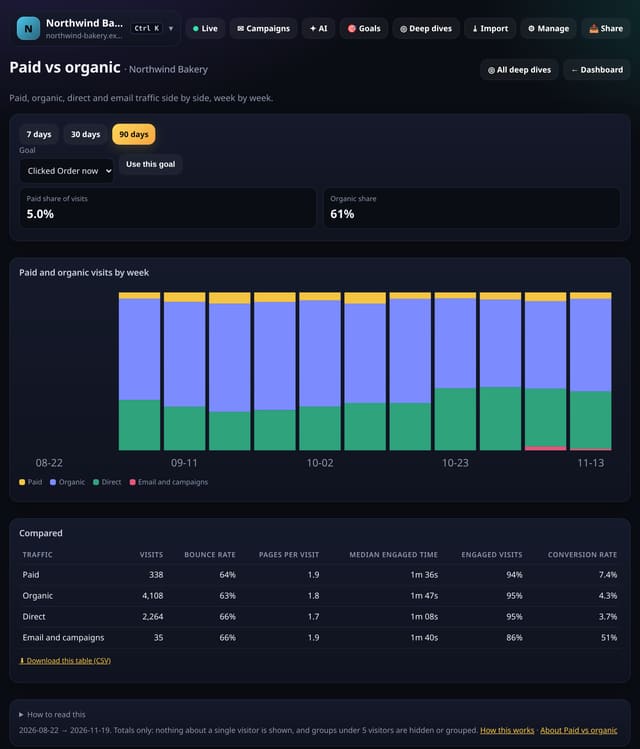
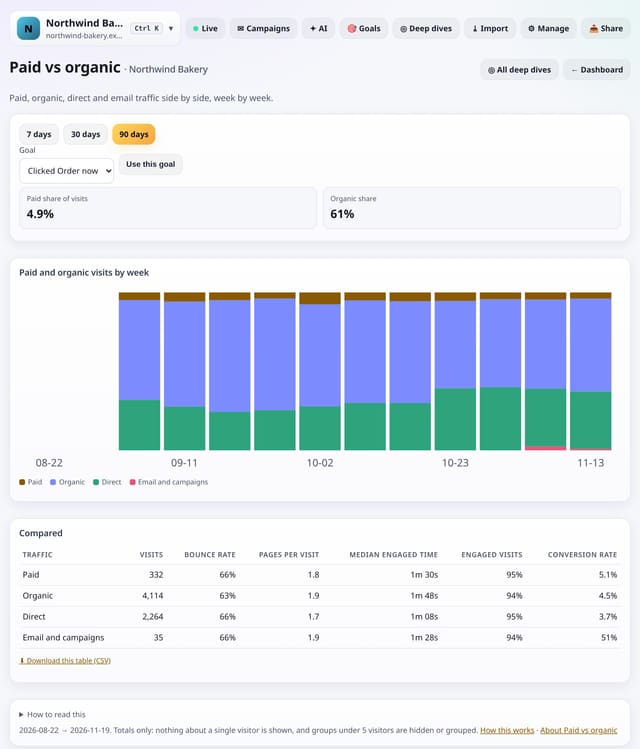
Paid, organic, direct and email traffic side by side, week by week, with results for each.
Why use it: It answers the client question “how much of our traffic do we pay for, and is it better?” in one table.
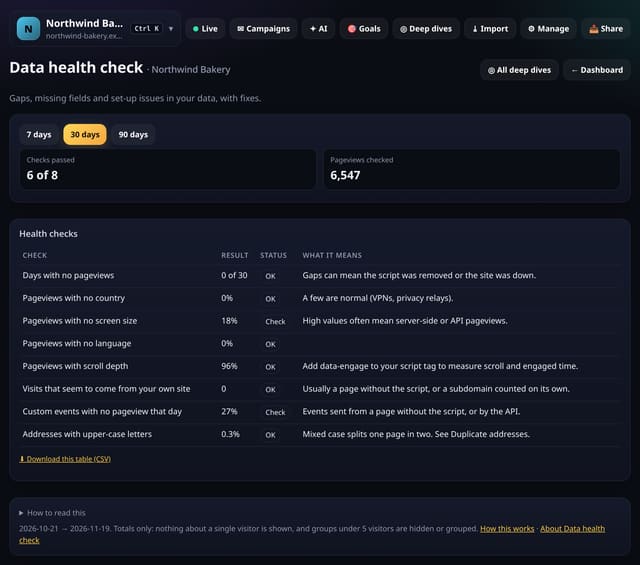
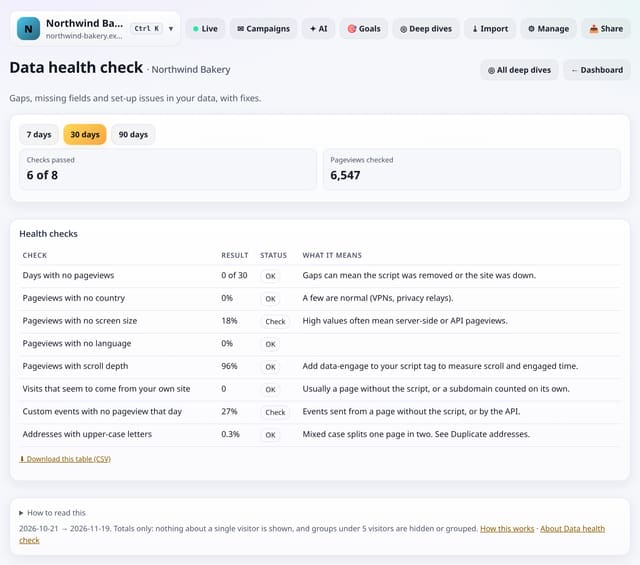
Gaps, missing fields and set-up issues in your data, each with a plain OK or Check and what it means.
Why use it: Good analysis needs good data.
About Data health checkHow to use it: Data health checkQS-362
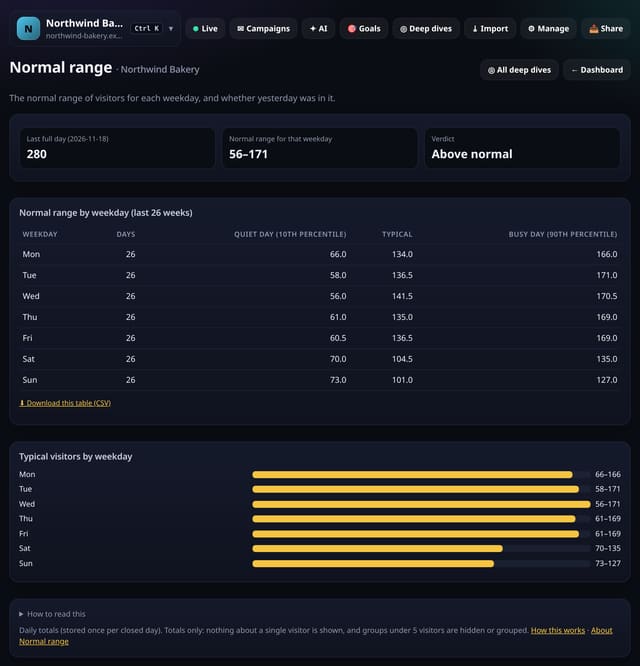
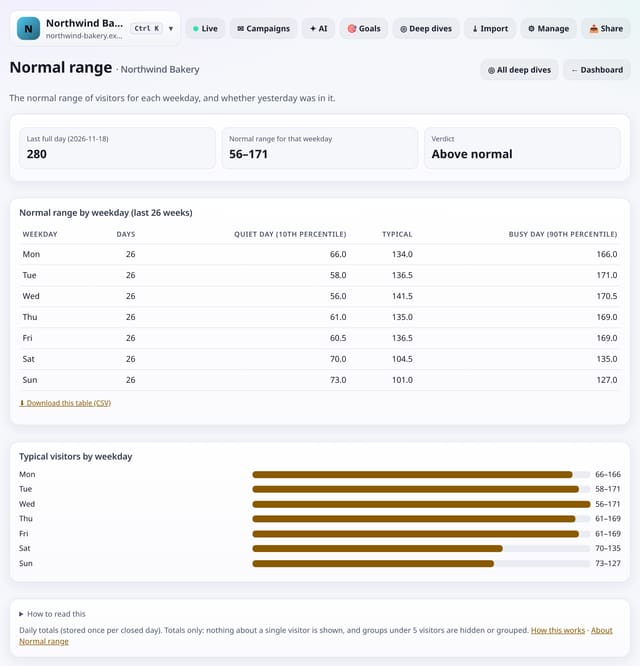
The normal range of visitors for each weekday, and whether your last full day was inside it.
Why use it: Eight days in ten fall inside the normal range.
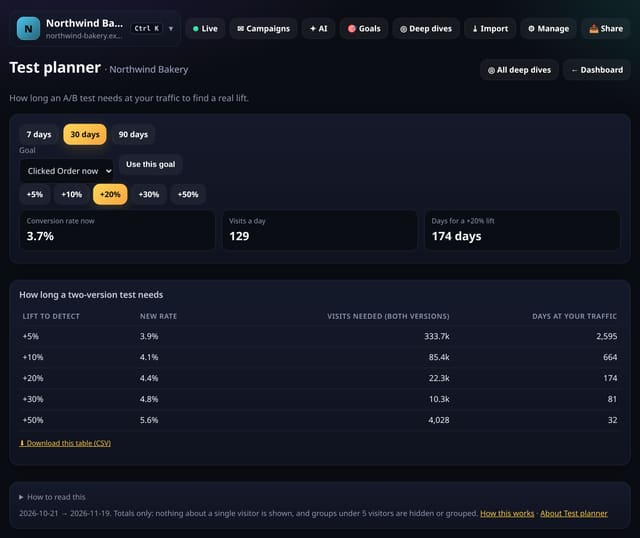
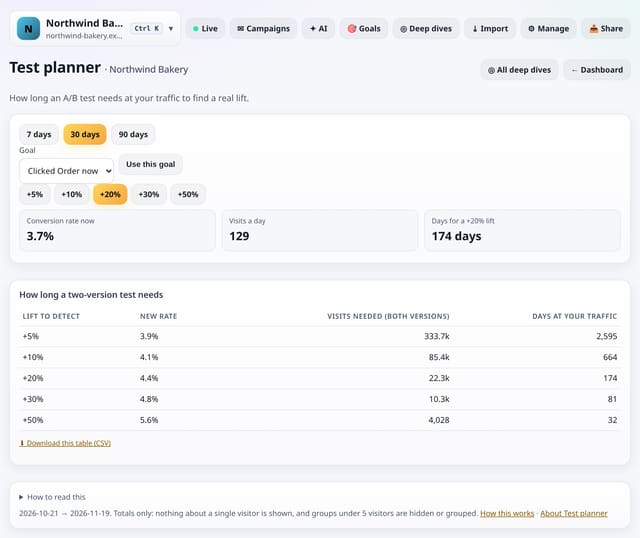
How many visits and days an A/B test needs at your traffic to find a 5%, 10%, 20%, 30% or 50% lift.
Why use it: Most tests on small sites stop too early and crown a winner by chance.
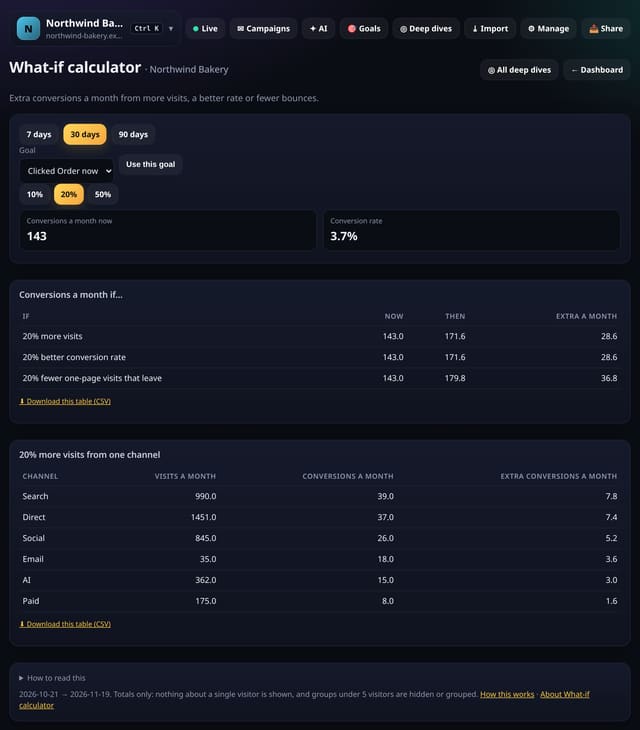
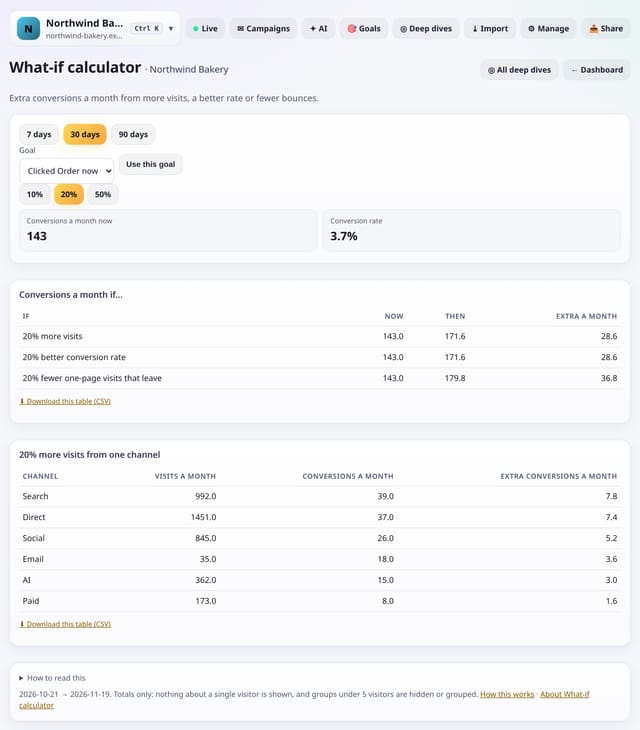
Extra conversions a month from more visits, a better conversion rate or fewer one-page visits, and per channel.
Why use it: It turns vague goals into numbers, so you can choose between chasing traffic and improving pages.
About What-if calculatorHow to use it: What-if calculatorQS-365
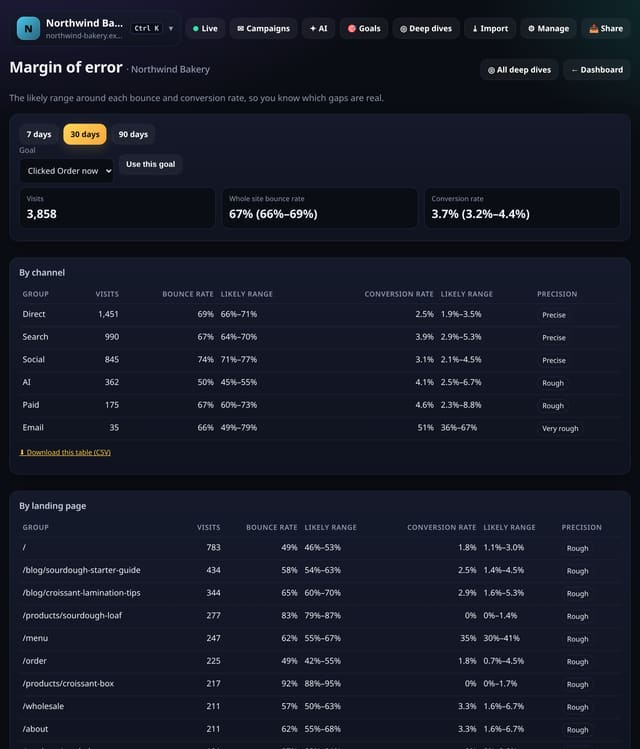
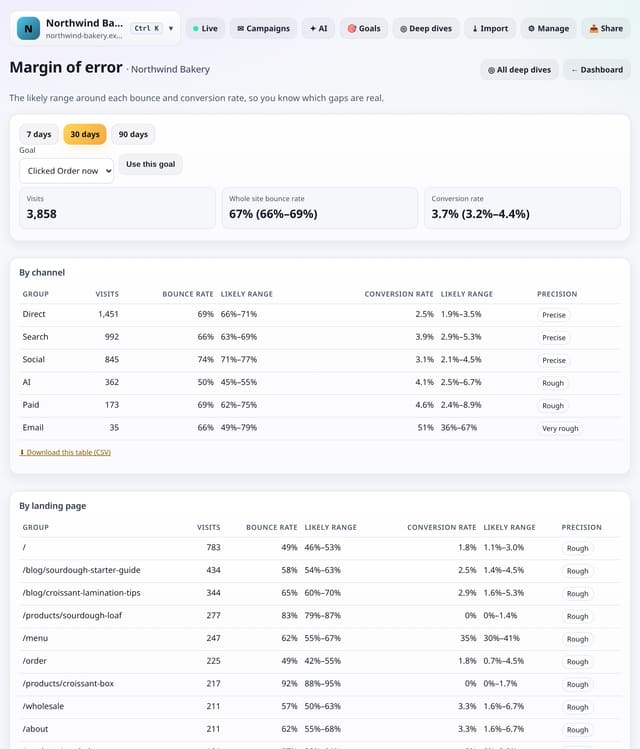
The likely range around each bounce rate and conversion rate, by channel, landing page and device.
Why use it: A 4% vs 5% conversion rate on 100 visits means nothing.
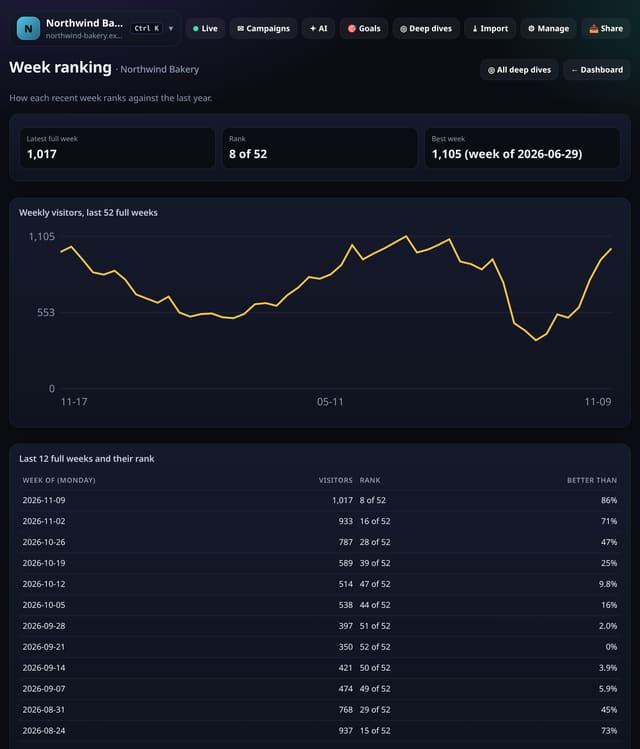
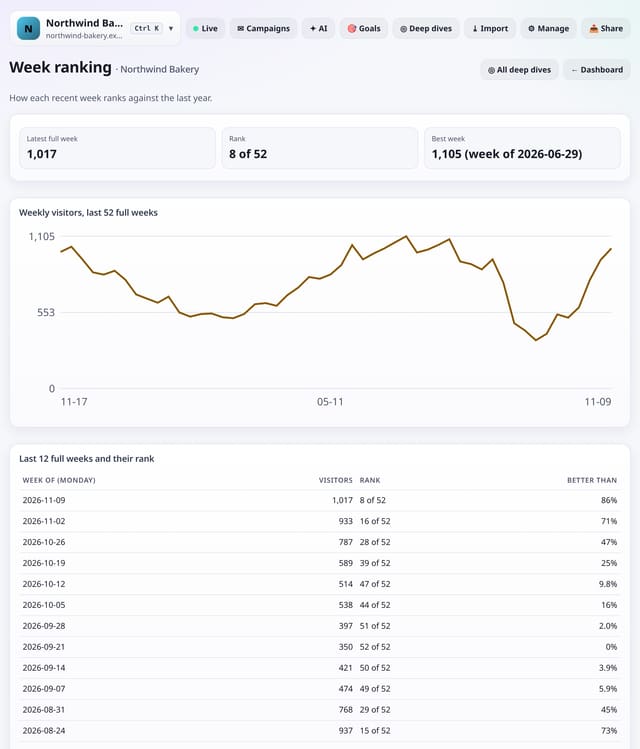
How each recent week ranks against the last 52 full weeks.
Why use it: “Our 5th best week this year” is easier for a client to understand than a percentage.
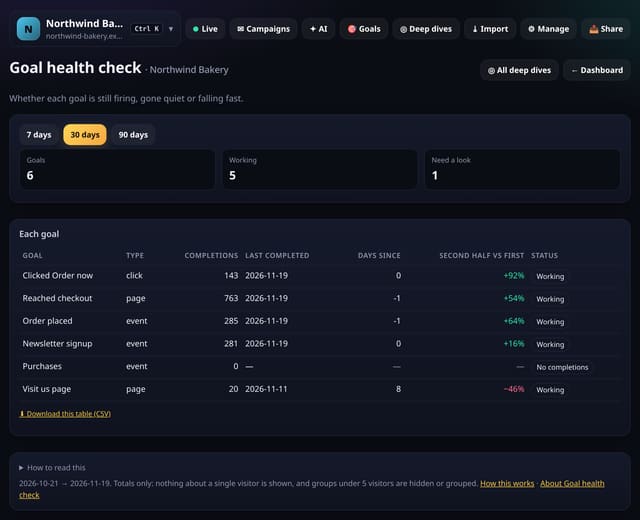
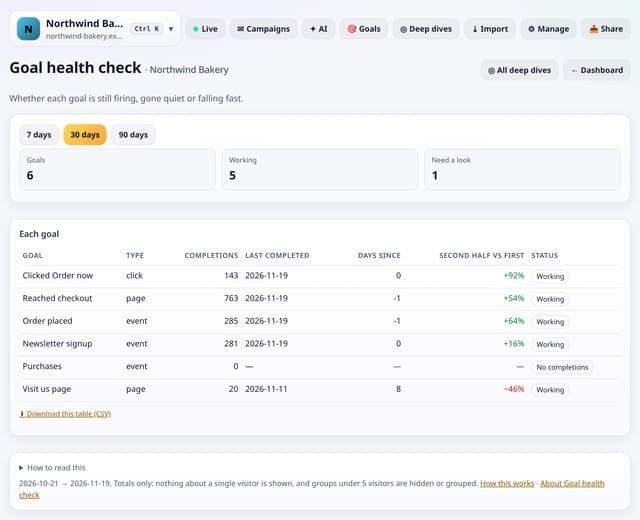
Whether each goal is still working, has gone quiet or is falling fast, with its last completion.
Why use it: Goals break silently when a page is renamed, a button changes or an event is removed.
About Goal health checkHow to use it: Goal health checkQS-369
Everything that has shipped, newest first, is in the changelog. Every page on the site is on the sitemap.