Page watchlist
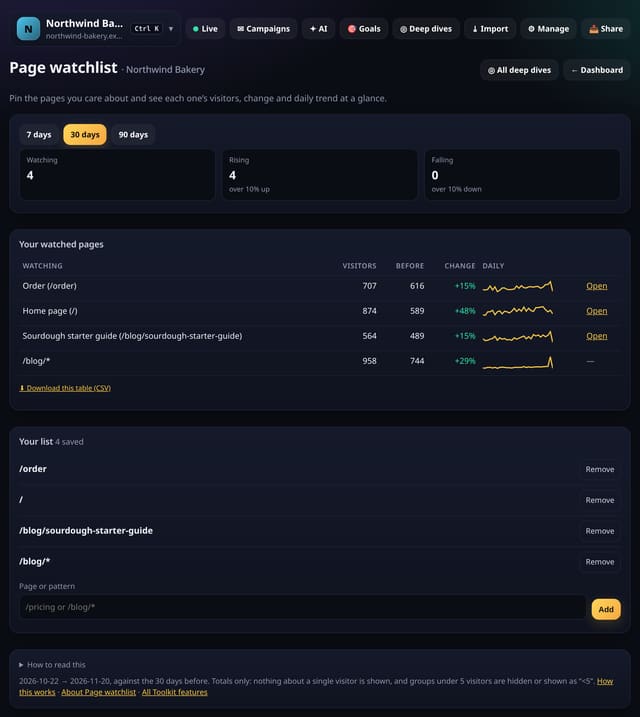
Pin the pages that matter and see each one’s visitors, change and a daily trend line on one screen.
Why use it: Most people check the same handful of pages every week.
100 new features in one place: the Toolkit (the first 50, then 50 more in the afternoon), in the evening 50 new analyses for the Analysis lab, and later 50 more. Watchlists, targets, notes, to-do lists and experiment logs; finders and testers; leaderboards and “what’s new, what’s gone” lists; exports, report packs and read-only snapshot links; and tidy-up tools for names, channels and noise. Each one is explained below in plain English, with a screenshot and links to its feature page and how-to guide. Everything here works without cookies, and only on totals. Yesterday’s additions are on the 19 November page.
Not sure where to begin? These five are the quickest wins.
Pin the pages that matter and see each one’s visitors, change and a daily trend line on one screen.
Why use it: Most people check the same handful of pages every week.
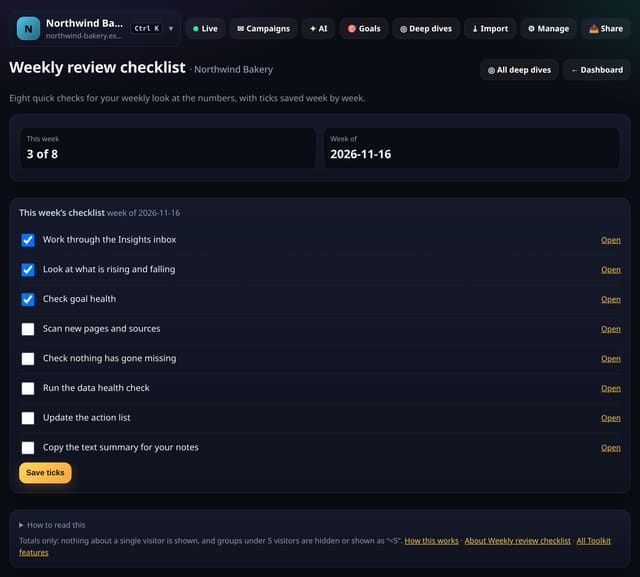
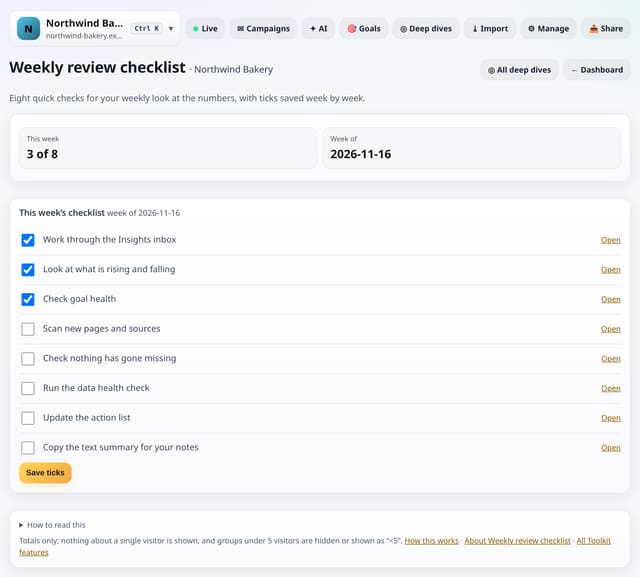
A short checklist for your weekly look at the numbers, with links to each screen and ticks saved week by week.
Why use it: A routine beats inspiration.
About Weekly review checklistHow to use it: Weekly review checklistQS-383
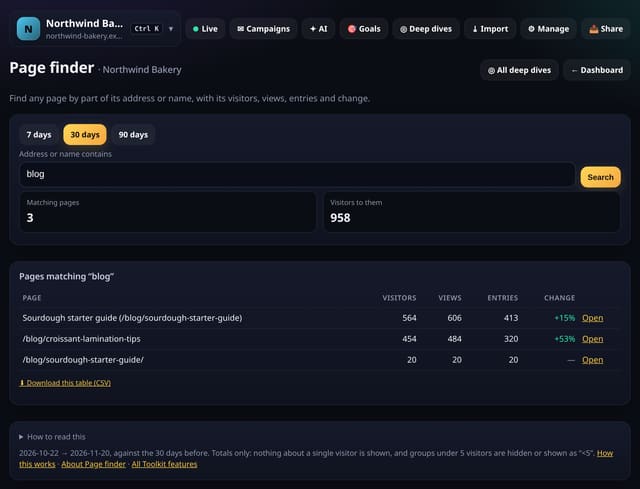
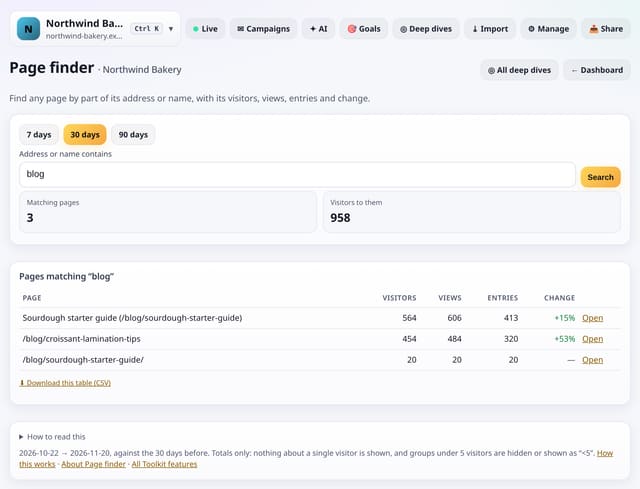
Type part of an address or a friendly name and get every matching page with visitors, views, entries and change.
Why use it: Big sites have thousands of pages.
Freeze any report into a read-only link you can share, then delete it whenever you like.
Why use it: Sometimes you need to show one number to someone without an account, and you want it to stay as it was when you sent it.
Pin the reports you open most so they sit at the top of the Toolkit.
Why use it: With more than 100 screens, the ones you use every week should not be three taps away.
The Toolkit is a new screen for each site (menu → Toolkit, also linked from Deep dives and All reports). Where the dashboard and the Analysis lab show numbers, the Toolkit helps you work with them: keep watchlists, set targets, write notes and to-do lists, log experiments, find any page or source fast, export and share a report, tidy names and hide noise, and set up the app the way you like it.
Why use it: the questions you ask every week (“how is that page doing?”, “what changed?”, “what did we decide?”) get one place to live, next to the numbers.
Privacy stays the same: no cookies and no new tracking. The Toolkit only reads the totals you already collect, counts under 5 are hidden, and the tracking script is unchanged. Saved lists and notes belong to the site and are only seen by people who can already see its stats. Nothing in the Toolkit sends email or messages.
Open the ToolkitAll featuresQS-372 to QS-472
Pin the pages that matter and see each one’s visitors, change and a daily trend line on one screen.
Why use it: Most people check the same handful of pages every week.
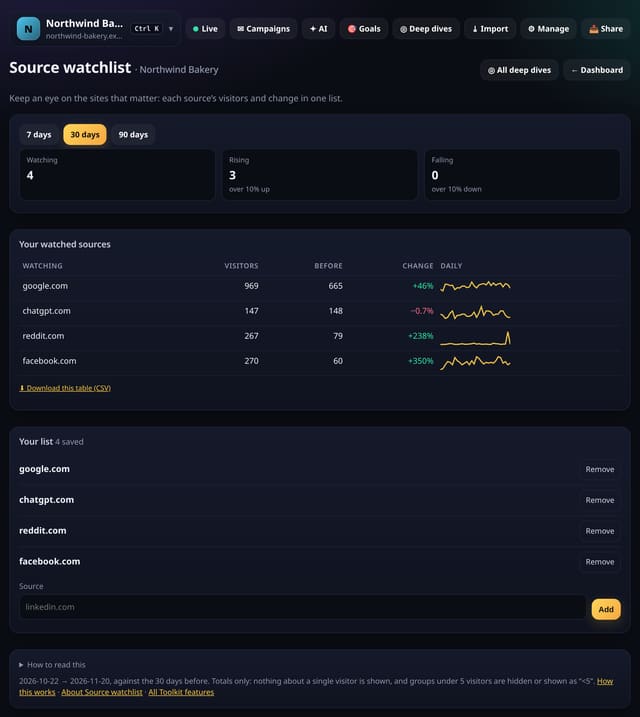
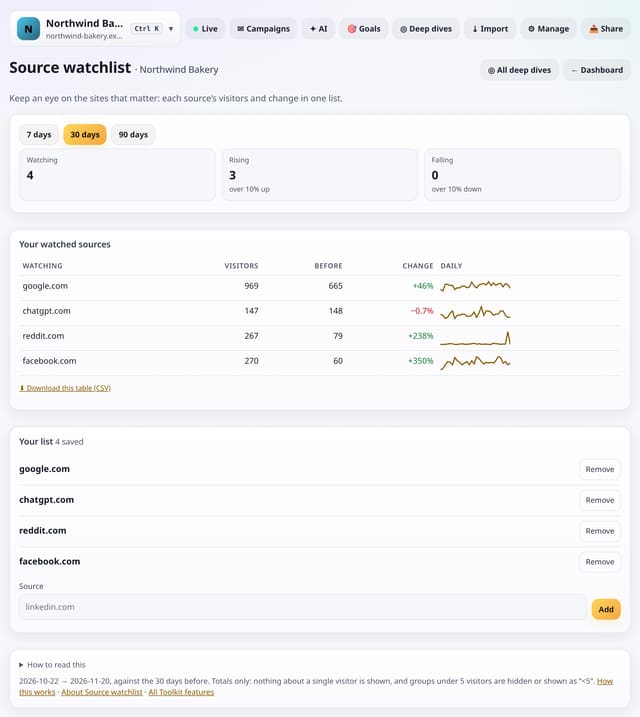
Follow the referrers and utm_sources that matter to you, with visitors and change for each in one list.
Why use it: A partner link or a press mention can quietly stop sending visitors.
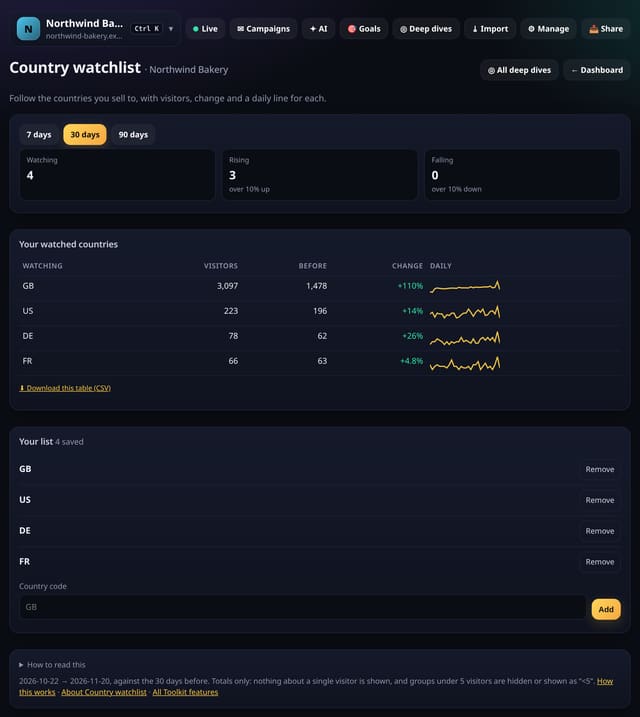
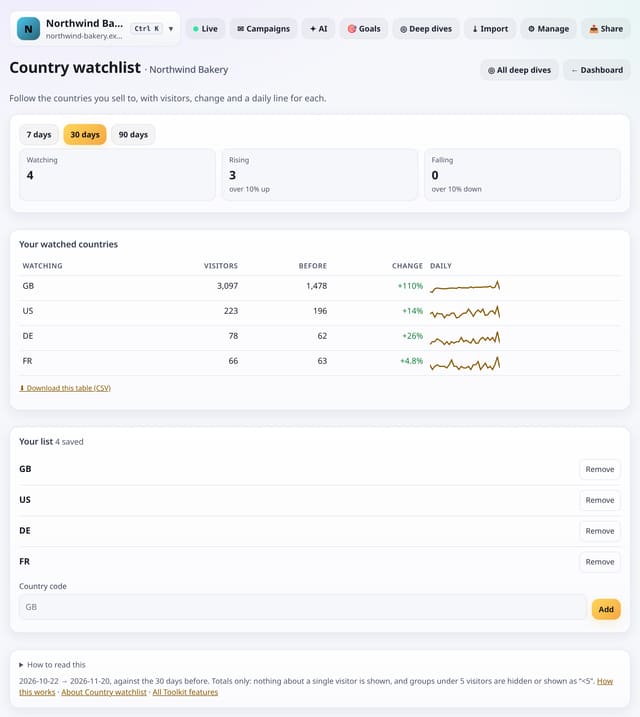
Follow the countries that matter to your business, with visitors, change and a daily line for each.
Why use it: If you sell in a few countries, the overall total hides how each market is doing.
About Country watchlistHow to use it: Country watchlistQS-374
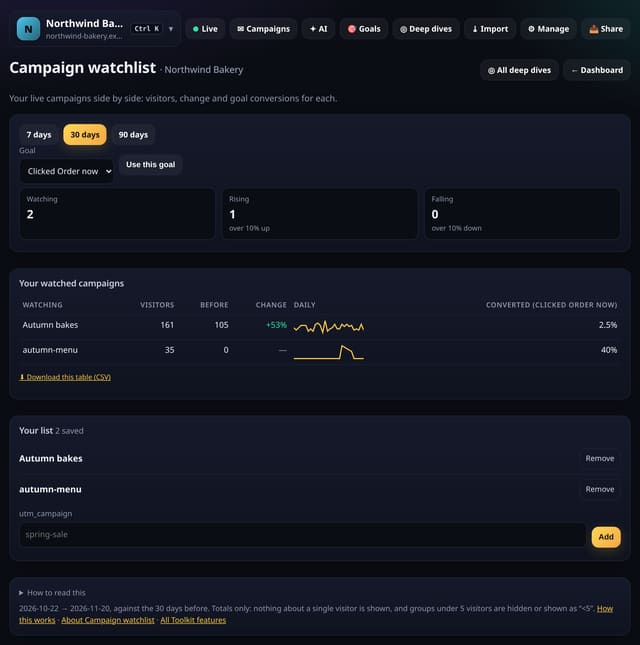
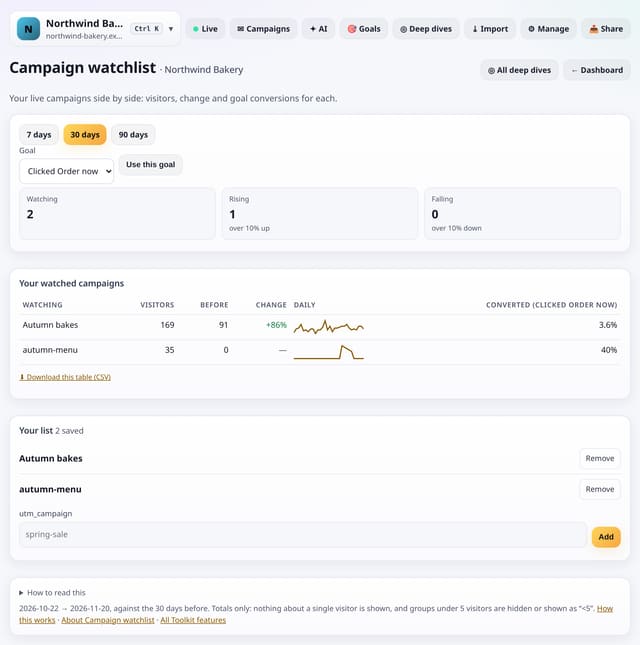
See your running campaigns side by side: visitors, change and goal conversions for each utm_campaign.
Why use it: When several campaigns run at once it is hard to see which one is pulling its weight.
About Campaign watchlistHow to use it: Campaign watchlistQS-375
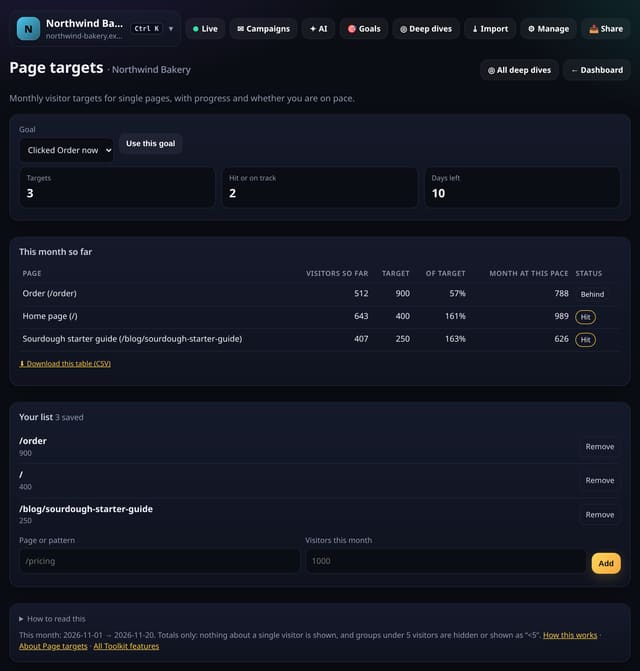
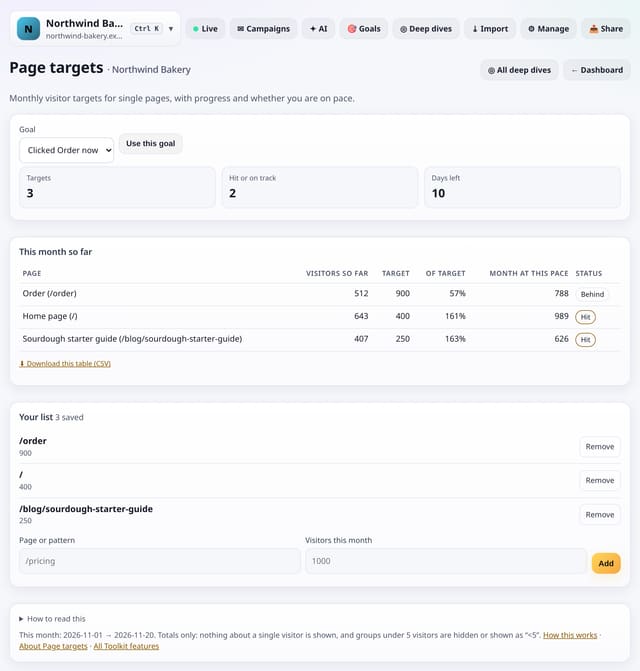
Set a monthly visitor target for any page and see progress, the pace you are on and whether you will hit it.
Why use it: Site-wide targets hide the pages that matter most.
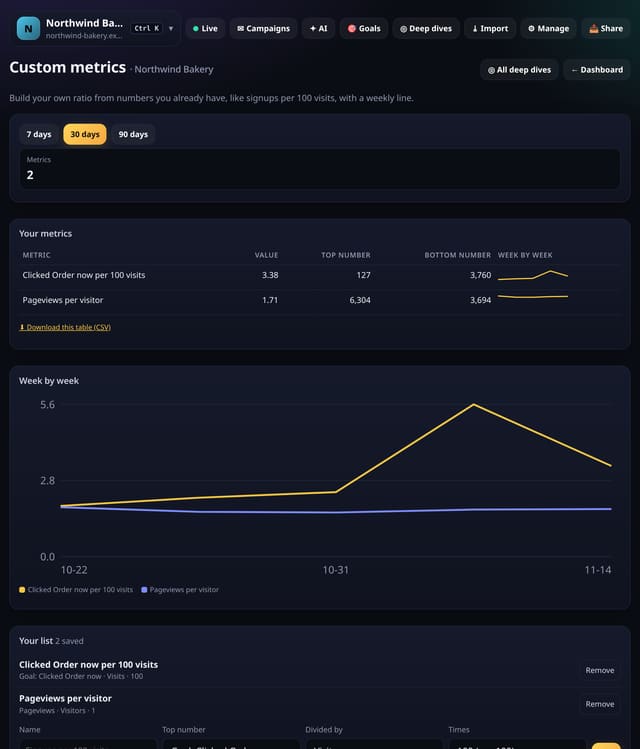
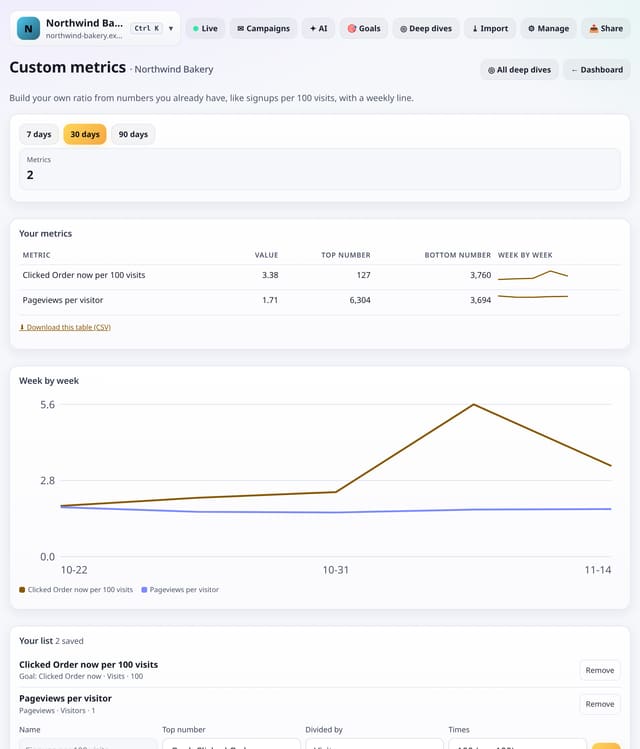
Make your own metric from two numbers quietstats already counts, like signups per 100 visits, with a weekly line.
Why use it: Every business has one or two numbers it really cares about that no tool shows by default.
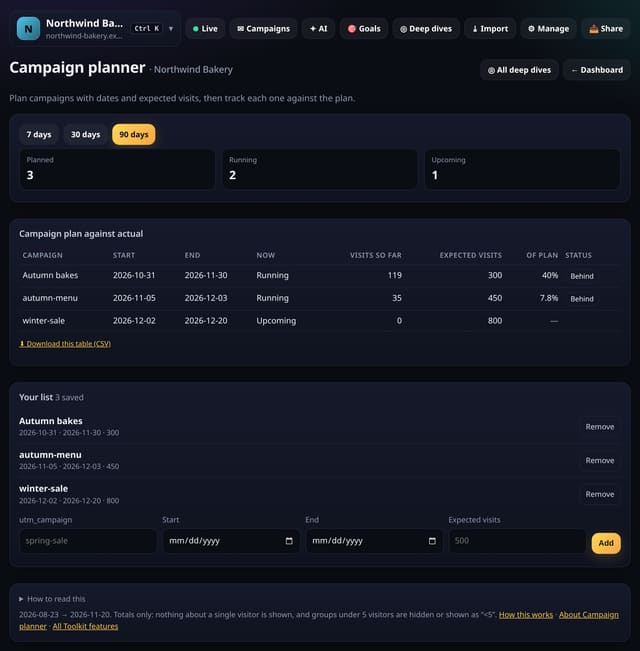
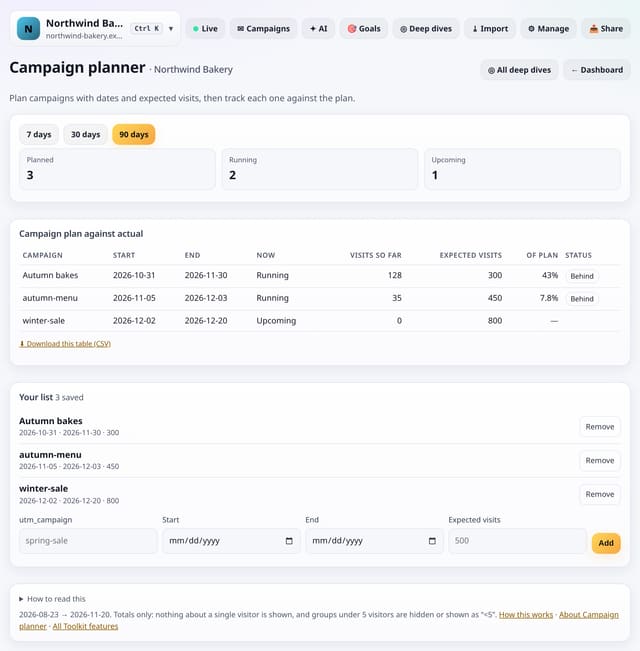
Write down each campaign’s dates and expected visits, then see how it is doing against the plan as visits arrive.
Why use it: Plans usually live in a spreadsheet nobody updates.
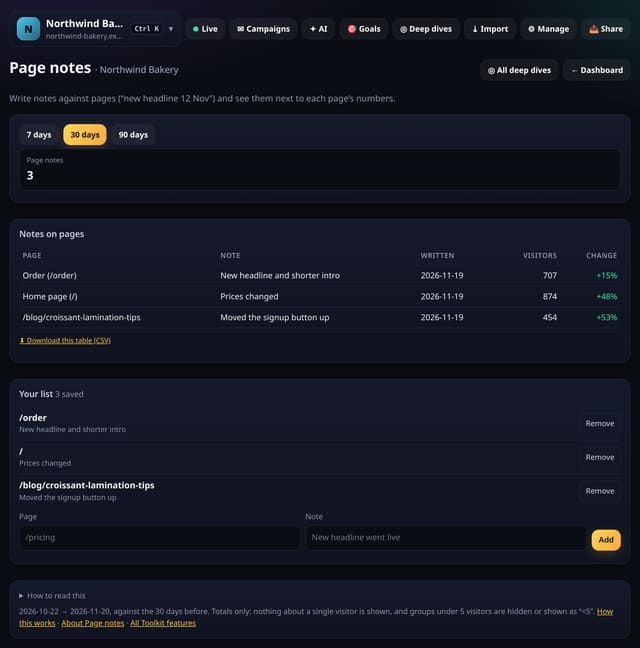
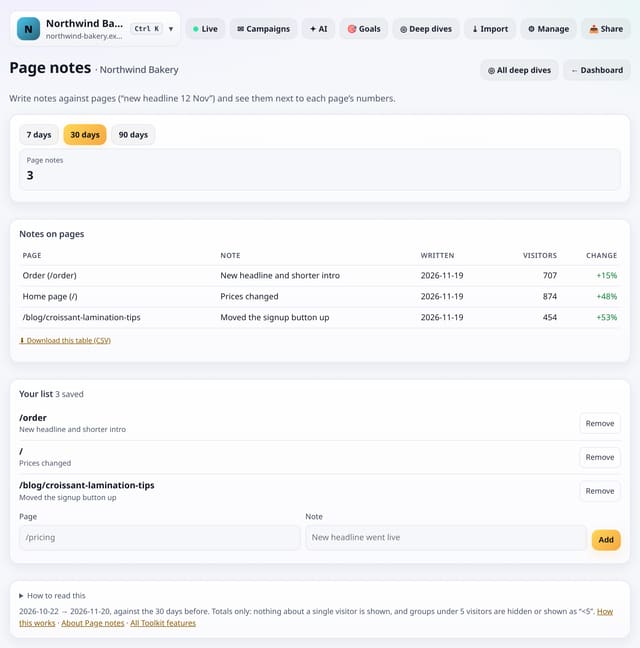
Write notes against pages (“new headline 12 Nov”, “price changed”) and see them beside each page’s visitors and change.
Why use it: Chart notes say what happened on a day; page notes say what you changed on a page.
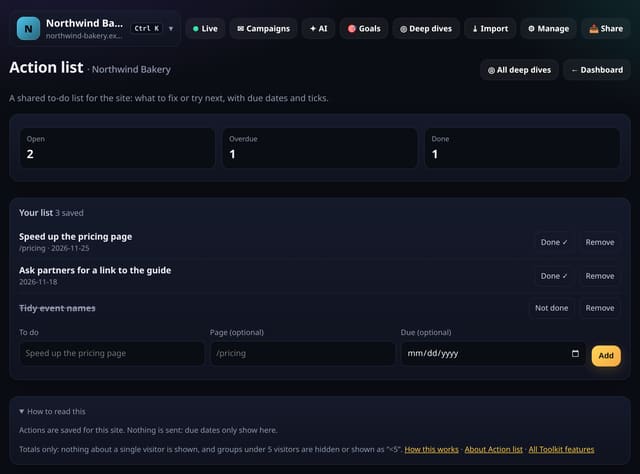
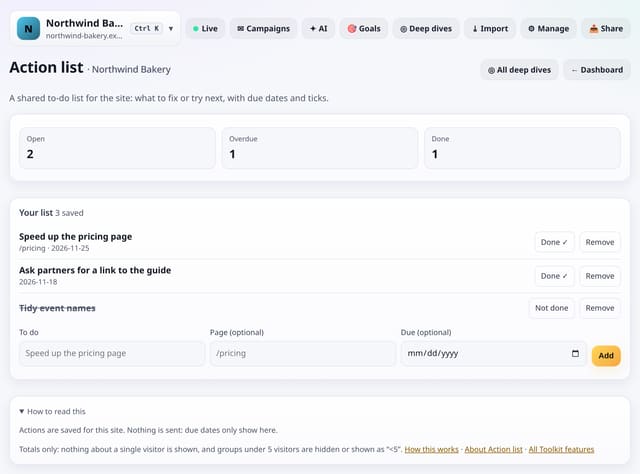
Keep a shared list of things to fix or try for the site, with optional page and due date, and tick them off.
Why use it: Analytics is only useful if something changes.
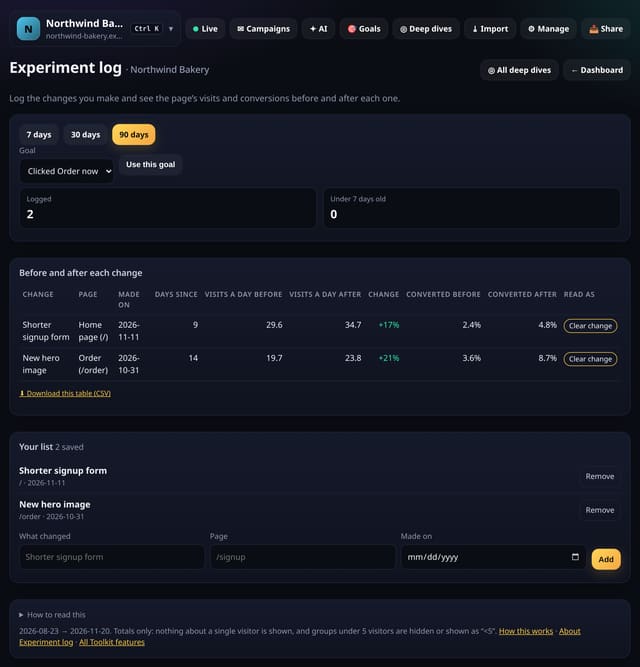
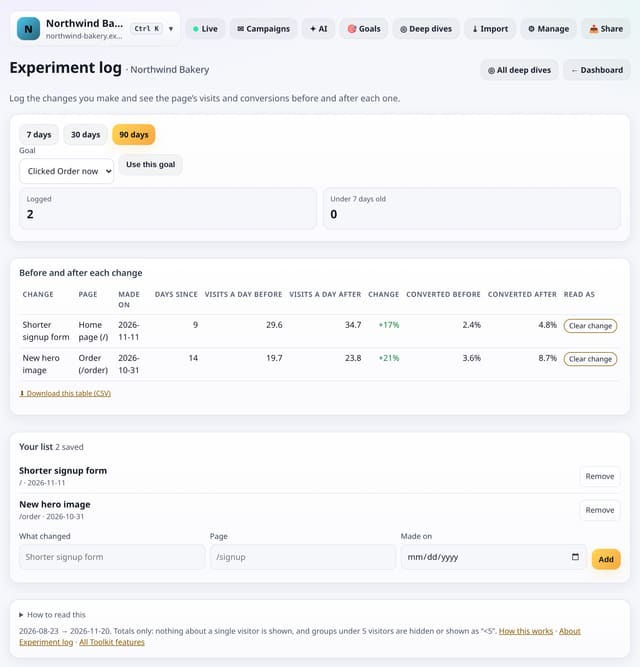
Log each change you make to a page and see visits and conversions for the 14 days before and the days since.
Why use it: Without a log, nobody remembers which tweak happened when.
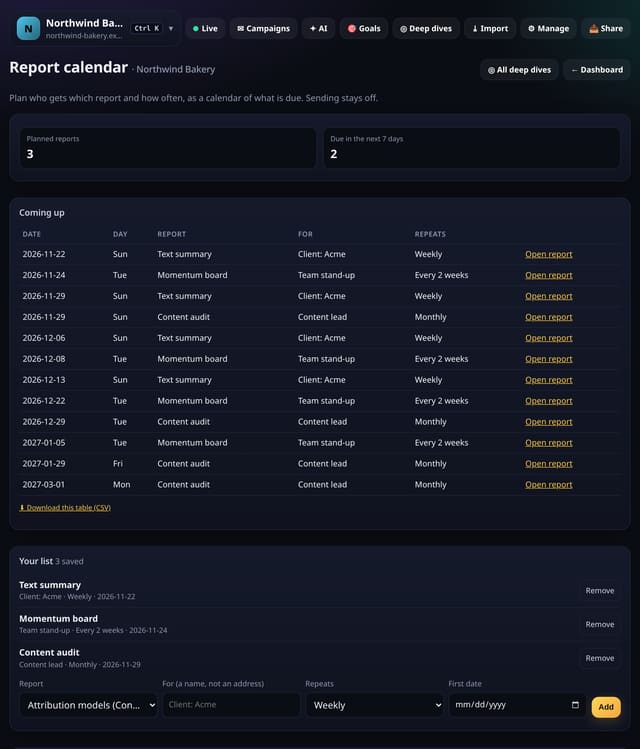
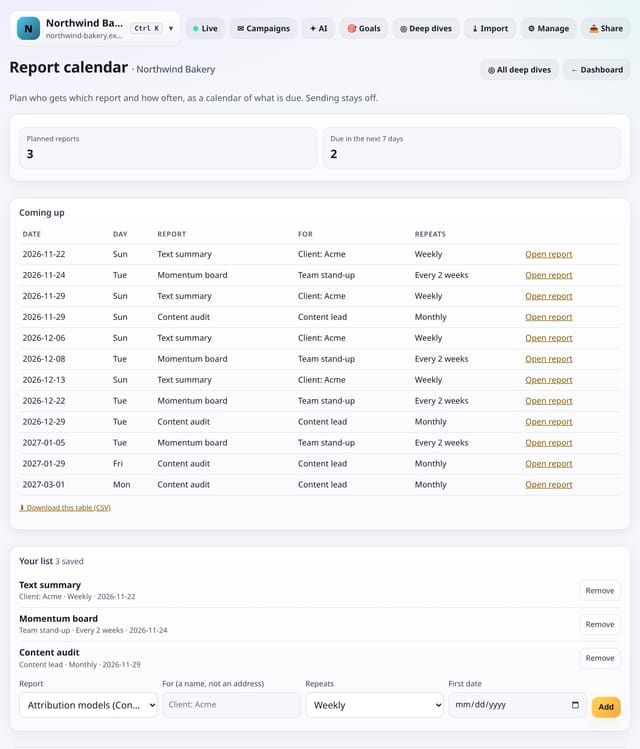
Plan who looks at which report and how often, and see what is due in the coming weeks. Sending stays off.
Why use it: Agencies and teams have a rhythm of reports.
A short checklist for your weekly look at the numbers, with links to each screen and ticks saved week by week.
Why use it: A routine beats inspiration.
About Weekly review checklistHow to use it: Weekly review checklistQS-383
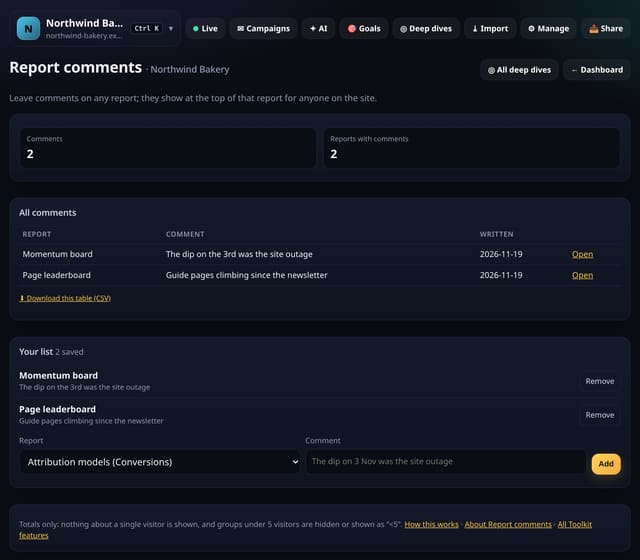
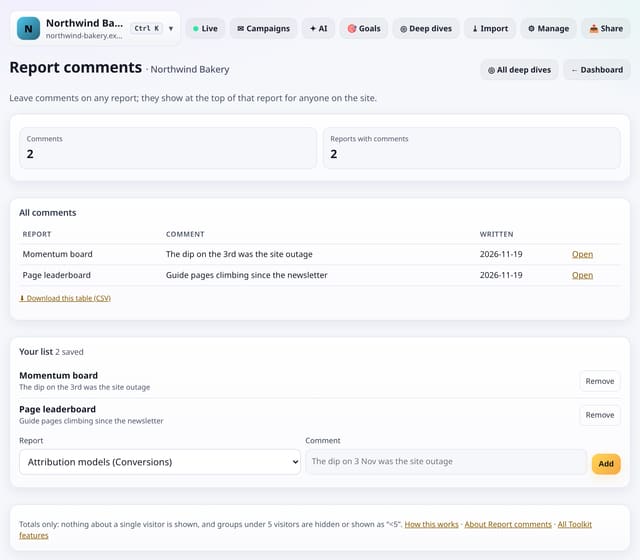
Leave a comment on any report, like “the dip on the 3rd was the outage”, and it shows at the top of that report.
Why use it: Context gets lost between colleagues and months.
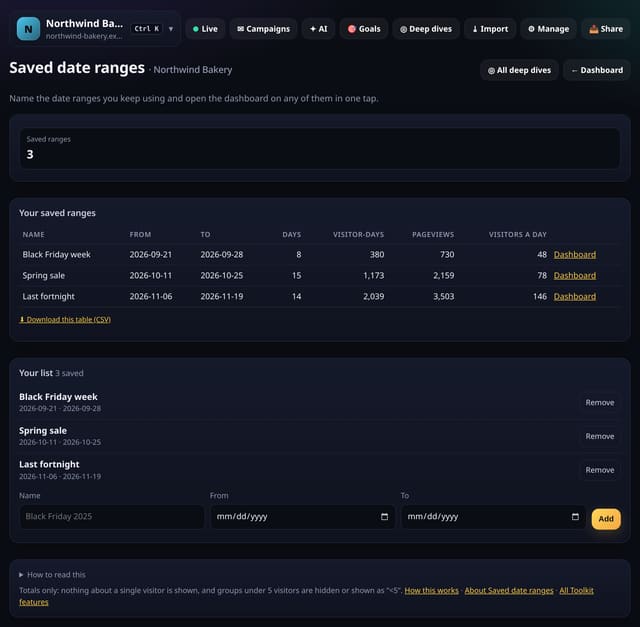
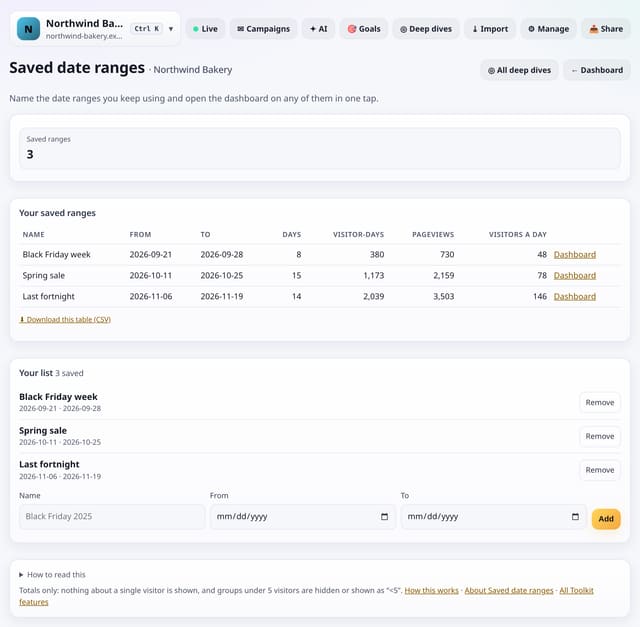
Name the date ranges you use again and again, like “Black Friday week”, and open the dashboard on any of them in one tap.
Why use it: Comparing this year’s sale with last year’s means typing the same dates every time.
About Saved date rangesHow to use it: Saved date rangesQS-385
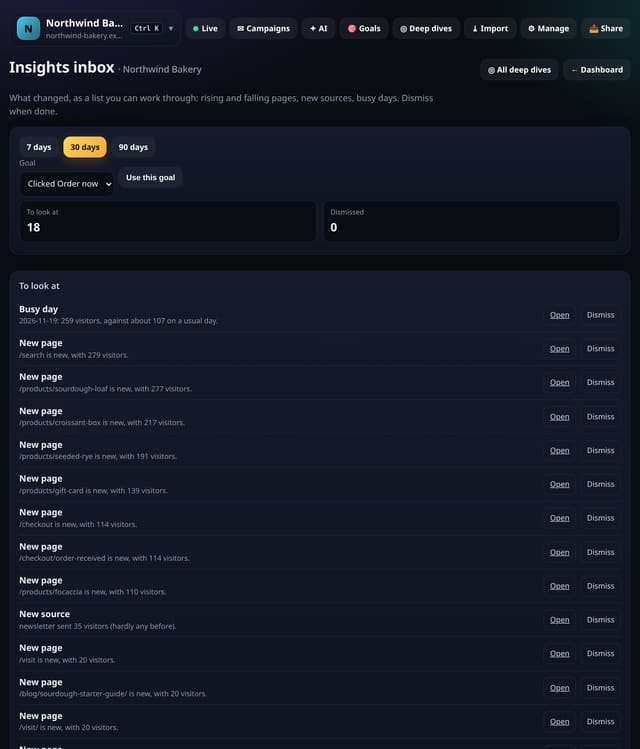
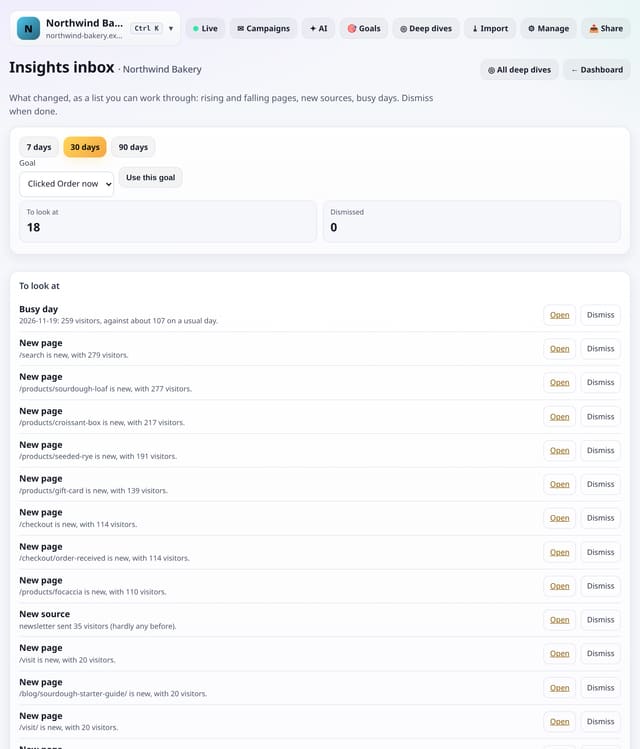
A list of what changed, worked out when you open it: rising, falling, new and quiet pages, new sources, goal moves and unusual days.
Why use it: Dashboards wait for you to notice things.
Type part of an address or a friendly name and get every matching page with visitors, views, entries and change.
Why use it: Big sites have thousands of pages.
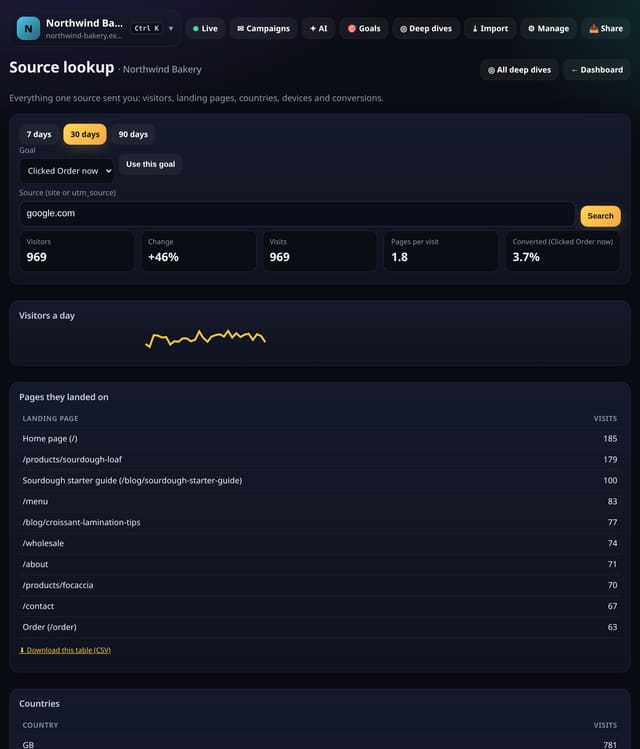
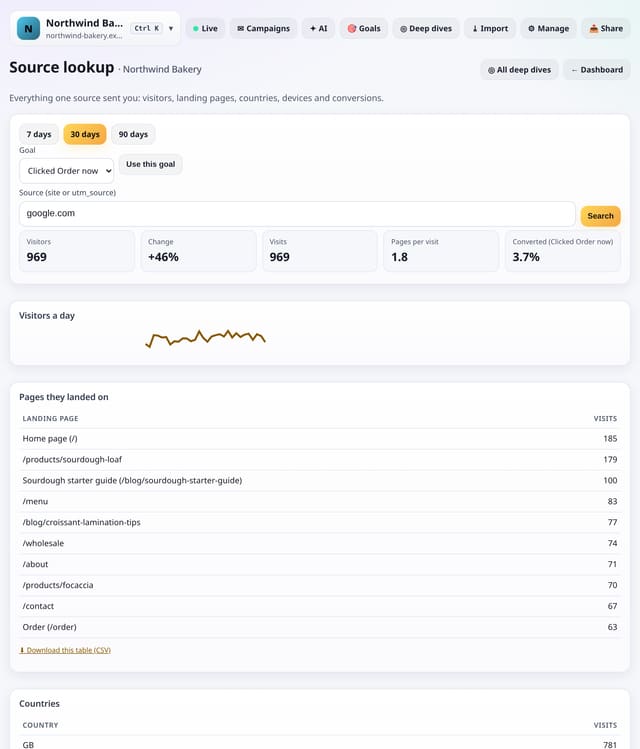
Type one site or utm_source and see its visitors, change, landing pages, countries, devices and conversions.
Why use it: When a new referrer appears, the first question is “what did they look at?”.
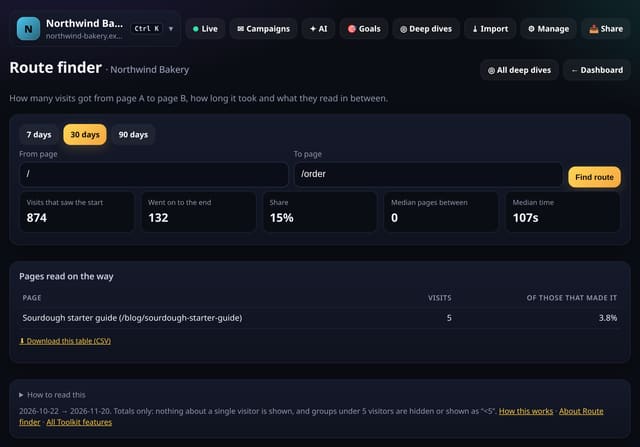
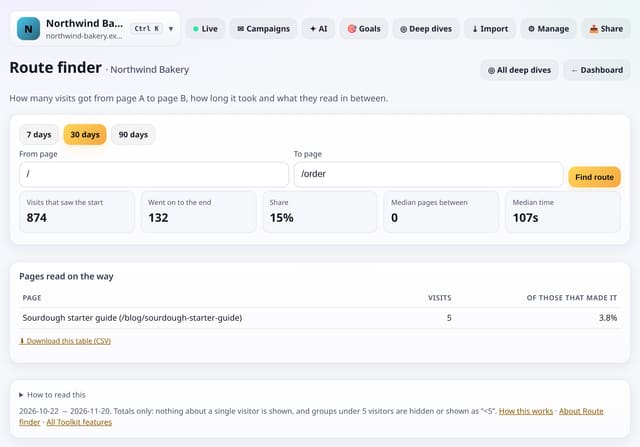
Pick a start page and an end page and see how many visits made it, how long it took and what they read on the way.
Why use it: You want blog readers to reach pricing.
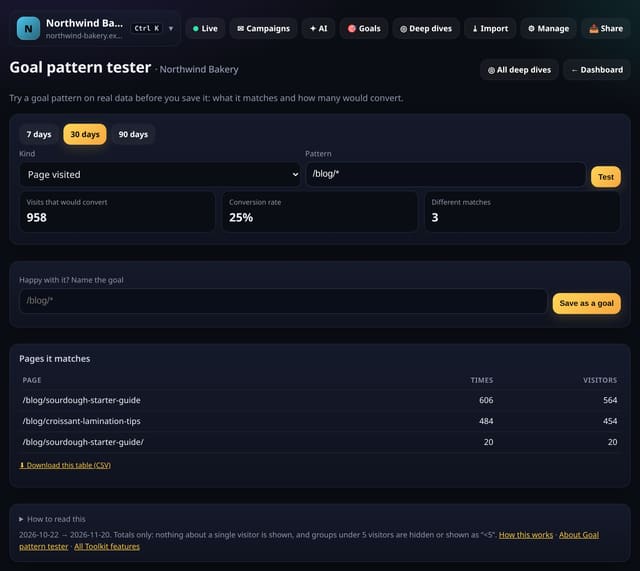
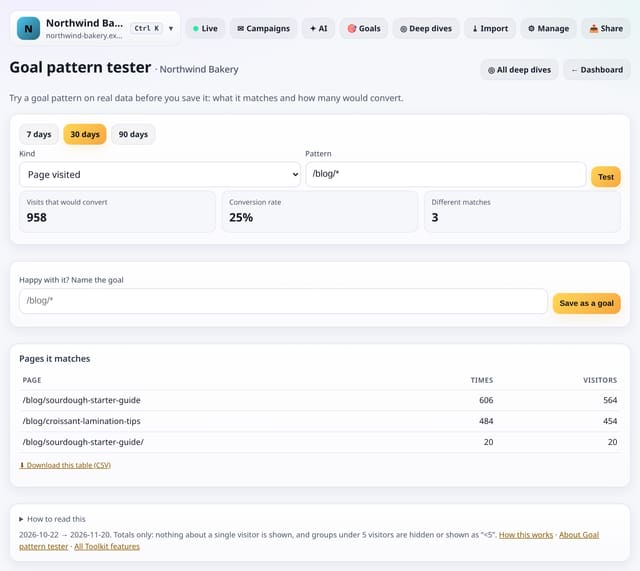
Type a goal pattern and see what it would match on real data, and how many visits would convert, before you save it.
Why use it: A goal with a typo counts nothing for weeks before anyone notices.
About Goal pattern testerHow to use it: Goal pattern testerQS-390
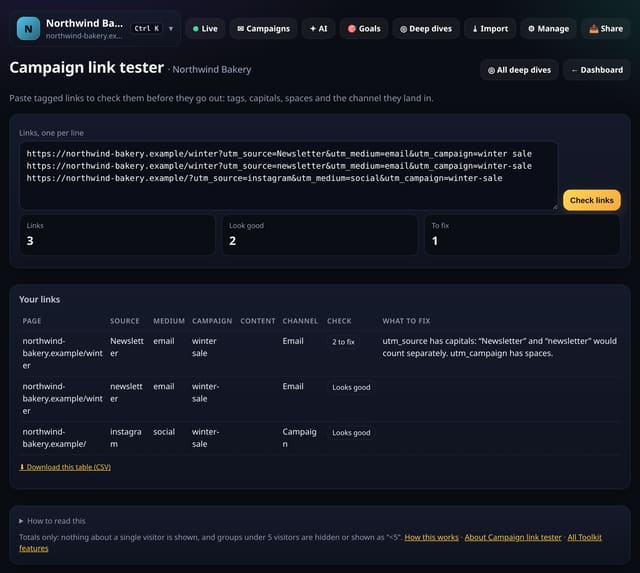
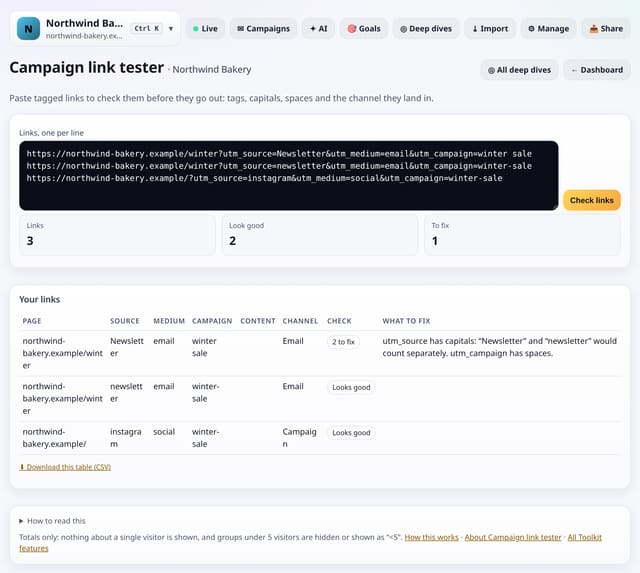
Paste tagged links and check each one: source, medium, campaign, the channel it will land in and anything to fix.
Why use it: One capital letter splits a campaign in two.
About Campaign link testerHow to use it: Campaign link testerQS-391
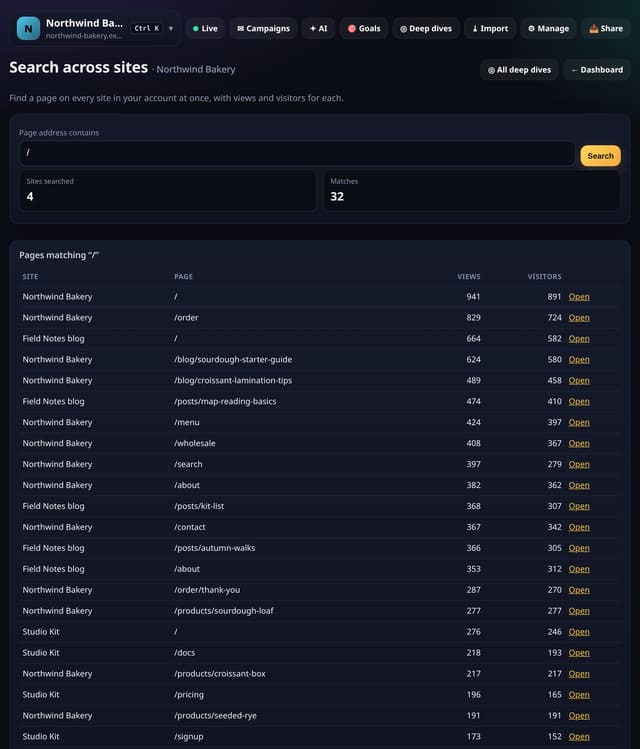
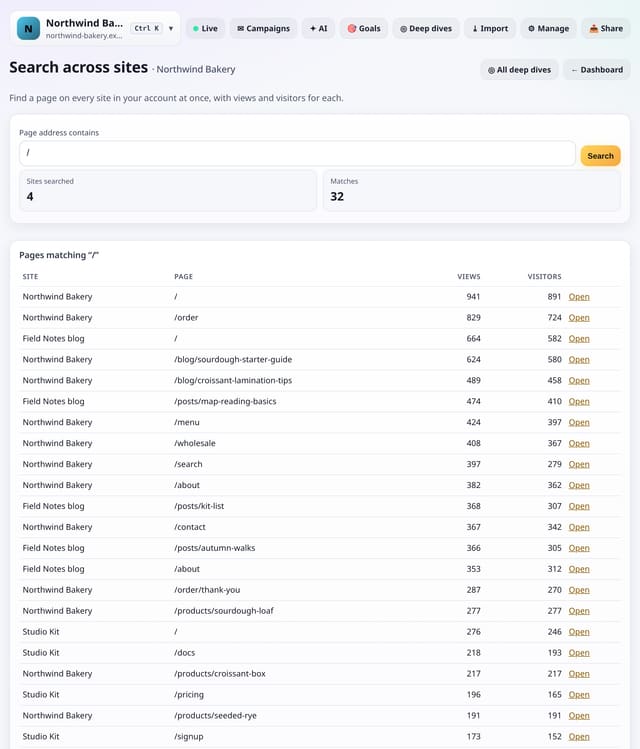
Type part of a page address and find it on every site in your account, with views and visitors for each.
Why use it: Agencies and people with several sites often ask “which site has the /pricing page doing best?”.
About Search across sitesHow to use it: Search across sitesQS-392
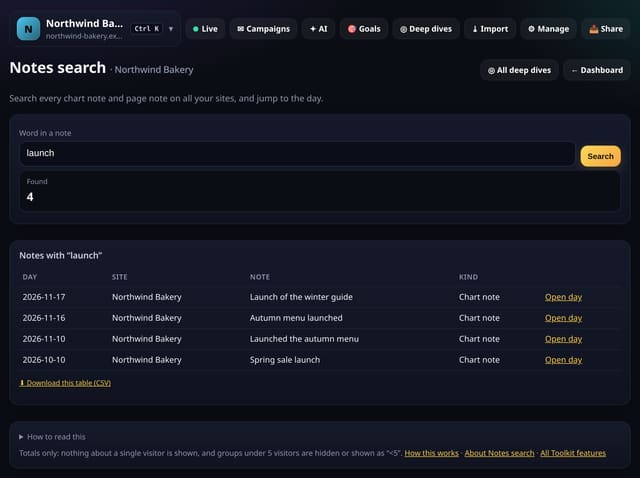
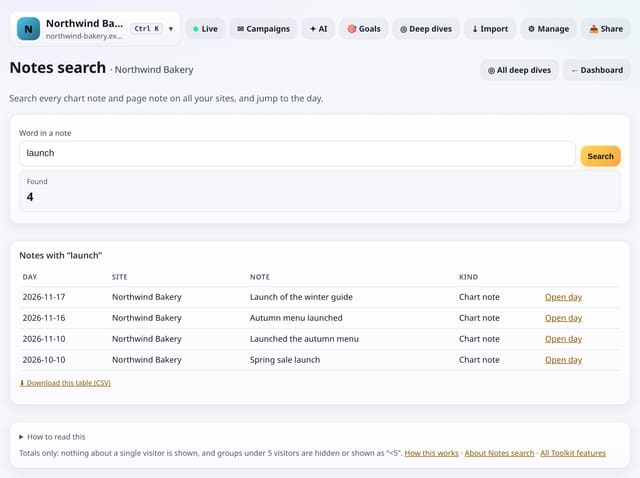
Search every chart note on all your sites, and page notes on this one, and jump to the day or page.
Why use it: Notes are only useful if you can find them.
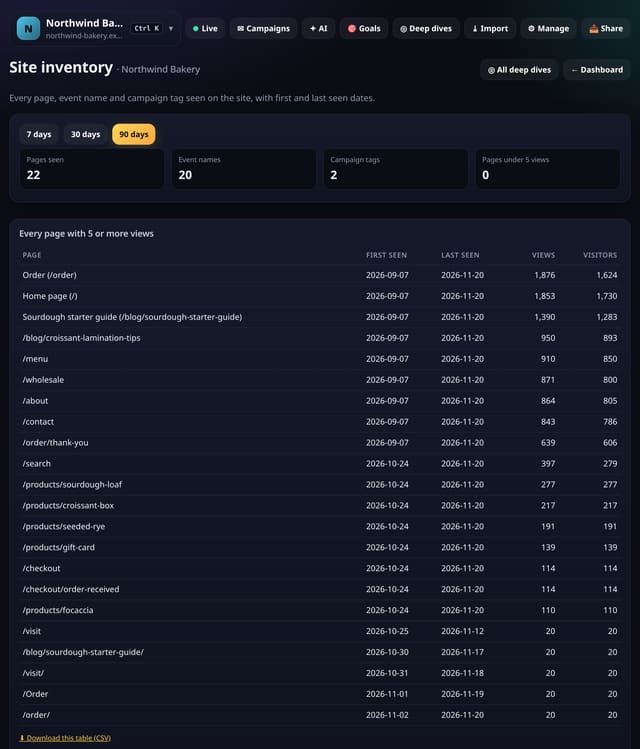
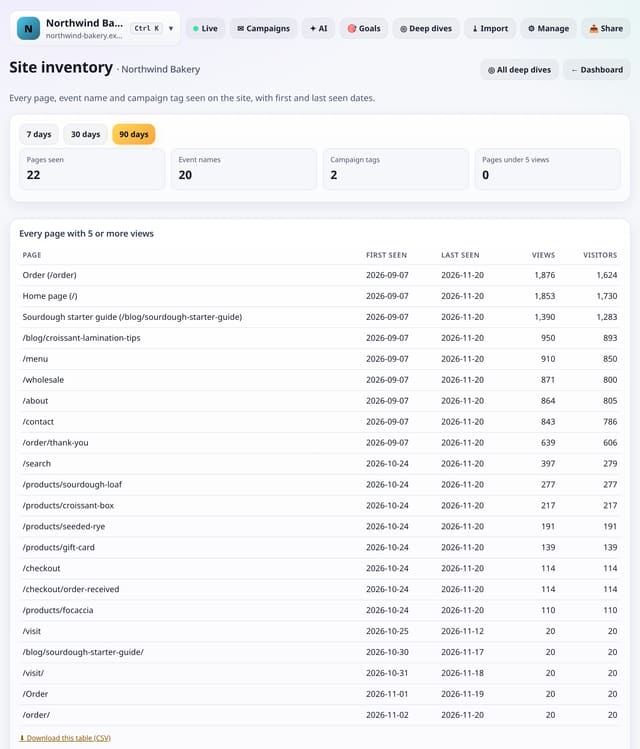
A complete list of the pages, event names and campaign tags seen on the site, with first and last seen dates.
Why use it: Site moves, redesigns and audits start with “what do we have?”.
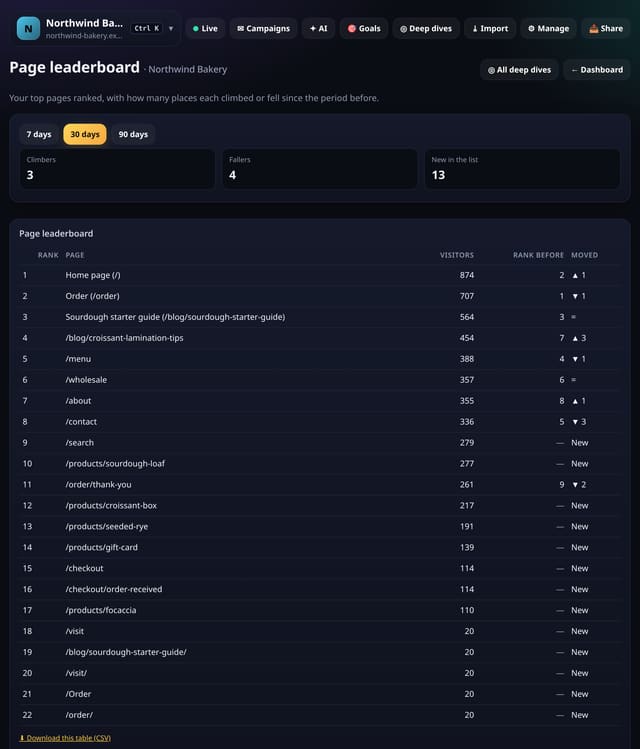
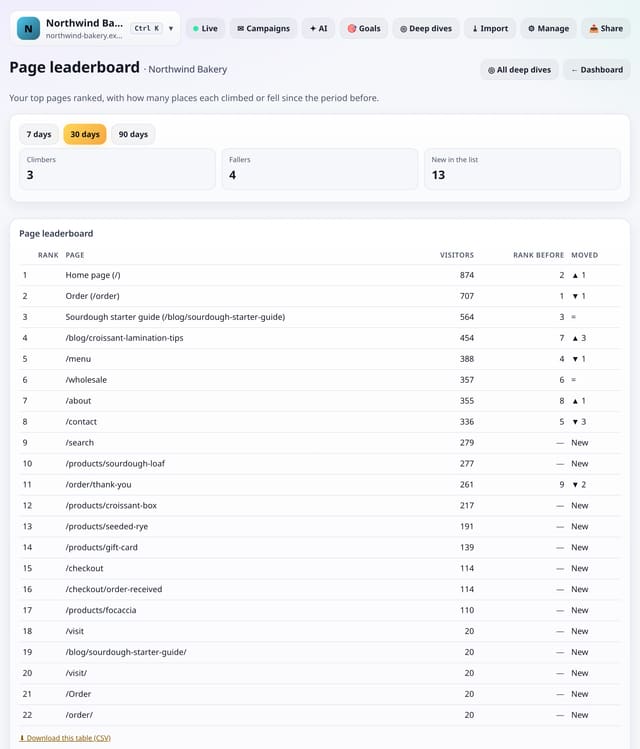
Your top pages ranked by visitors, with how many places each moved since the period before.
Why use it: Totals change slowly; ranks show momentum.
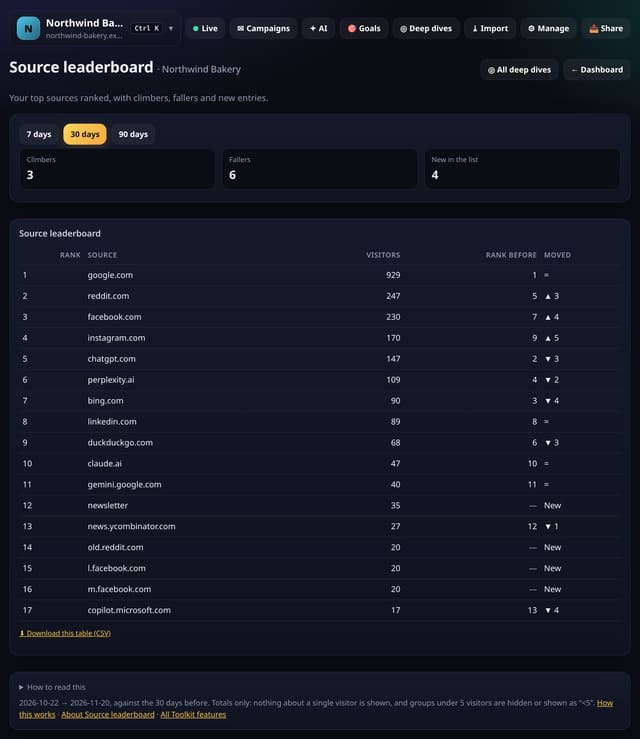
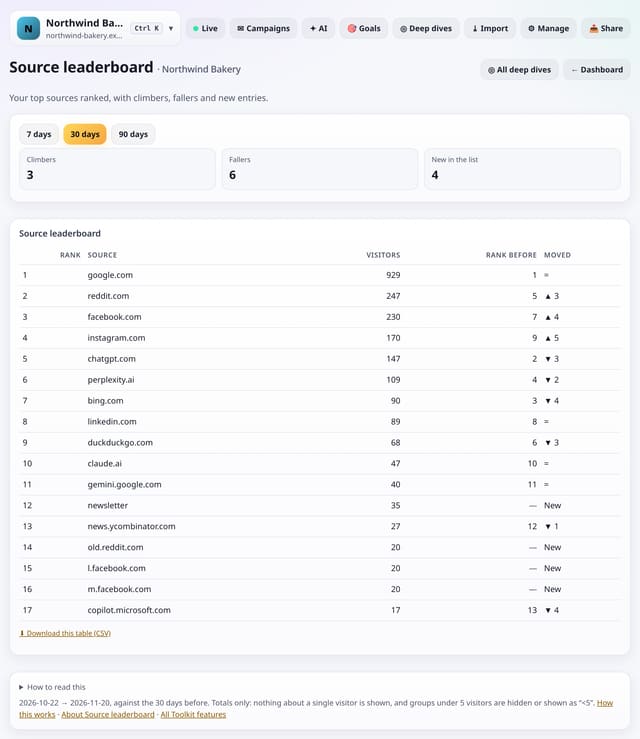
Your top sources ranked by visitors, with climbers, fallers and new entries since the period before.
Why use it: A source moving from tenth to third is a story worth knowing: a new link, a post doing well, or a change in search.
About Source leaderboardHow to use it: Source leaderboardQS-396
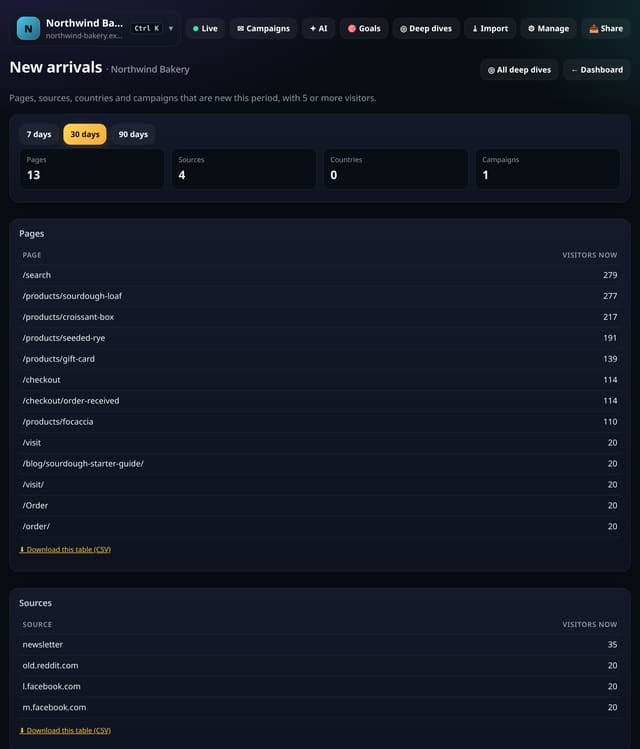
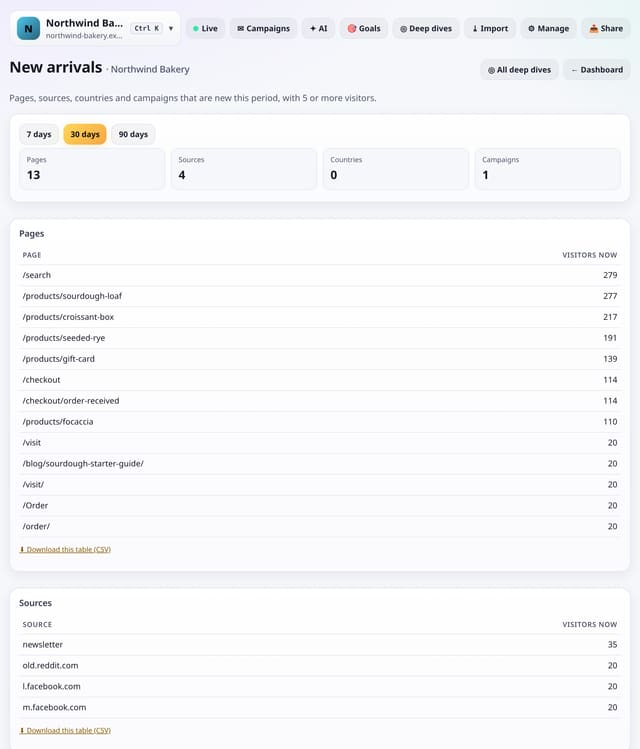
Pages, sources, countries and campaigns that brought 5 or more visitors this period and none at all in the period before.
Why use it: New things are where the news is: a page that took off, a site that started linking to you, a campaign that went live.
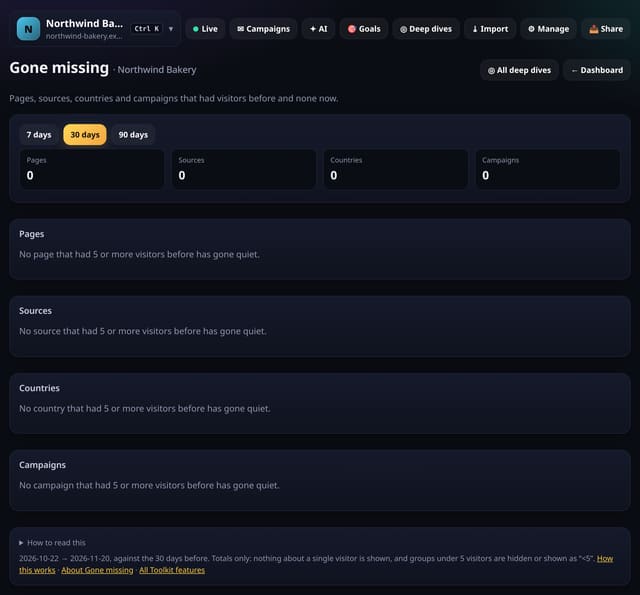
Pages, sources, countries and campaigns that had 5 or more visitors before and none at all this period.
Why use it: Things that disappear are easy to miss because there is nothing to see.
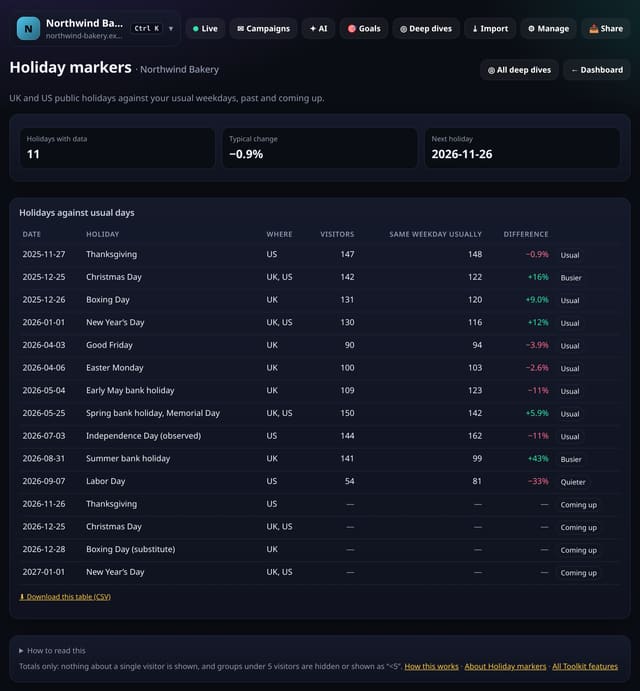
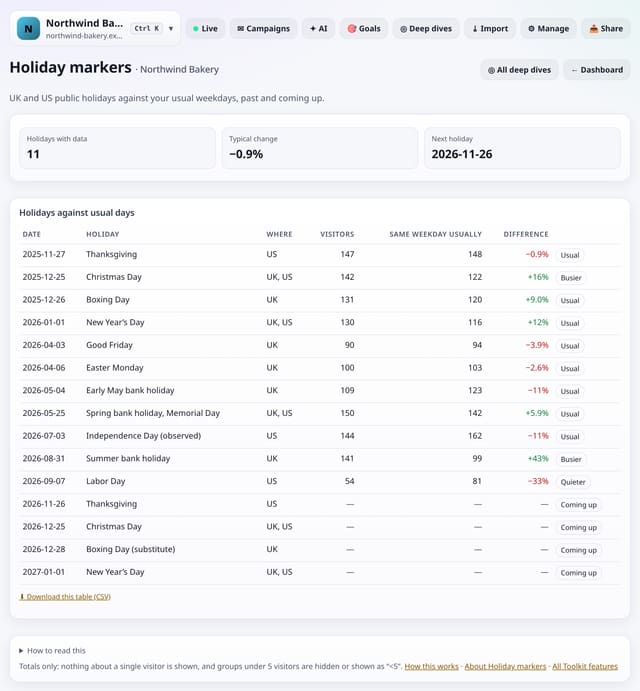
UK bank holidays and US federal holidays against the same weekday around them, past and coming up.
Why use it: Holidays explain a lot of dips and spikes.
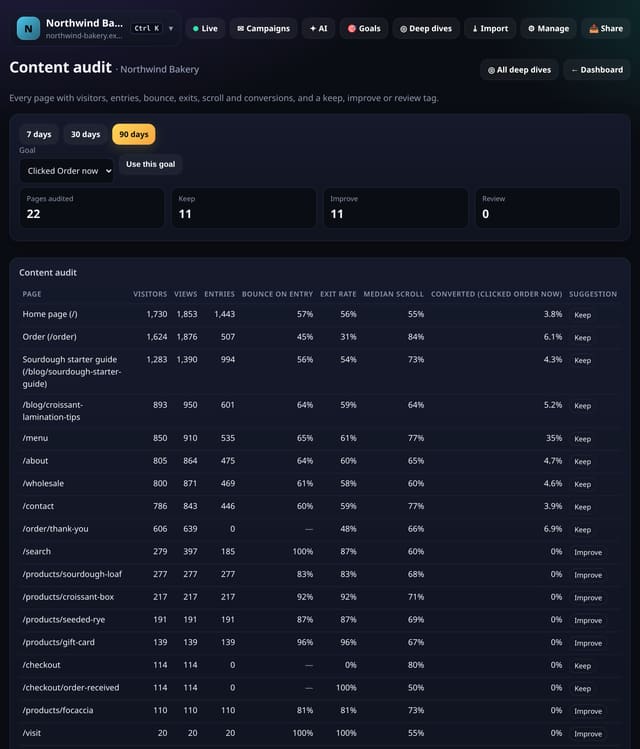
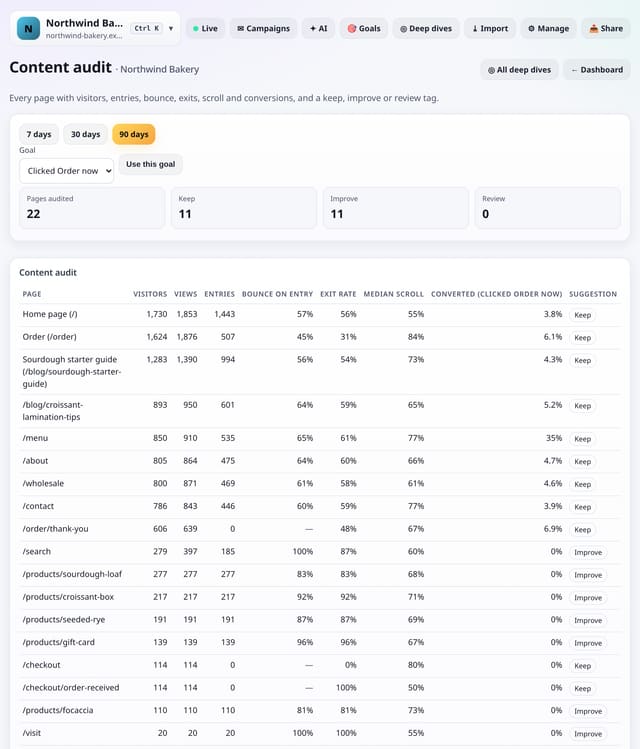
Every page with visitors, views, entries, bounce on entry, exit rate, scroll and conversions, plus a simple suggestion.
Why use it: Content audits usually start with a spreadsheet stitched together by hand.
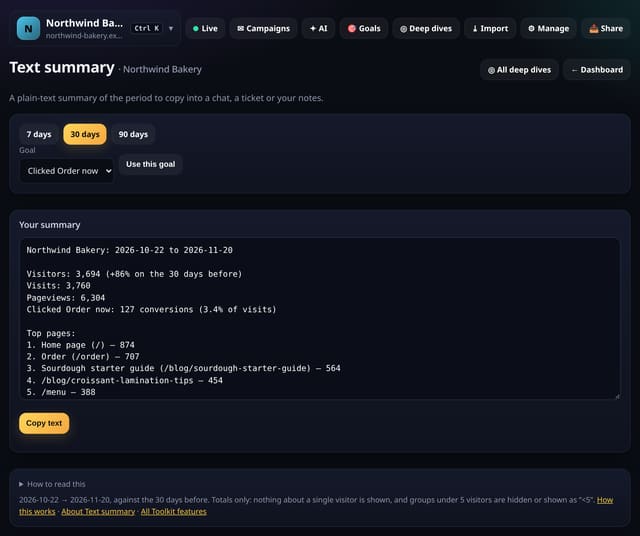
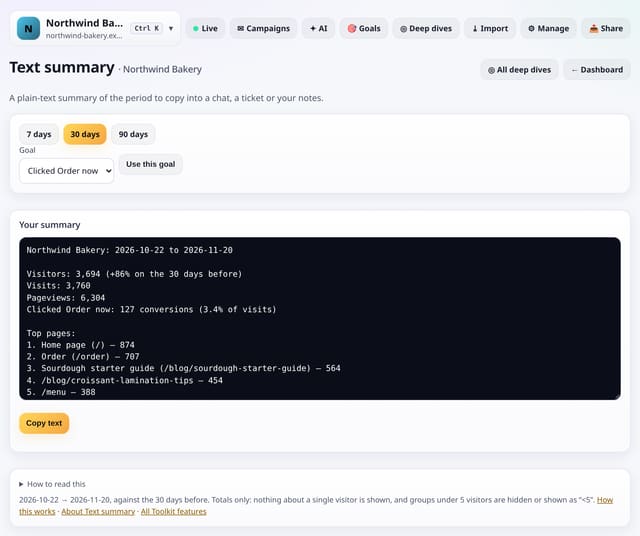
A plain-text summary of the period, with visitors, change, top pages, sources and countries, to copy anywhere.
Why use it: Sometimes you just need three lines for a stand-up or a client message, not a PDF.
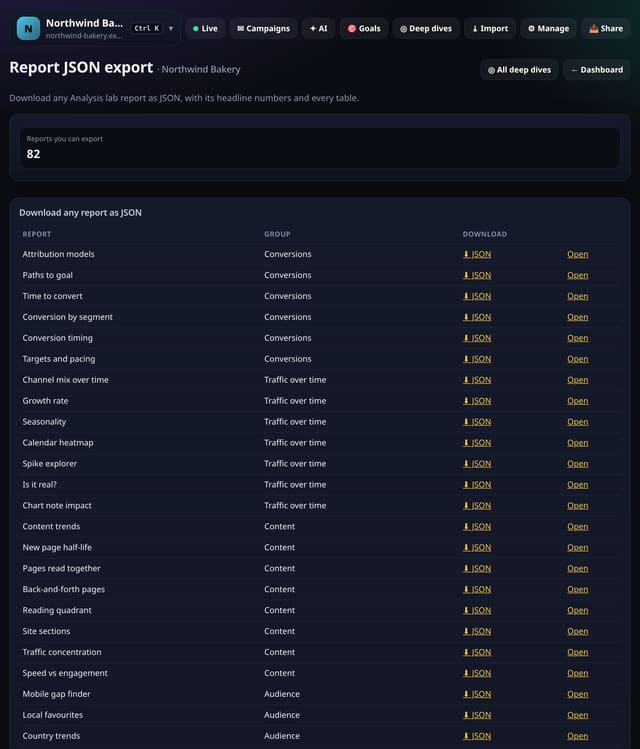
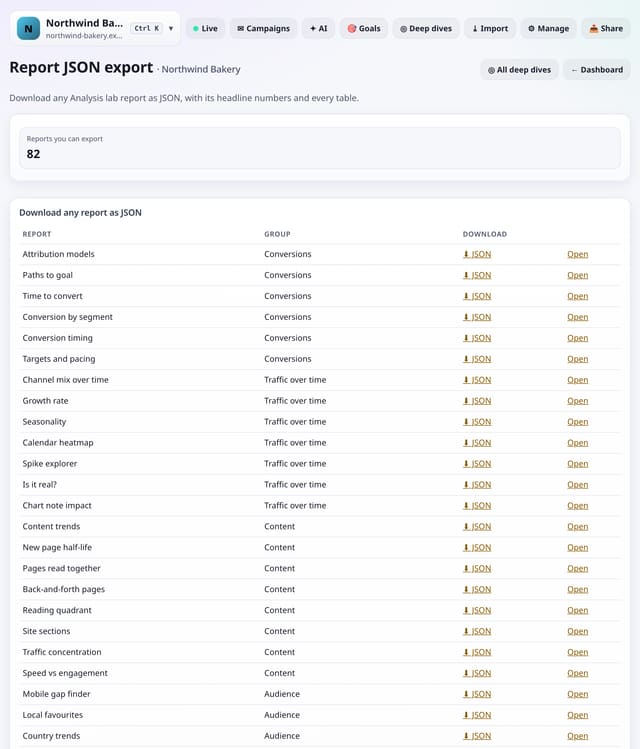
Download any Analysis lab report as JSON, with its headline numbers and every table, for your own tools.
Why use it: CSV is one table at a time.
About Report JSON exportHow to use it: Report JSON exportQS-402
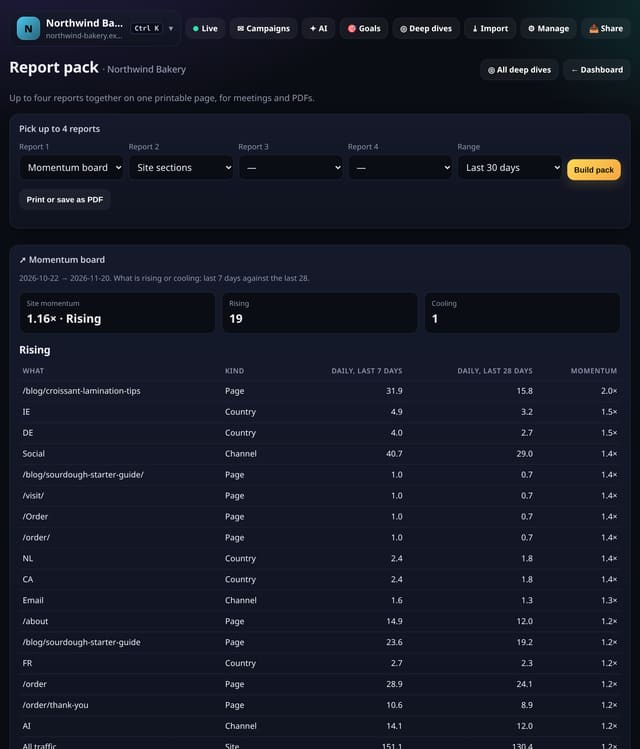
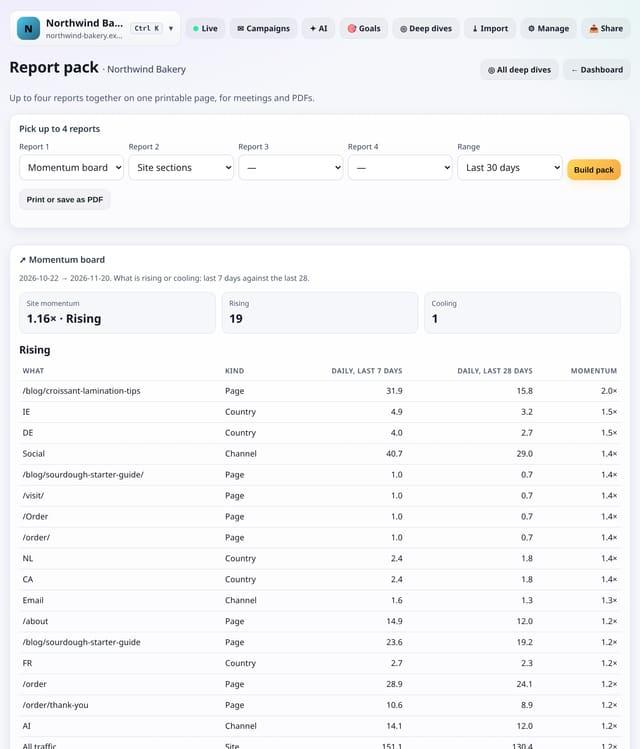
Pick up to four reports and get them together on one page, laid out for printing or saving as a PDF.
Why use it: Meetings need one document, not four tabs.
Freeze any report into a read-only link you can share, then delete it whenever you like.
Why use it: Sometimes you need to show one number to someone without an account, and you want it to stay as it was when you sent it.
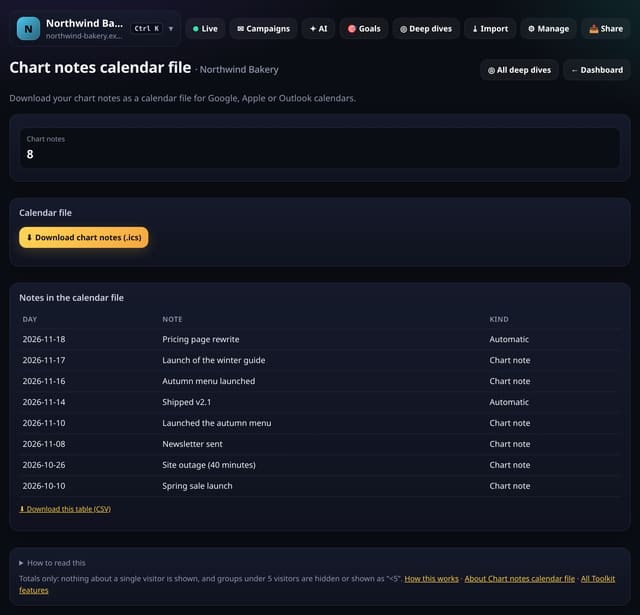
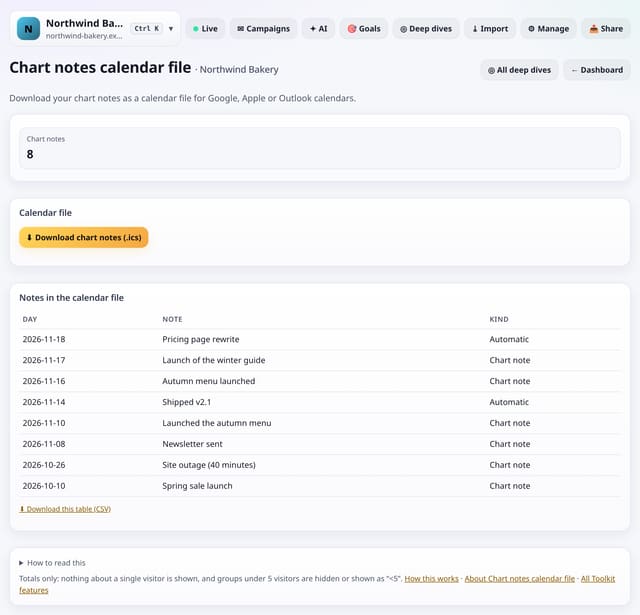
Download your chart notes as an .ics file that opens in Google Calendar, Apple Calendar or Outlook.
Why use it: Your calendar is where you plan.
About Chart notes calendar fileHow to use it: Chart notes calendar fileQS-405
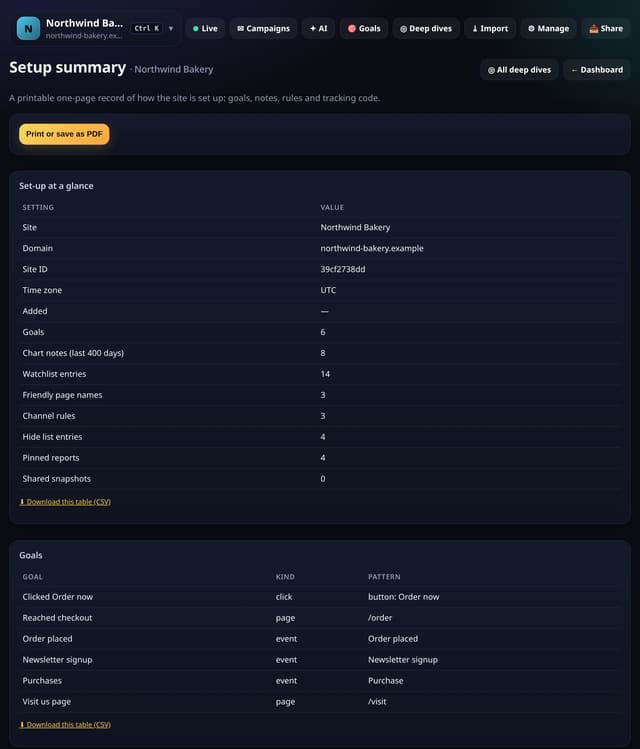
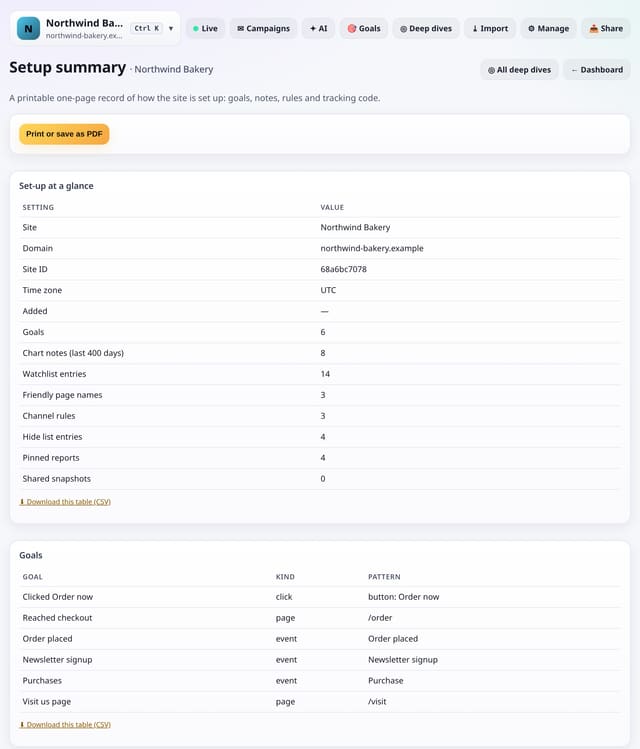
A printable one-page record of the site’s settings, goals, Toolkit rules and tracking code.
Why use it: Handovers, audits and new team members all start with “how is this set up?”.
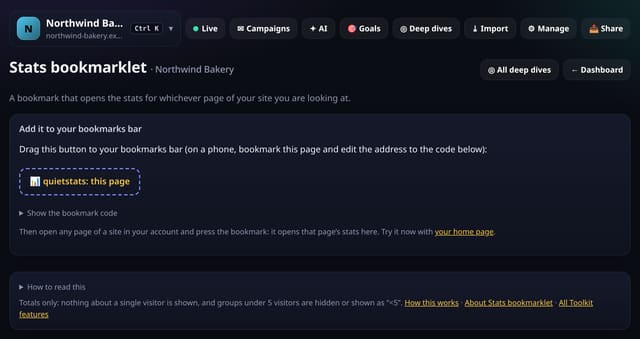
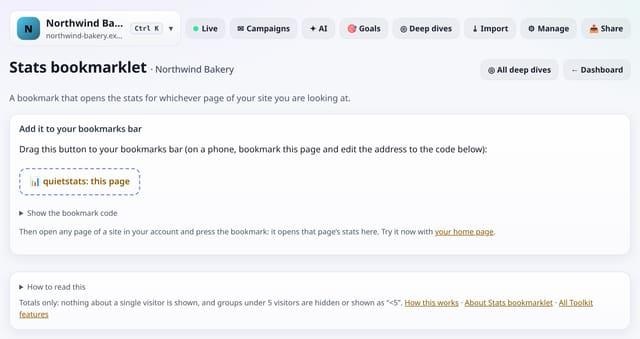
A bookmark that opens the stats for whichever page of your site you are looking at.
Why use it: When you are looking at a page and wonder how it is doing, the stats should be one click away.
About Stats bookmarkletHow to use it: Stats bookmarkletQS-407
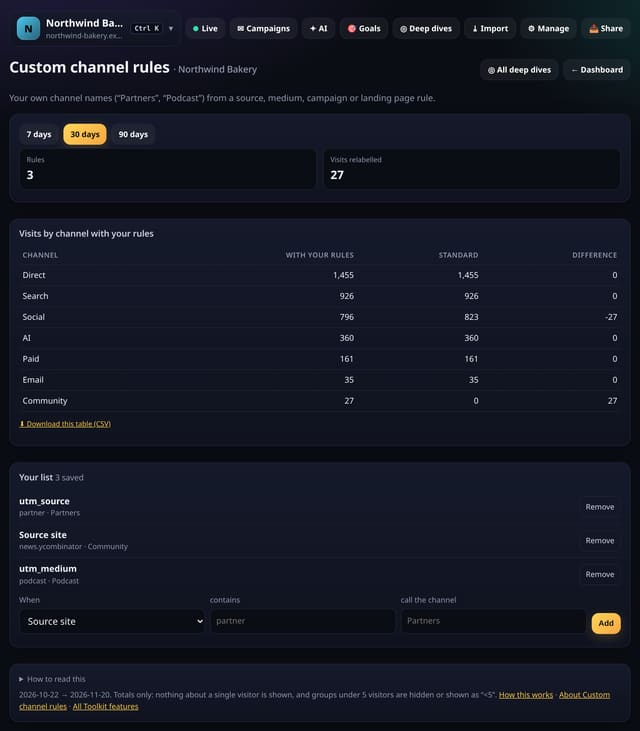
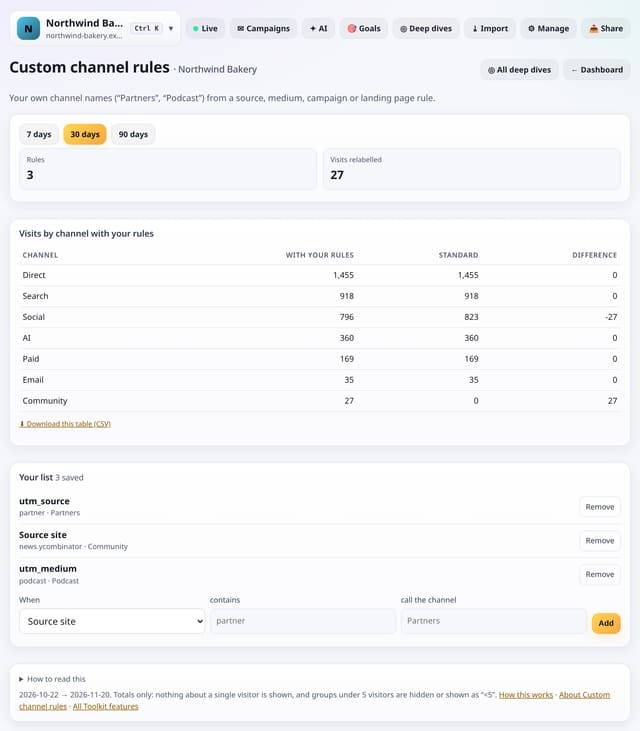
Make your own channels, like Partners or Podcast, from a source, medium, campaign or landing page rule.
Why use it: Standard channels (Search, Social, Email…) fit most sites, but your business may think in partners, affiliates or podcasts.
About Custom channel rulesHow to use it: Custom channel rulesQS-408
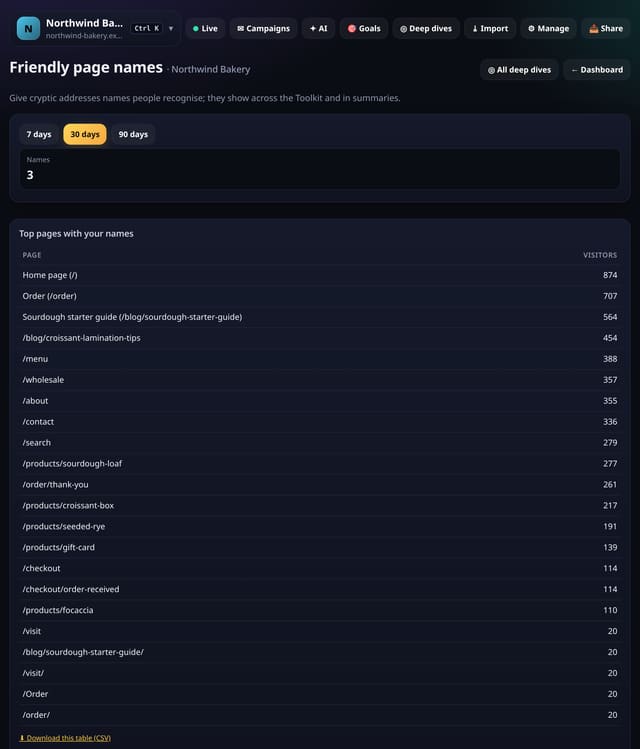
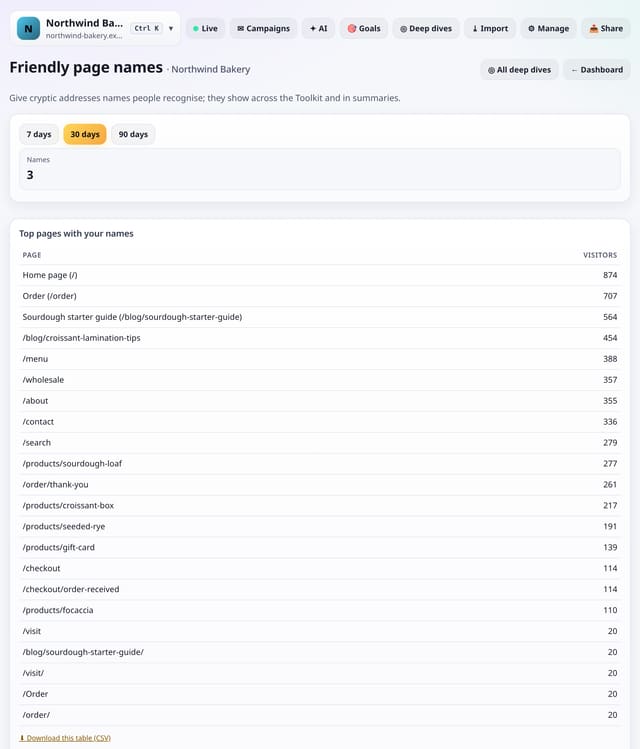
Give long or cryptic page addresses a name (“/p/4471” → “Winter coat”) that shows across the Toolkit.
Why use it: Product IDs and long slugs make reports hard to read for clients and colleagues.
About Friendly page namesHow to use it: Friendly page namesQS-409
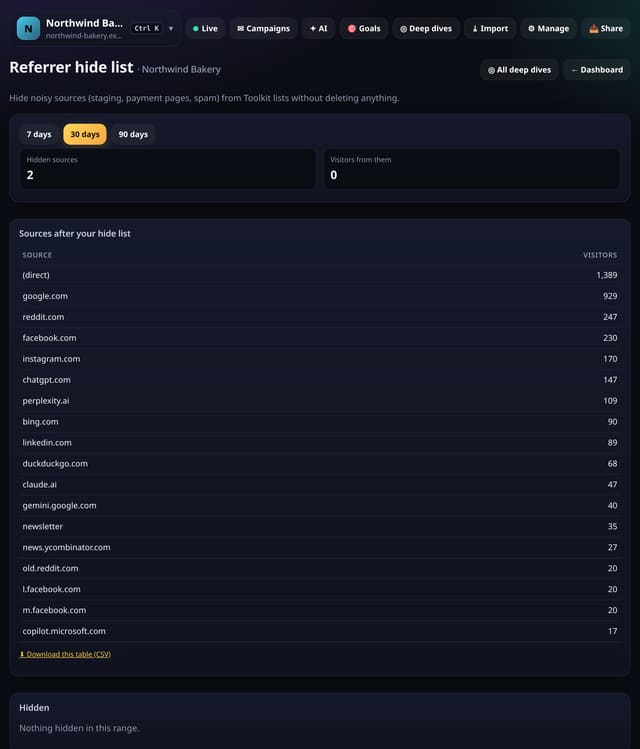
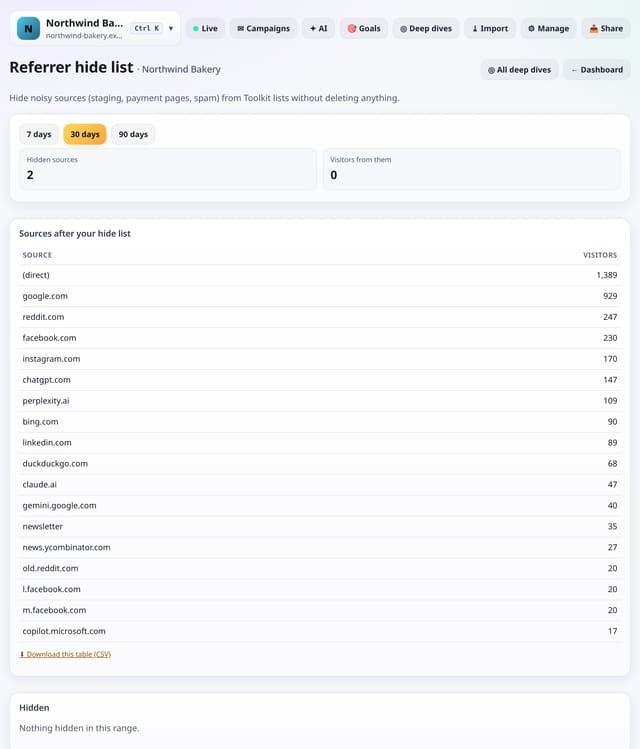
Hide noisy sources (your staging site, a payment page, a spam domain) from Toolkit lists without deleting anything.
Why use it: Payment pages and staging sites clutter source lists.
About Referrer hide listHow to use it: Referrer hide listQS-410
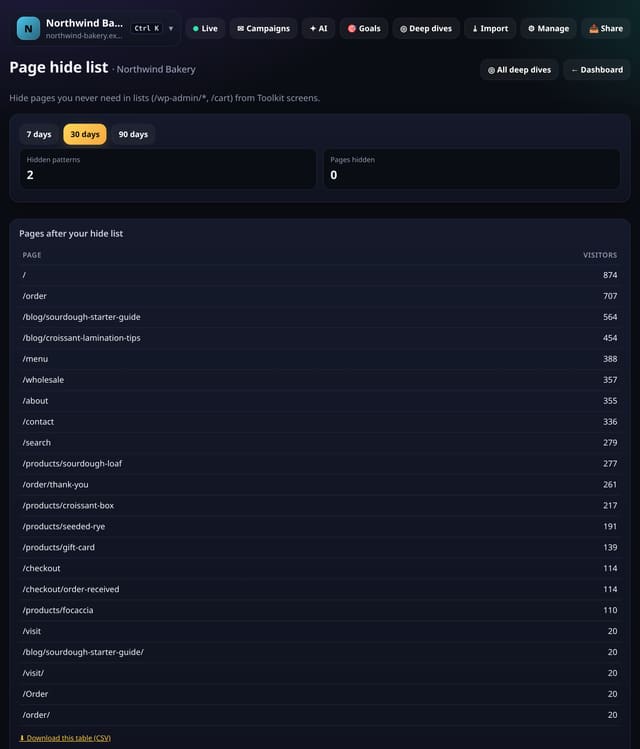
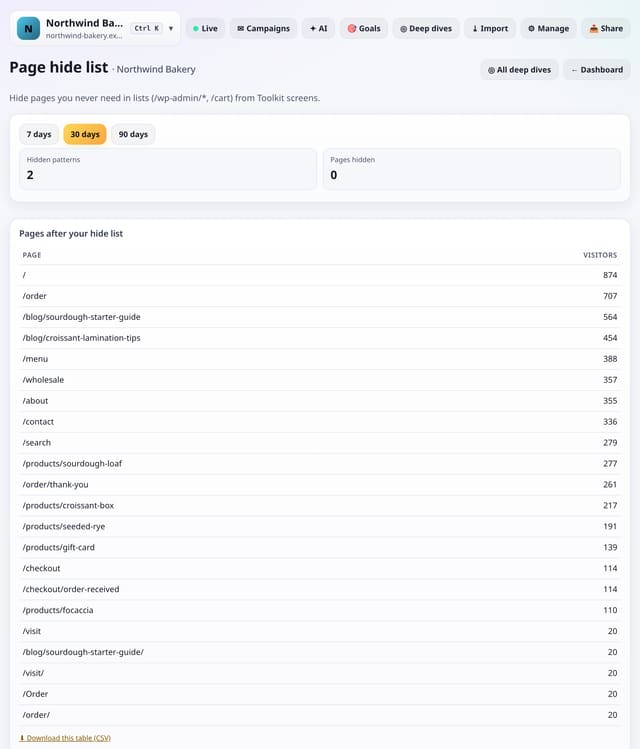
Hide pages such as /wp-admin/*, /cart or /account/* from Toolkit lists, without deleting anything.
Why use it: Admin, cart and account pages fill lists without telling you anything.
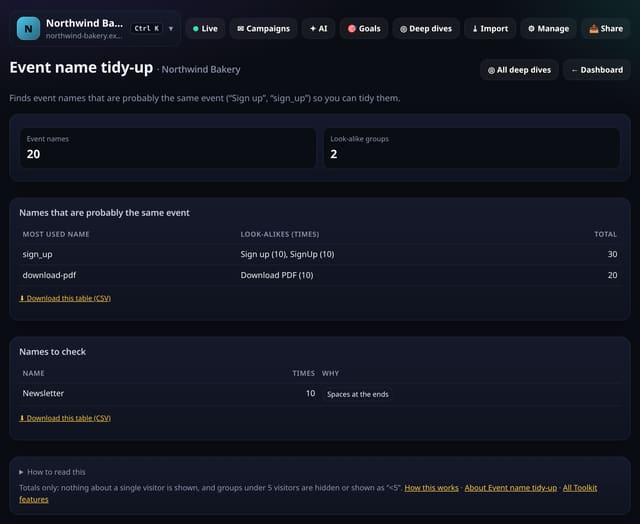
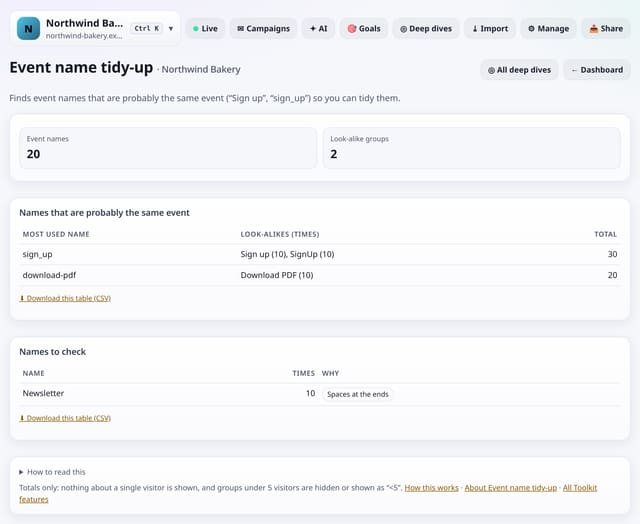
Finds event names that are probably the same event (“Sign up”, “sign_up”, “SignUp”) so you can tidy them.
Why use it: Look-alike names split one event into several, so every count is too low.
About Event name tidy-upHow to use it: Event name tidy-upQS-412
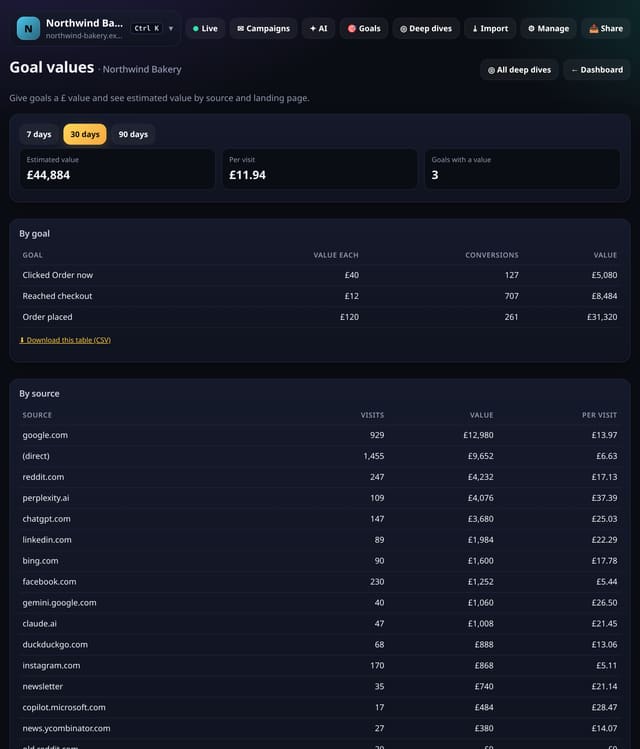
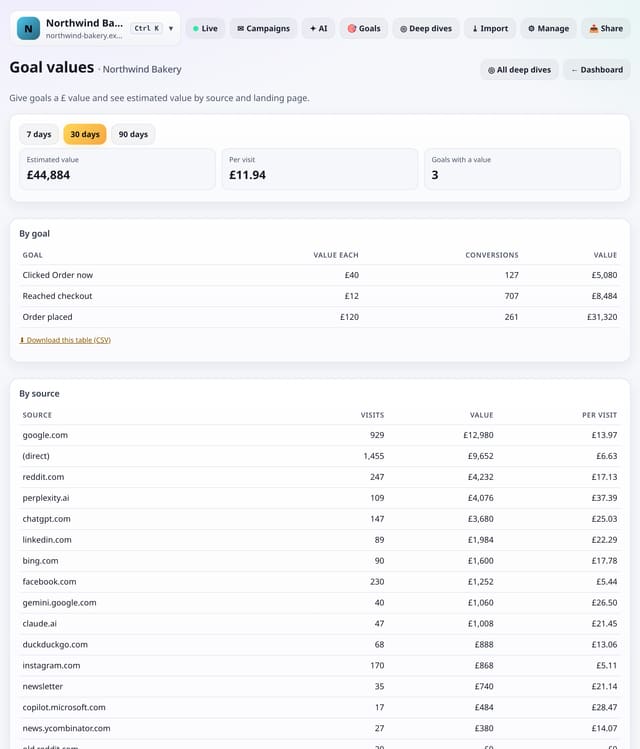
Give each goal a value (what an enquiry or signup is worth) and see estimated value by goal, source and landing page.
Why use it: Not every site takes payments, but every goal is worth something.
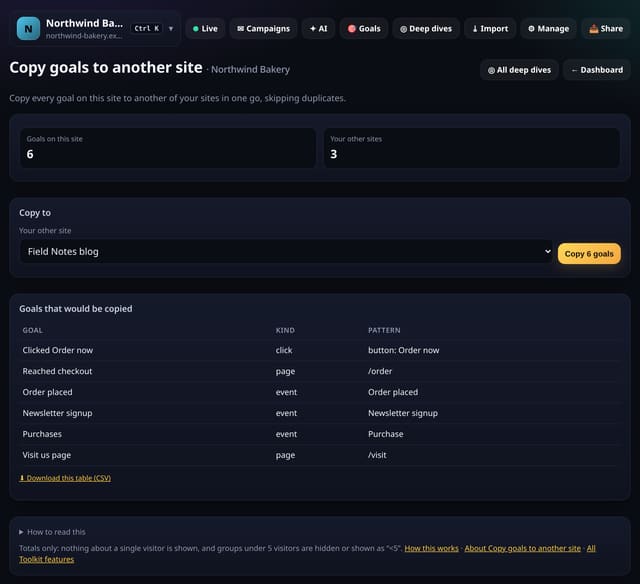
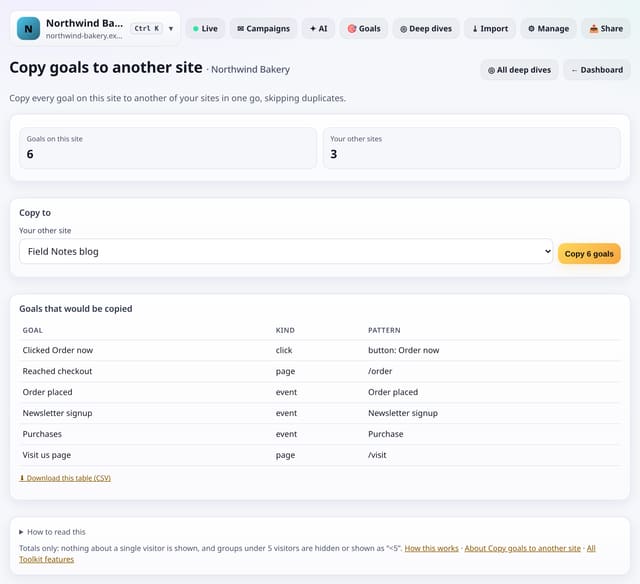
Copy every goal on this site to another of your sites, skipping any it already has.
Why use it: Agencies and people with several similar sites set up the same goals again and again.
About Copy goals to another siteHow to use it: Copy goals to another siteQS-414
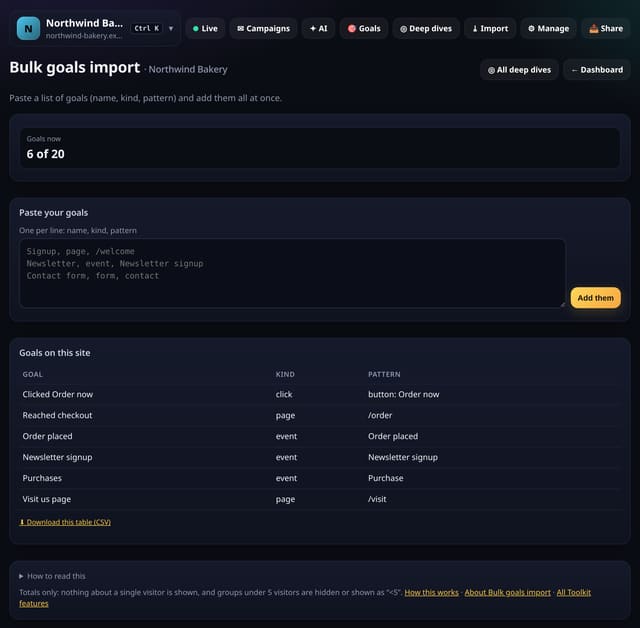
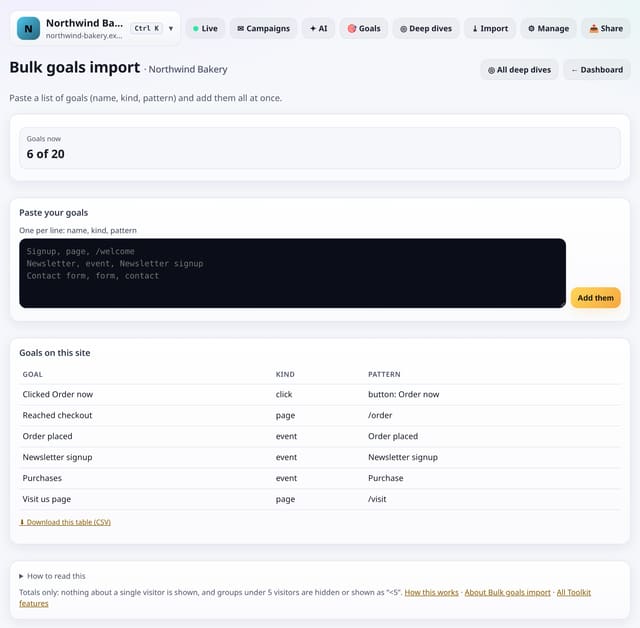
Paste goals as lines of “name, kind, pattern” and add them all at once.
Why use it: Setting up ten goals one by one is slow.
About Bulk goals importHow to use it: Bulk goals importQS-415
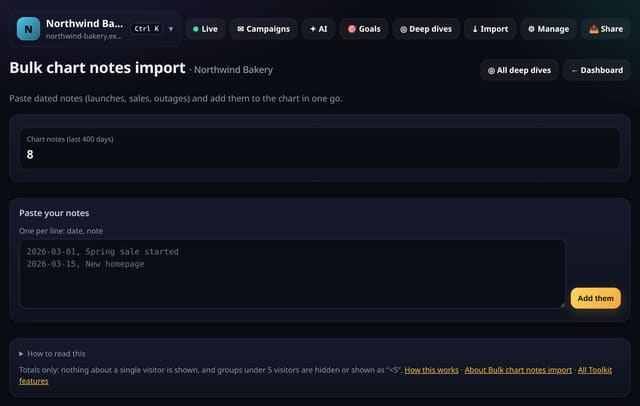
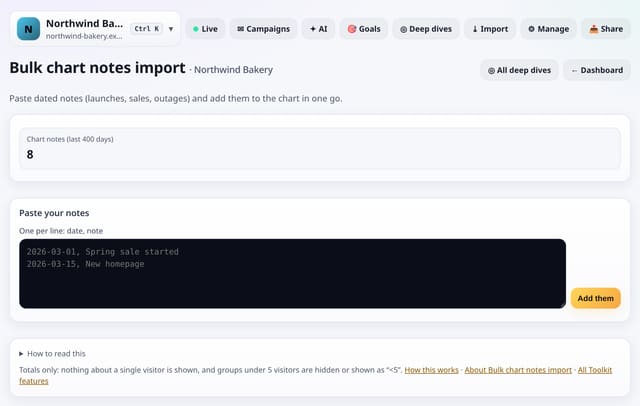
Paste lines like “2026-03-01, Spring sale started” and add them all to the chart at once.
Why use it: Your launch history lives in a spreadsheet or a project tool.
About Bulk chart notes importHow to use it: Bulk chart notes importQS-416
Pin the reports you open most so they sit at the top of the Toolkit.
Why use it: With more than 100 screens, the ones you use every week should not be three taps away.
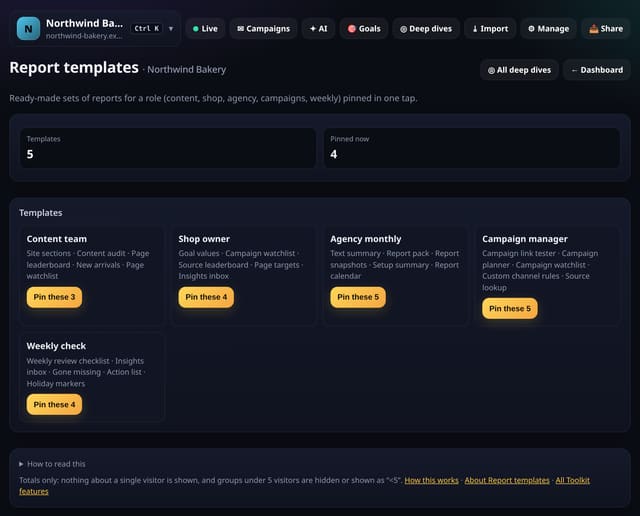
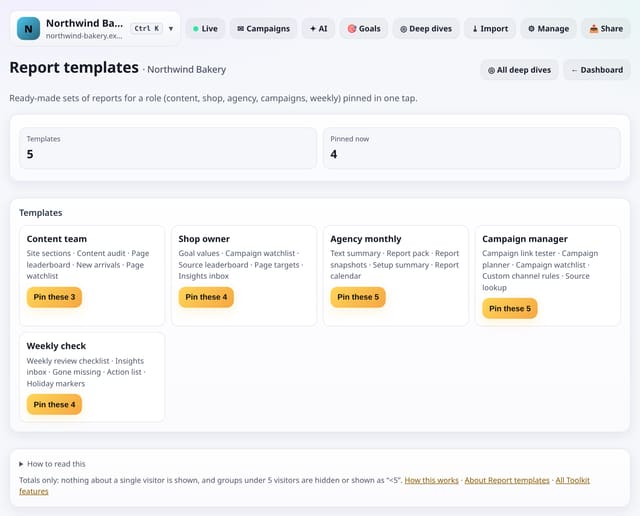
Pin a ready-made set of reports for a role: content team, shop owner, agency monthly, campaign manager or weekly check.
Why use it: Knowing where to start is the hardest part with a lot of reports.
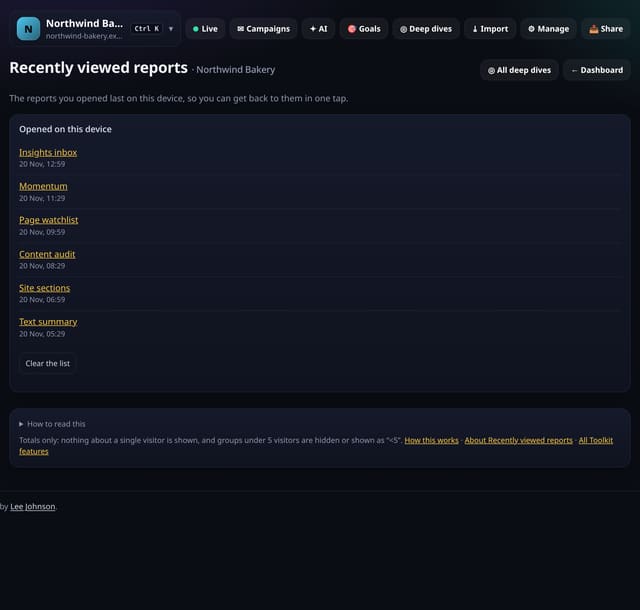
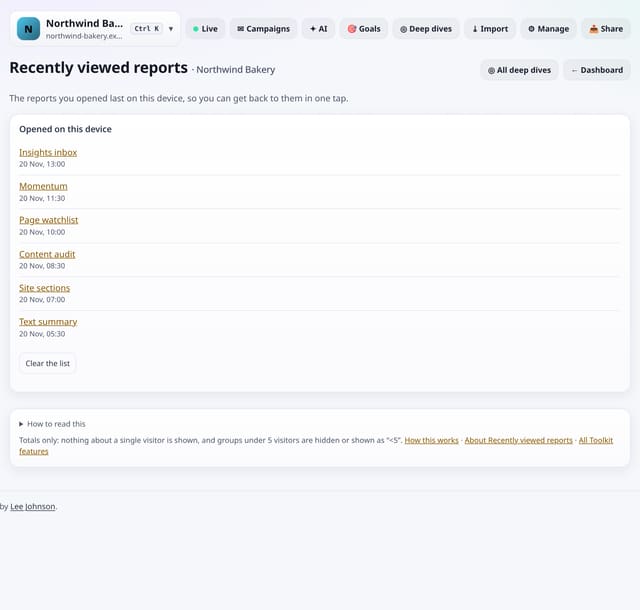
The reports you opened last on this device, newest first, so you can get back to them in one tap.
Why use it: You found a useful view yesterday and cannot remember where.
About Recently viewed reportsHow to use it: Recently viewed reportsQS-419
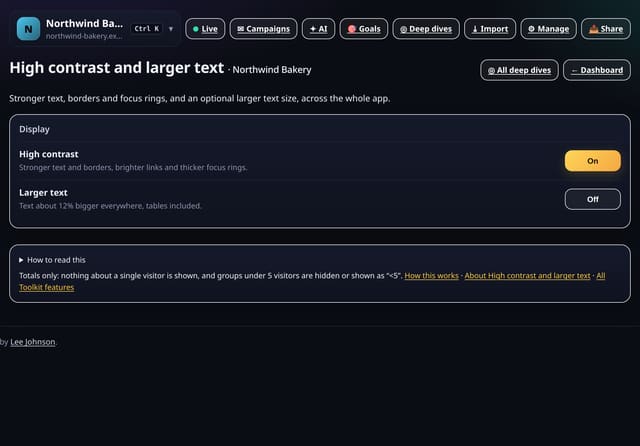
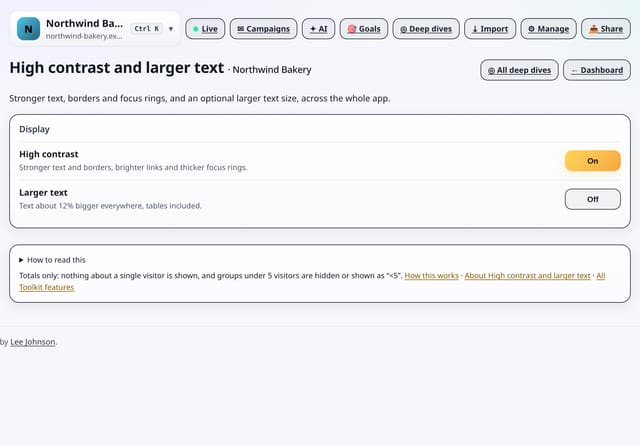
Turn on stronger text, borders and focus rings, and optionally larger text, across the whole app.
Why use it: Small grey text is hard to read for many people, on bright screens or late at night.
About High contrast and larger textHow to use it: High contrast and larger textQS-420
Tighter cards, tables and headings so more fits on screen, across the whole app.
Why use it: People who live in their stats want density; people who glance want space.
Added in the afternoon. We checked what other privacy-friendly and mainstream analytics tools offer and built the useful parts that work without IP addresses, cookies or following anyone, plus new ideas no one else has: look-ups, merge rules, a publishing calendar, streaks, backups and more display options. The full side-by-side is on the feature comparison.
Each of these matches something another analytics tool has, rebuilt so it needs no IPs, cookies or visitor profiles. Session recordings, visitor profiles and cross-device tracking were left out on purpose.
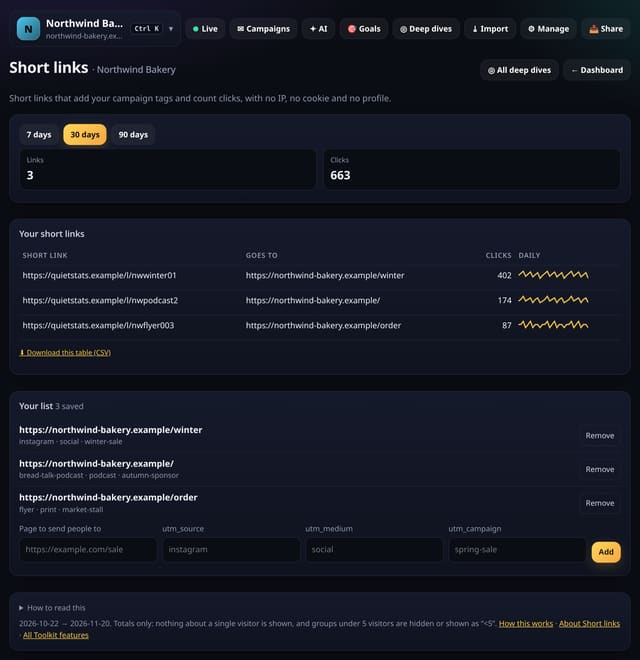
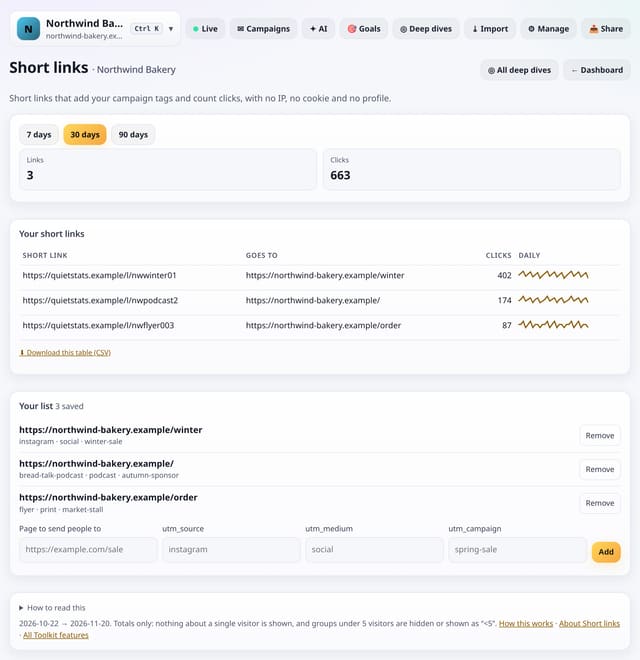
Make short links that add your campaign tags and count clicks per day: no IP address, no cookie, no profile.
Why use it: Links in print, podcasts and social bios are hard to tag by hand.
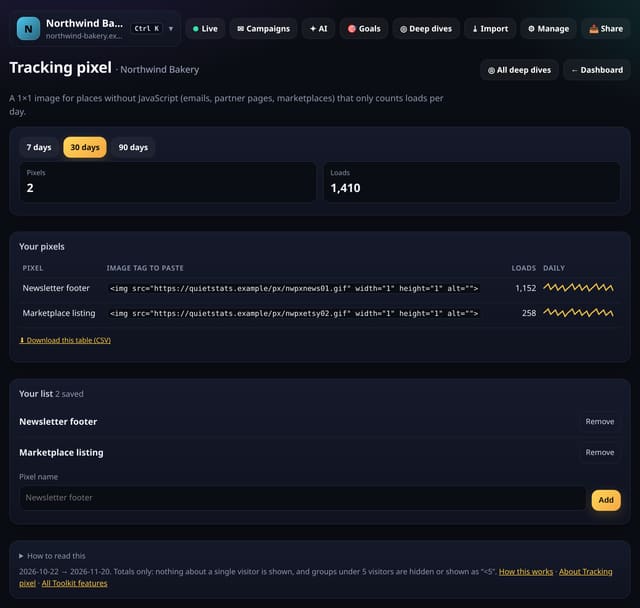
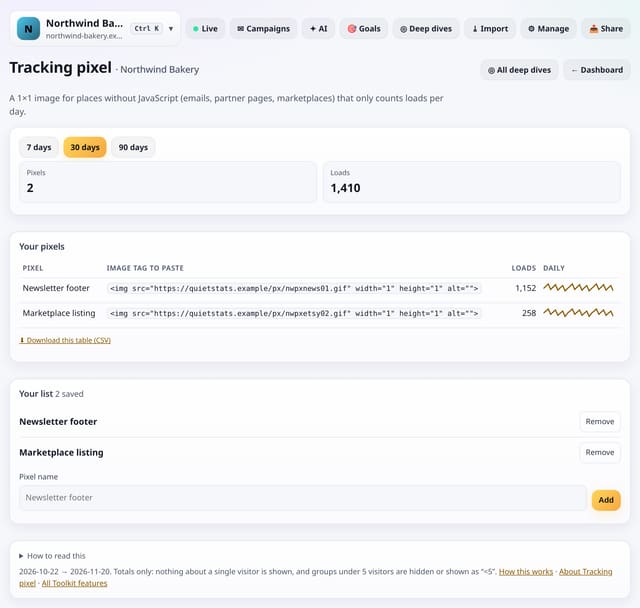
A 1×1 image you can put in emails, partner pages or marketplaces that only counts loads per day.
Why use it: Some places will not run your script: email newsletters, marketplace listings, a partner’s page.
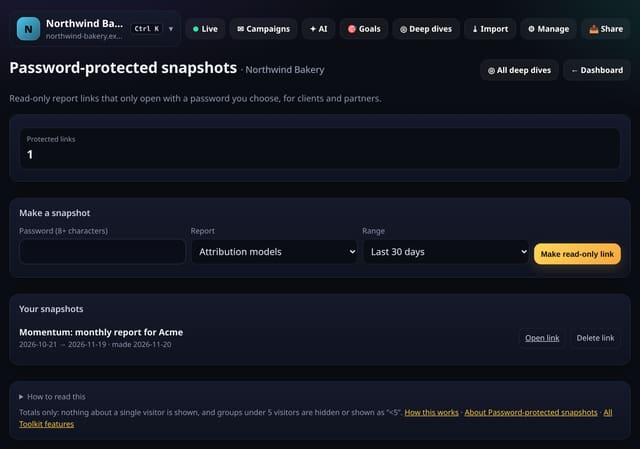
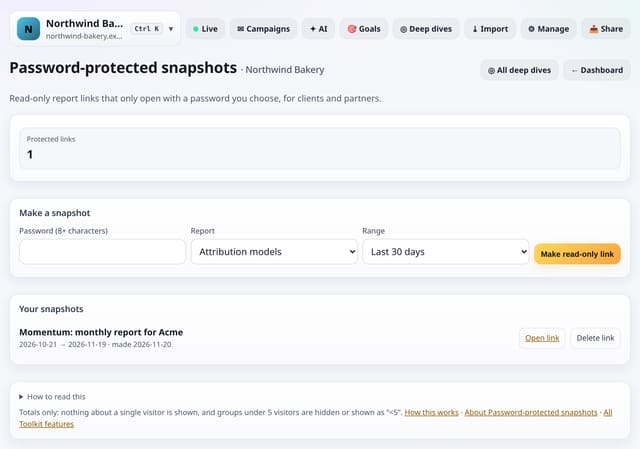
Share a read-only report snapshot that only opens with a password you choose.
Why use it: Sometimes a public link is too public.
About Password-protected snapshotsHow to use it: Password-protected snapshotsQS-428
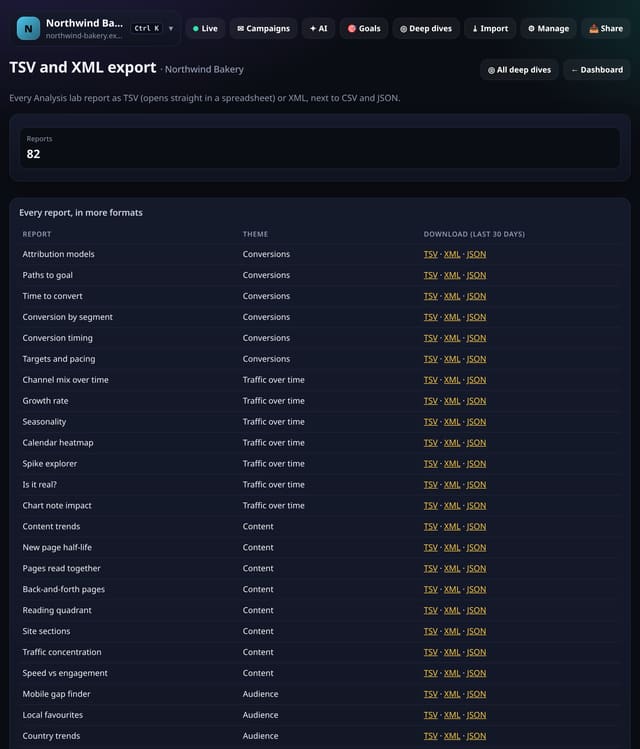
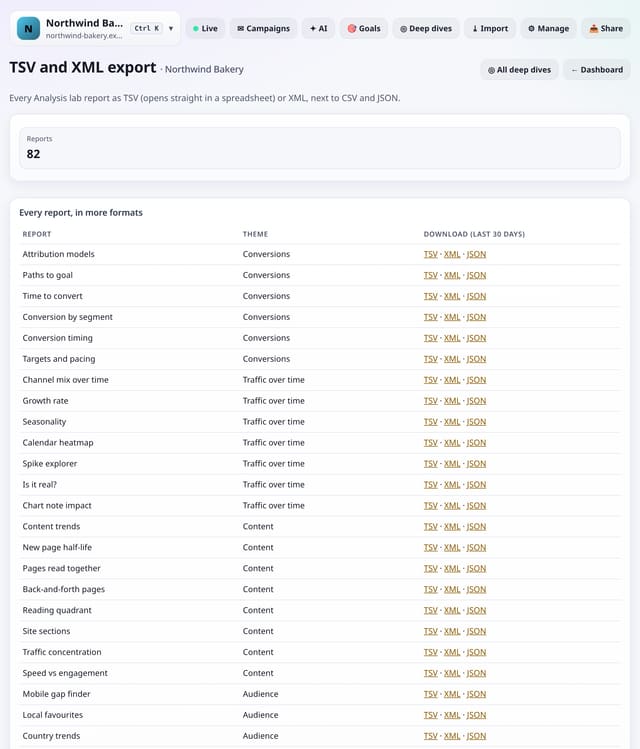
Download any Analysis lab report as TSV (opens straight in a spreadsheet) or XML, next to CSV and JSON.
Why use it: Some tools want tabs, some want XML.
About TSV and XML exportHow to use it: TSV and XML exportQS-433
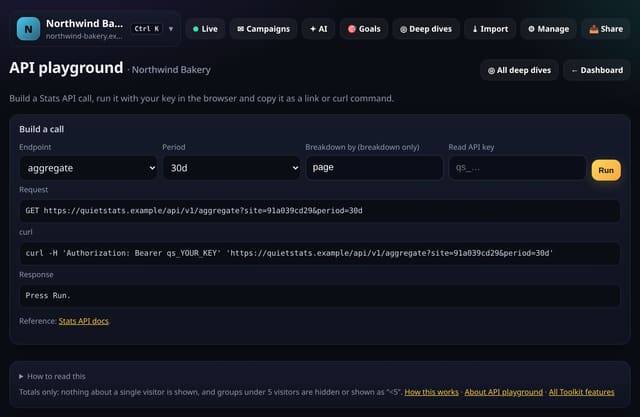
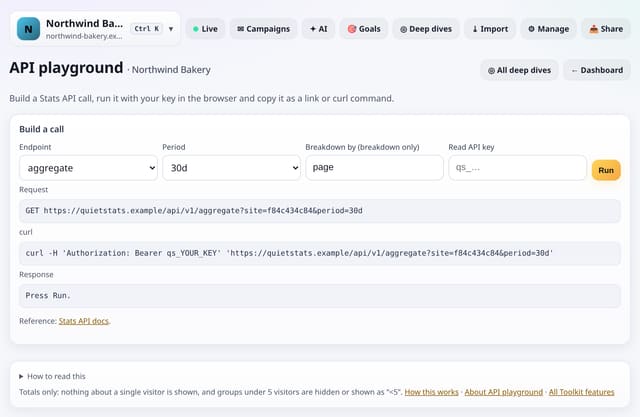
Build a Stats API call, run it with your key right in the browser and copy it as a link or curl command.
Why use it: APIs are easier to learn by trying them.
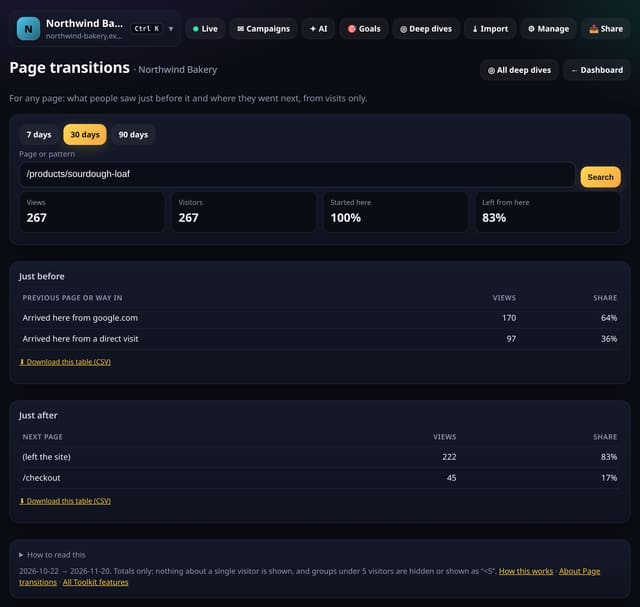
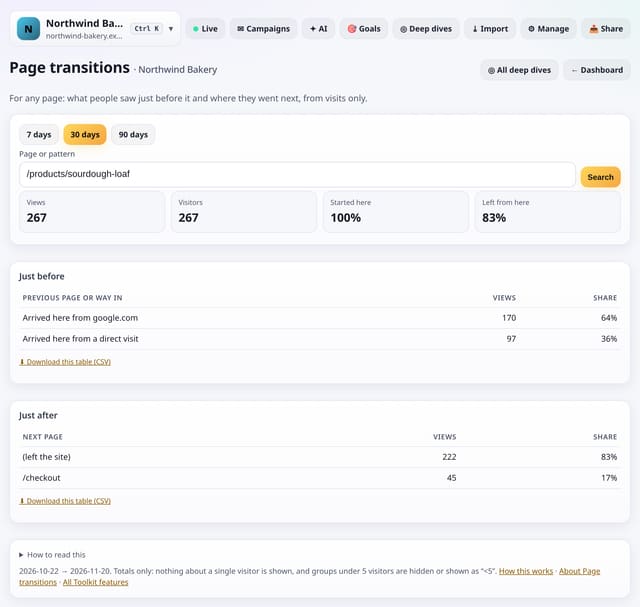
Type any page and see the pages and sources people came from just before it, and where they went next.
Why use it: Top pages tells you how busy a page is.
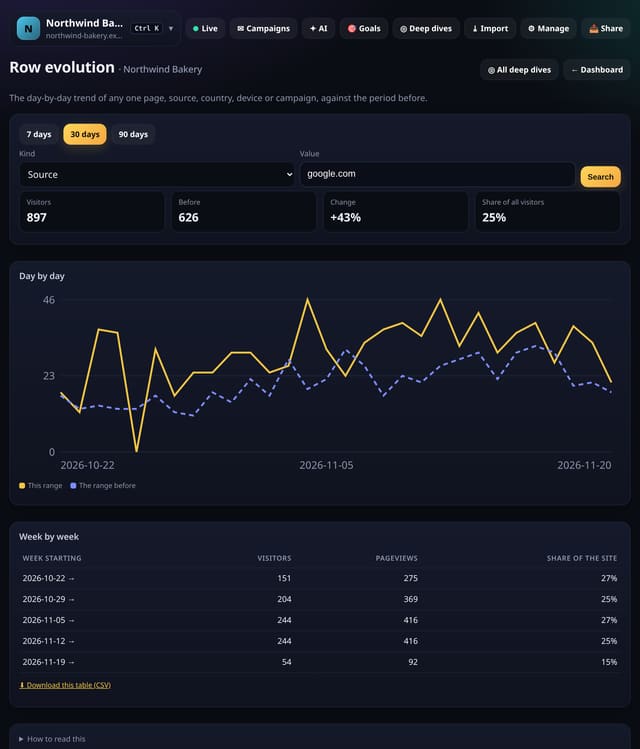
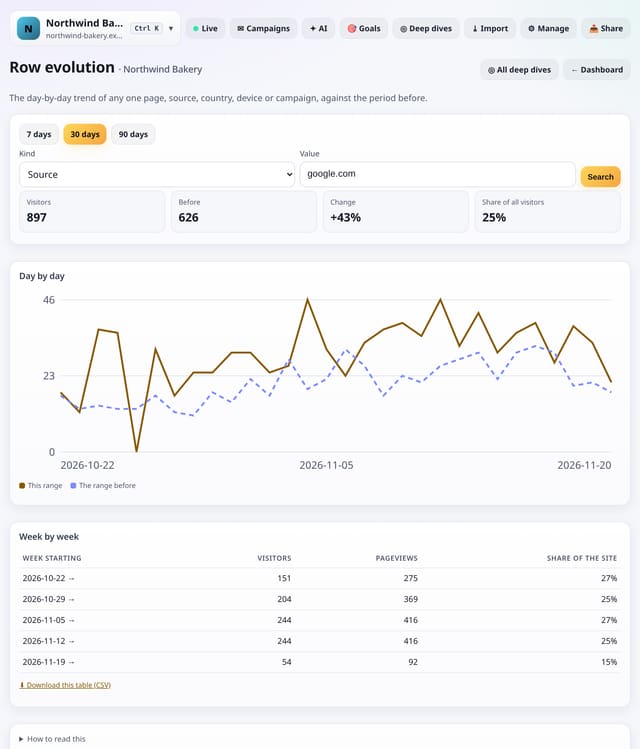
Pick one page, source, country, device or campaign and see its daily visitors against the period before.
Why use it: Totals hide what single rows do.
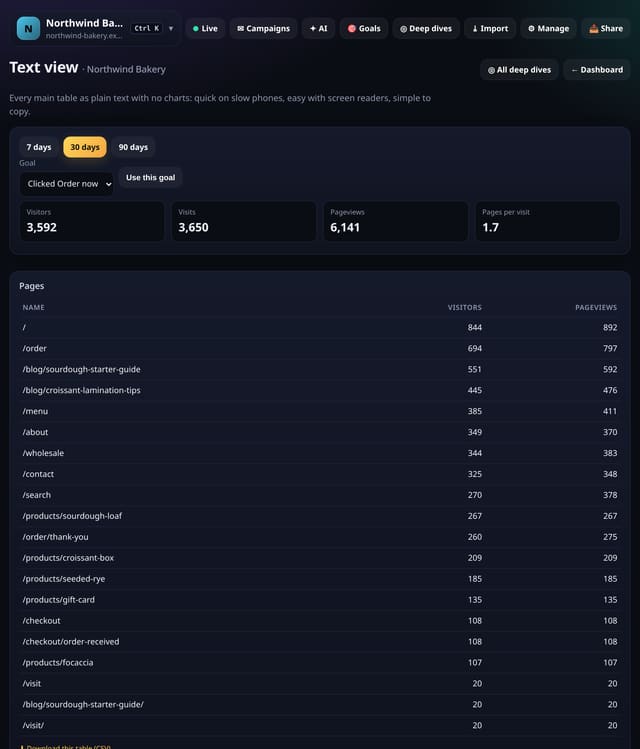
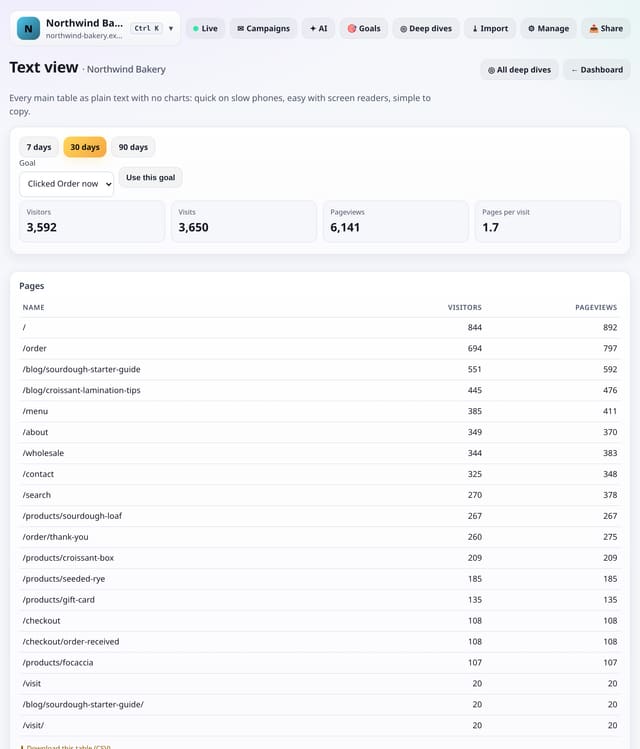
Every main table, with no charts or pictures: fast on a slow phone, easy with a screen reader and simple to copy.
Why use it: Charts are great until you are on a train with one bar of signal or using a screen reader.
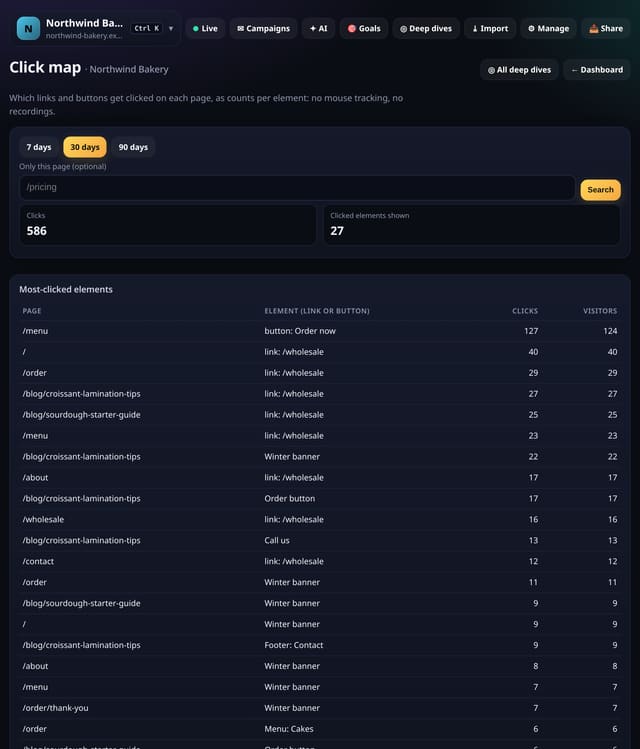
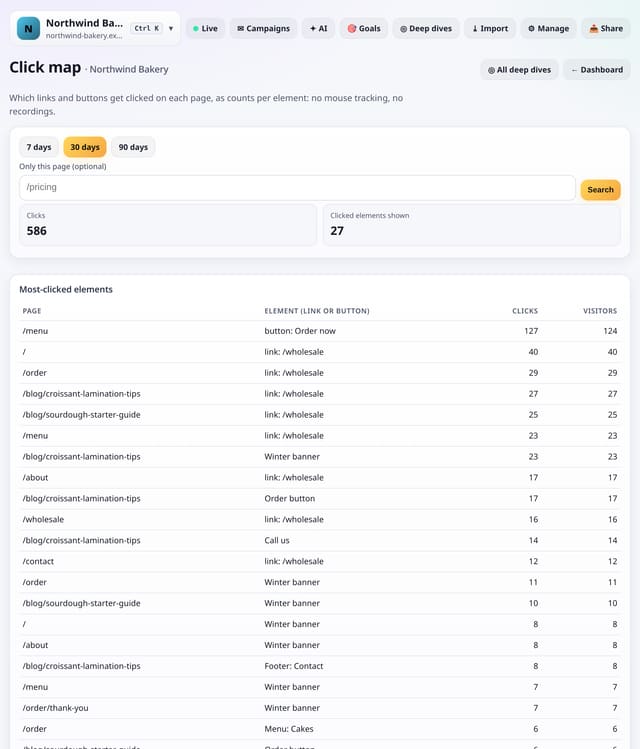
See which links and buttons get clicked on a page, as plain counts per element: no mouse tracking and no recordings.
Why use it: Heatmap tools record every mouse movement.
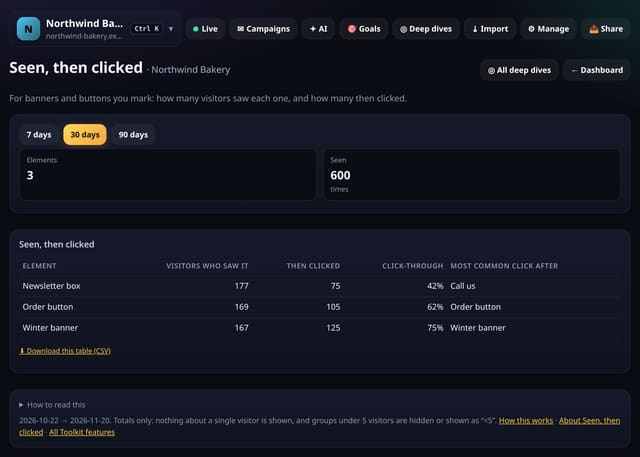
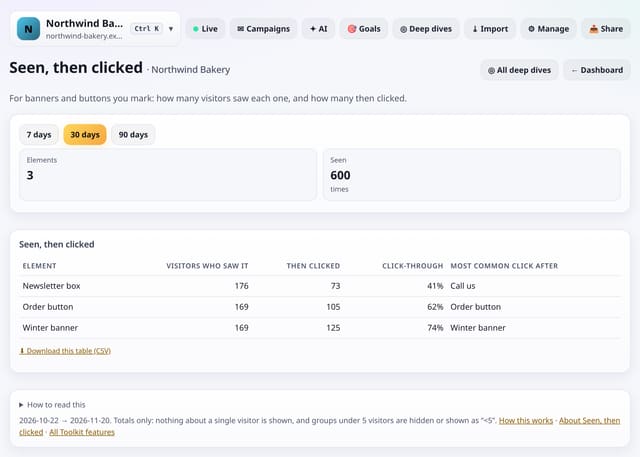
For each banner or button you mark: how many visitors saw it, how many clicked, and the click rate.
Why use it: A button that nobody clicks might be a bad button, or one nobody scrolls far enough to see.
About Seen, then clickedHow to use it: Seen, then clickedQS-432
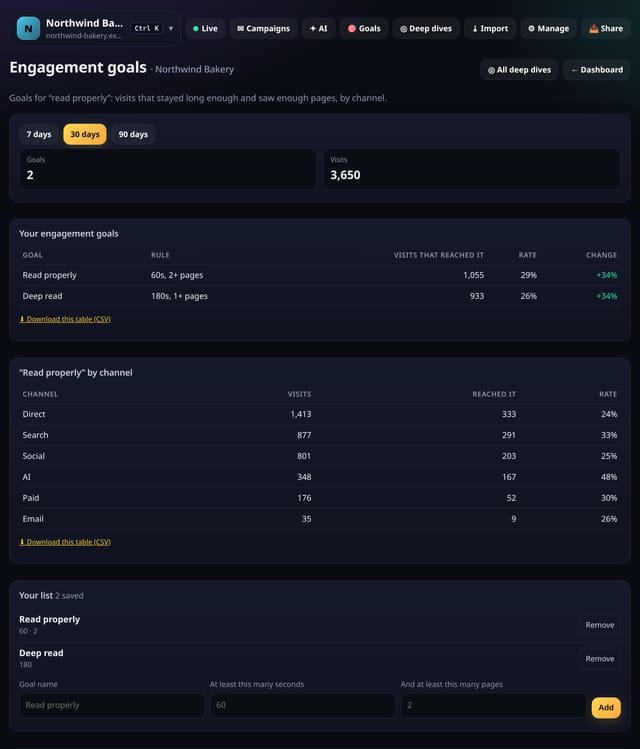
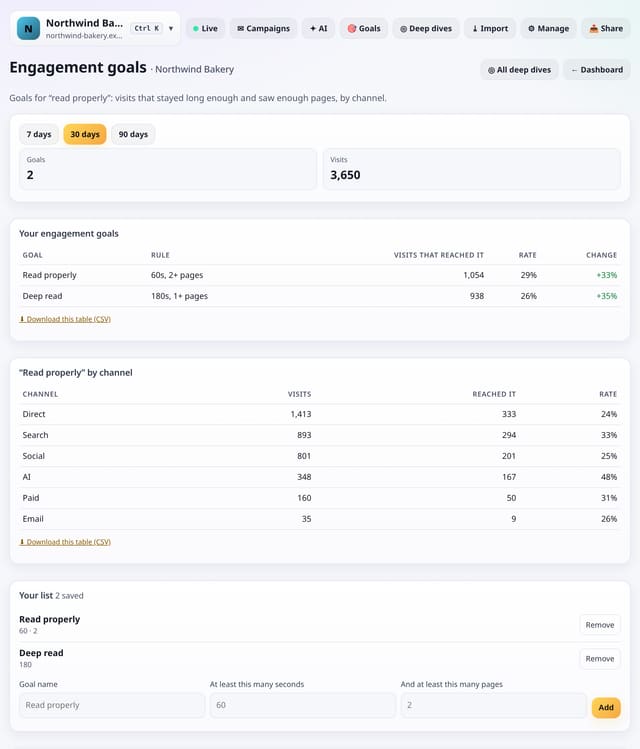
Set a goal for visits that stayed a while or saw enough pages, and see the rate by channel.
Why use it: Not every site has a sign-up.
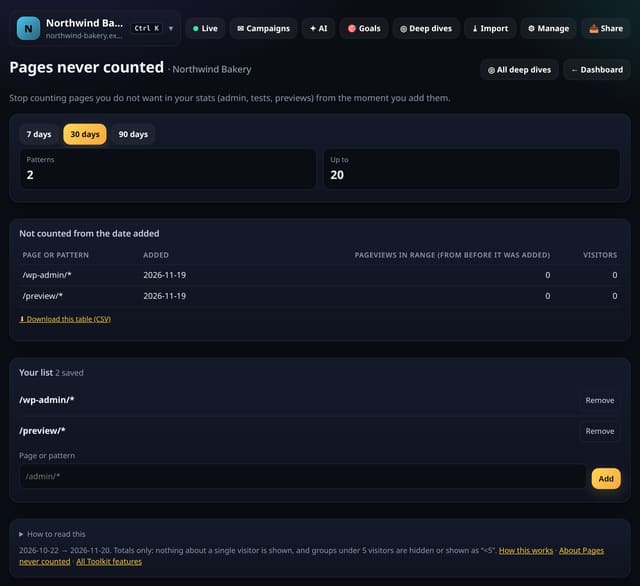
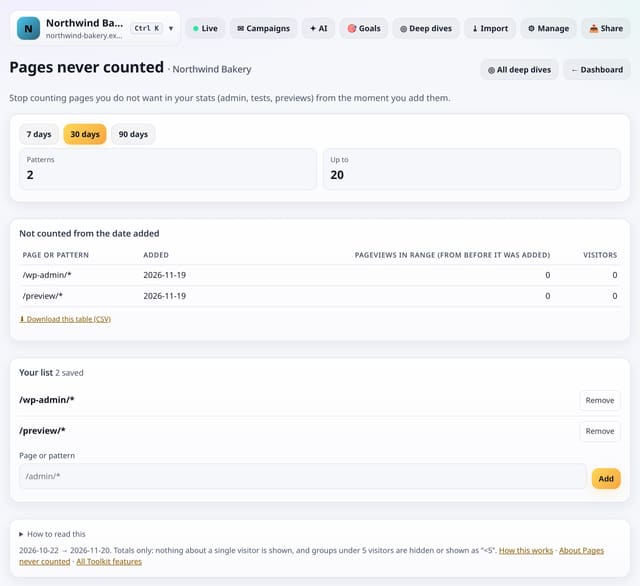
Stop counting pages you do not want in your stats (admin, test or preview pages) from the moment you add them.
Why use it: Admin screens and test pages make your numbers look busier than they are.
About Pages never countedHow to use it: Pages never countedQS-434
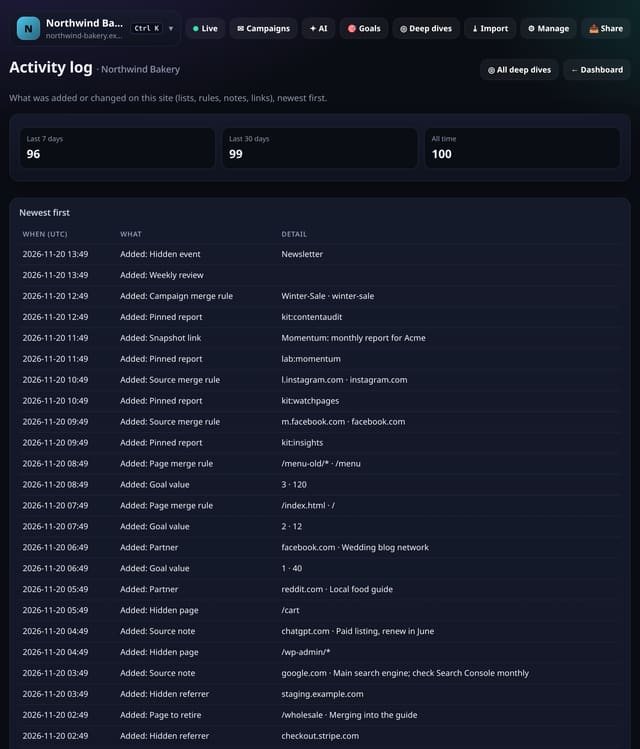
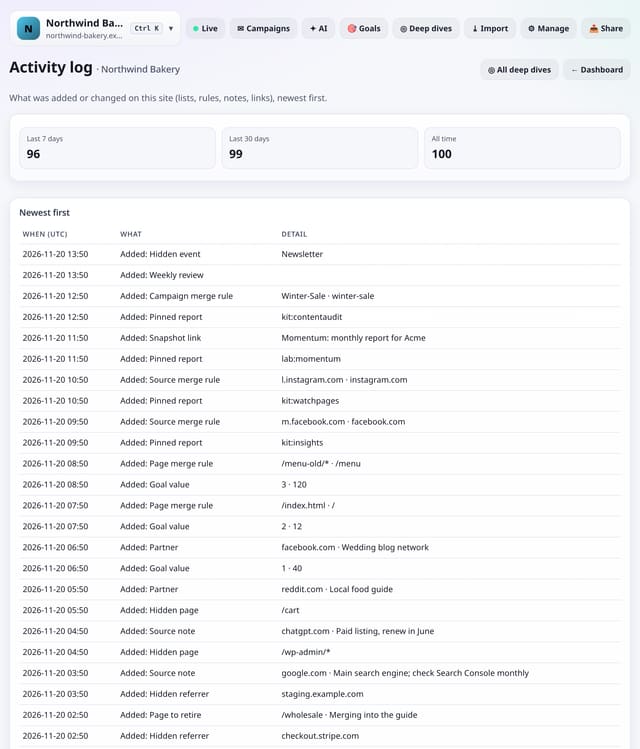
A list of the Toolkit lists, rules, plans and links added or changed on this site, newest first.
Why use it: When a number moves, the first question is often “did someone change a setting?”.
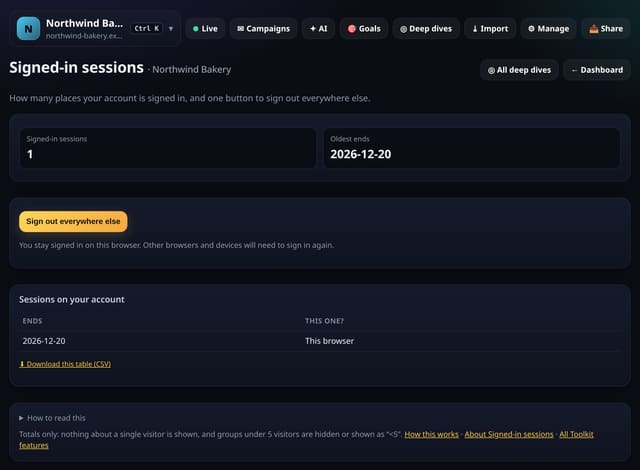
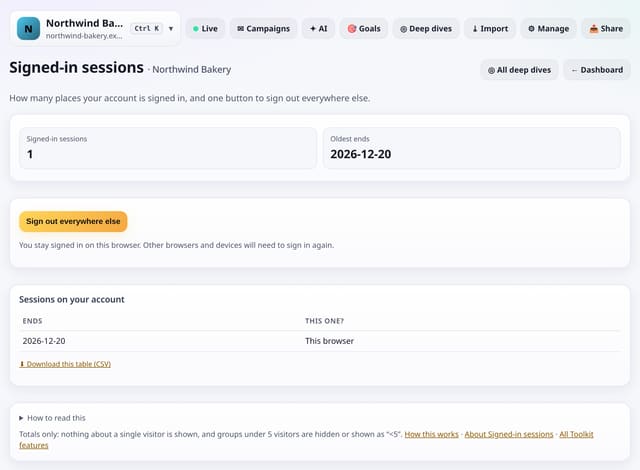
See how many places your account is signed in, and sign out of all of them except this one.
Why use it: If you signed in on a shared computer or lost a phone, you can close those sessions straight away.
About Signed-in sessionsHow to use it: Signed-in sessionsQS-436
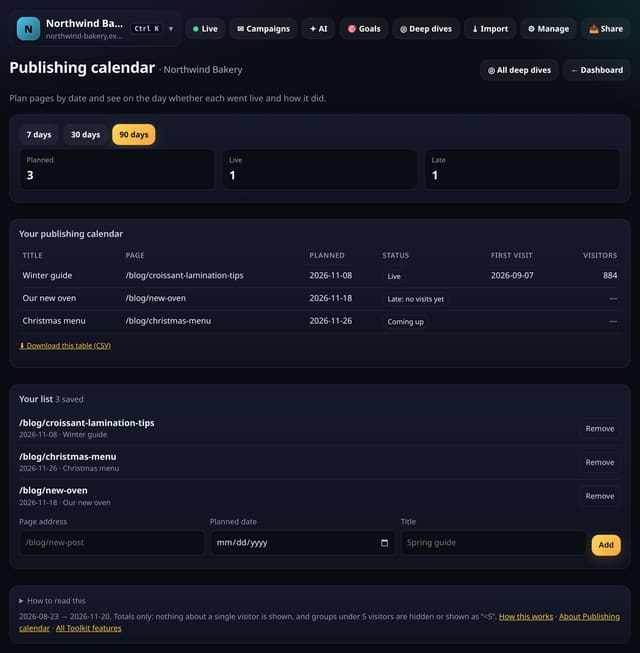
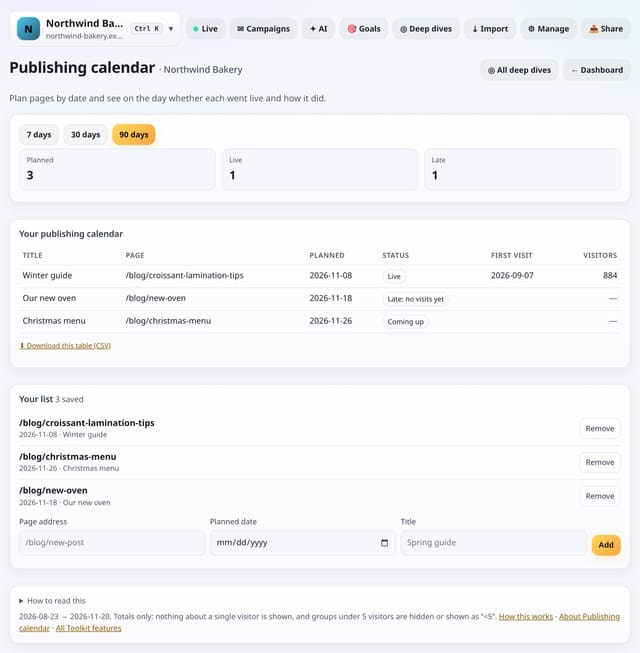
Plan pages by date, then see on the day whether each one went live and how many visitors it got.
Why use it: A content plan in a spreadsheet does not know what happened.
About Publishing calendarHow to use it: Publishing calendarQS-437
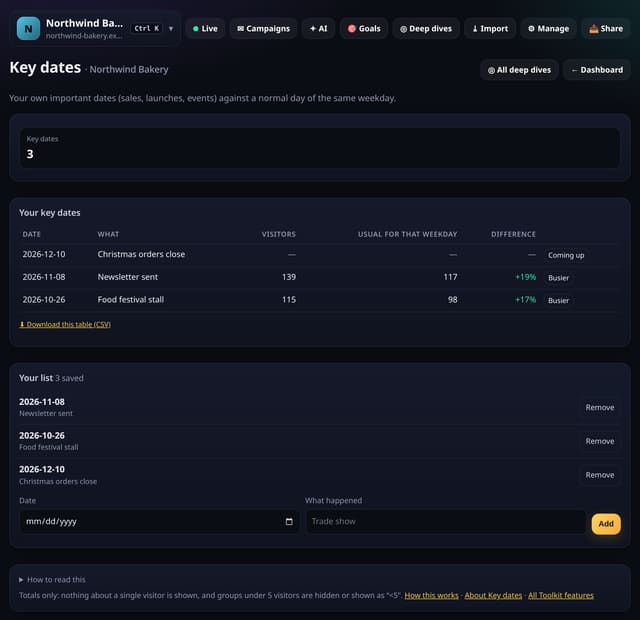
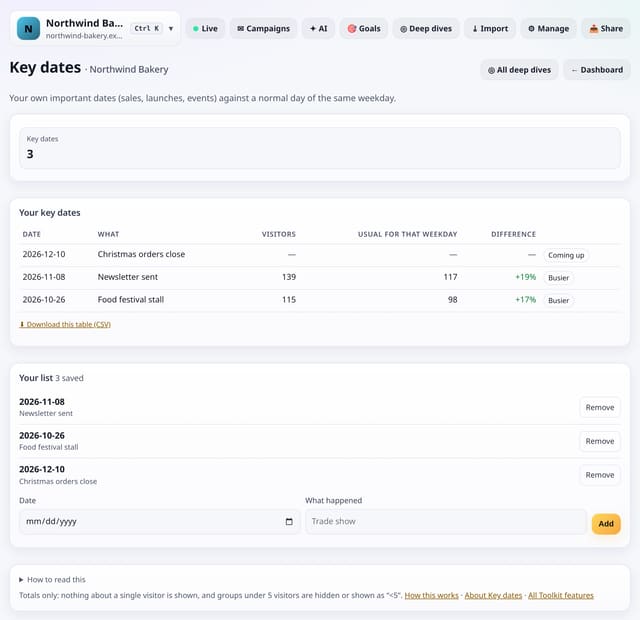
Save your important dates (sales, launches, events) and see each one’s visitors against a normal day of the same weekday.
Why use it: A launch day always looks big.
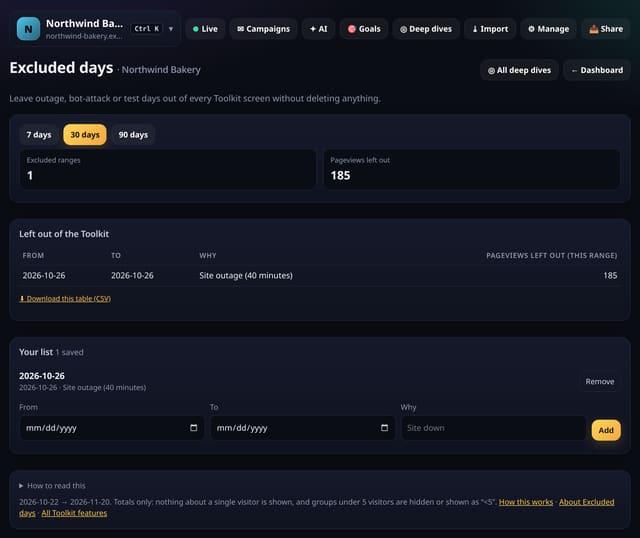
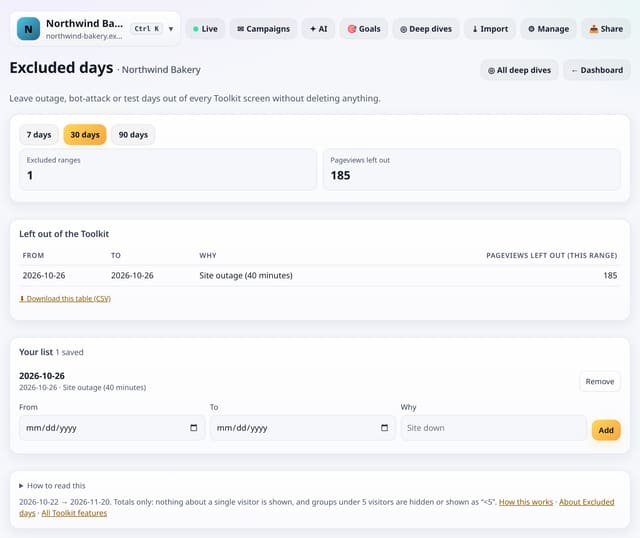
Leave outage, bot-attack or test days out of every Toolkit screen, without deleting any data.
Why use it: One bad day can spoil a month’s averages.
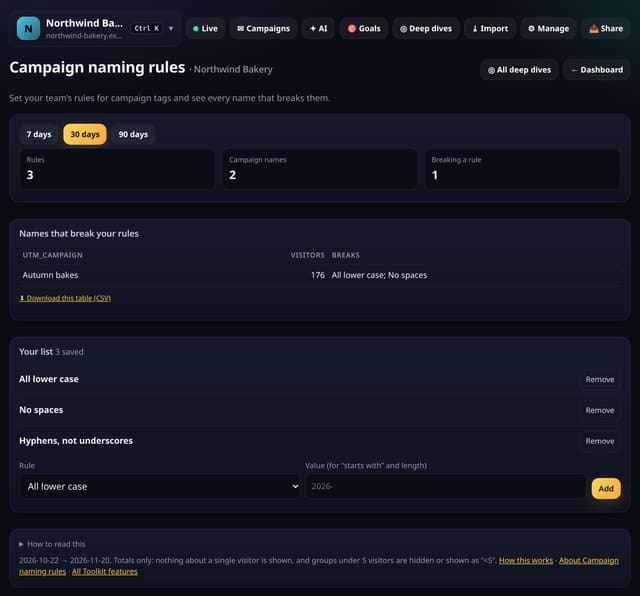
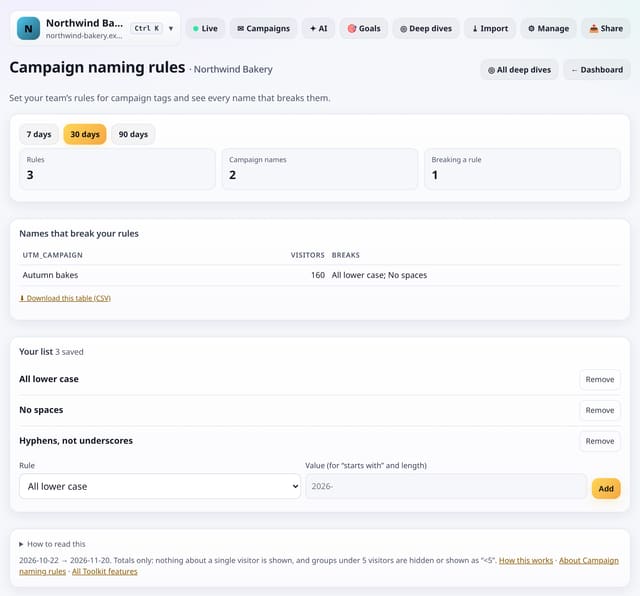
Set your team’s rules for campaign tags and see every campaign name that breaks them.
Why use it: One person types Spring-Sale and another spring_sale, and your report splits in two.
About Campaign naming rulesHow to use it: Campaign naming rulesQS-440
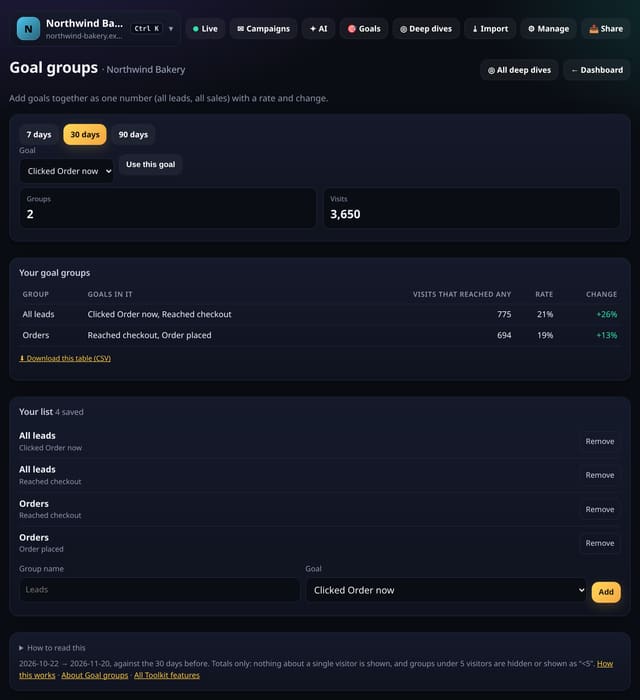
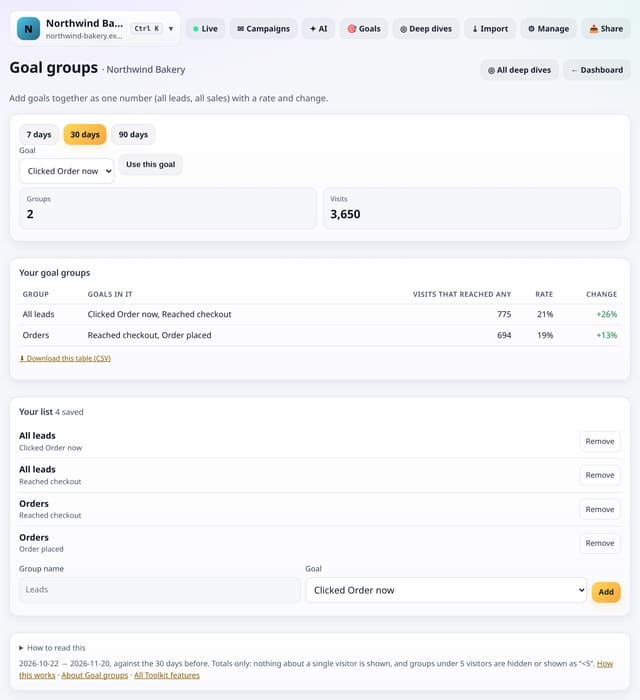
Group goals (all leads, all sales) and see the group’s conversions, rate and change as one figure.
Why use it: You might have five different lead forms.
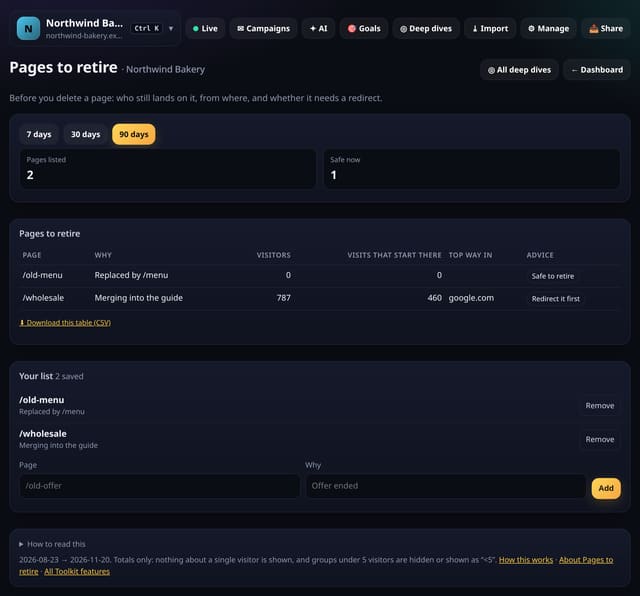
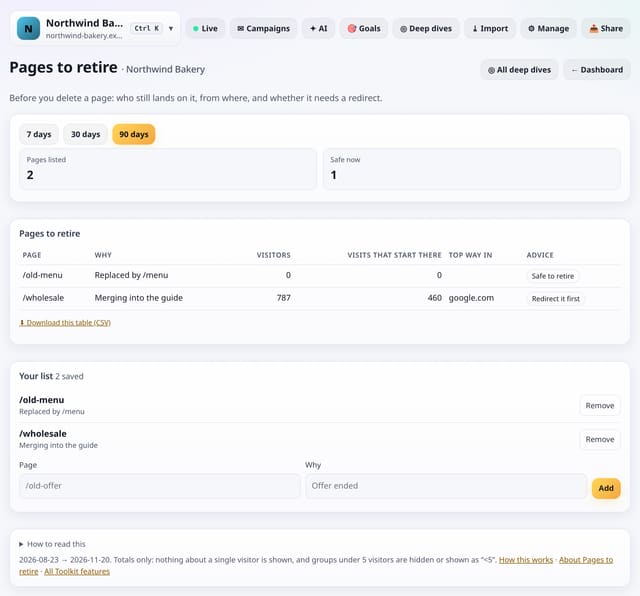
Before you delete a page: who still lands on it, from where, and whether it needs a redirect.
Why use it: Deleting a page that still gets search traffic loses visitors.
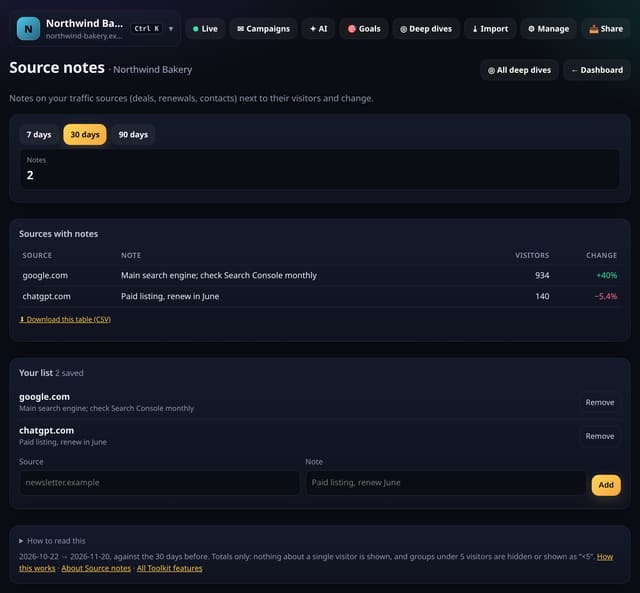
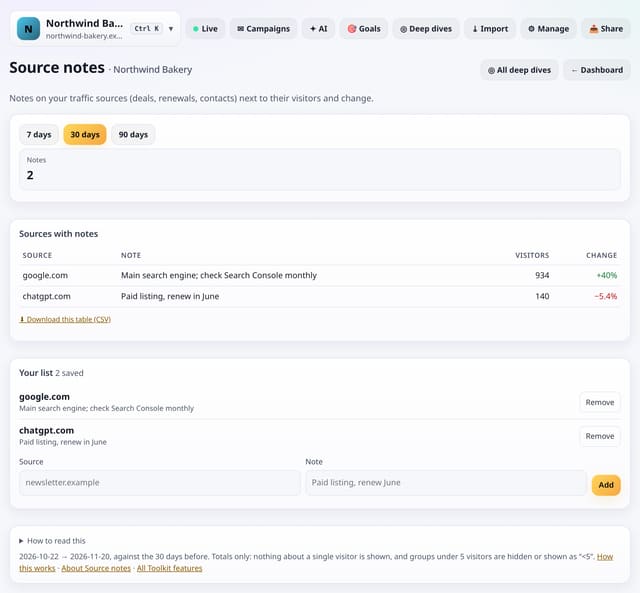
Keep notes on your sources (deals, renewals, contacts) next to their visitors and change.
Why use it: Context lives in people’s heads.
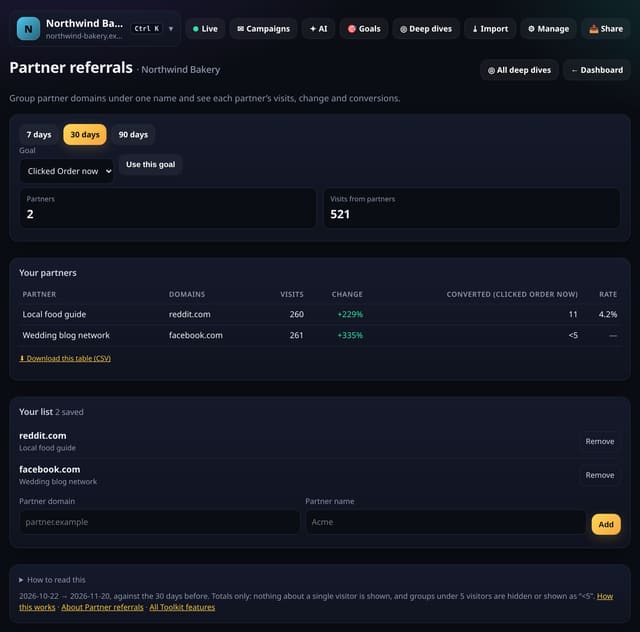
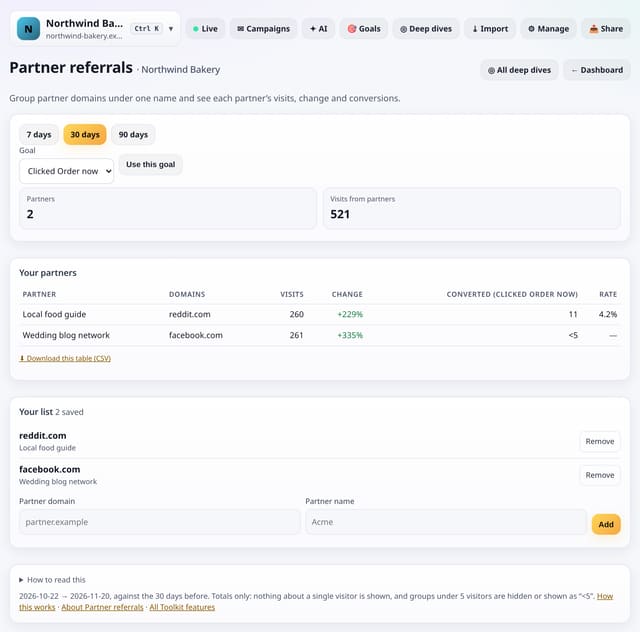
Group partner domains under one name and see each partner’s visits, change and conversions.
Why use it: Partners, affiliates and resellers often use several sites.
About Partner referralsHow to use it: Partner referralsQS-444
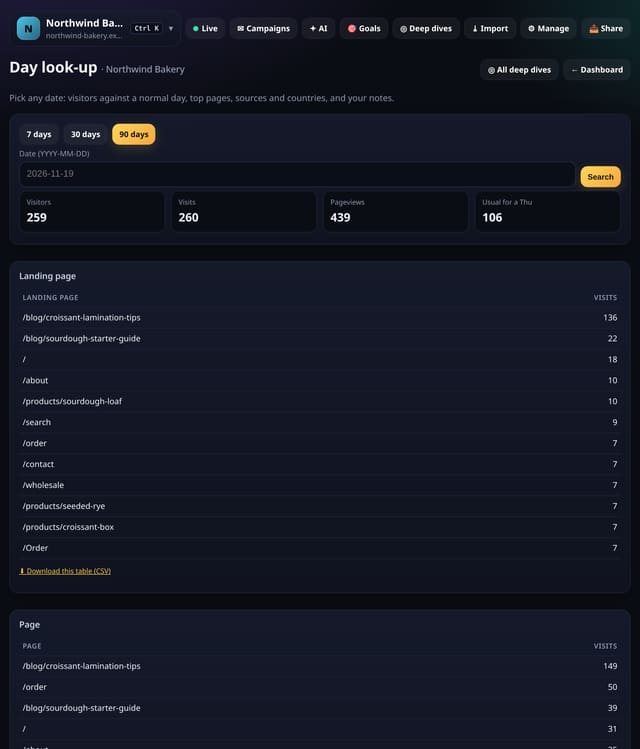
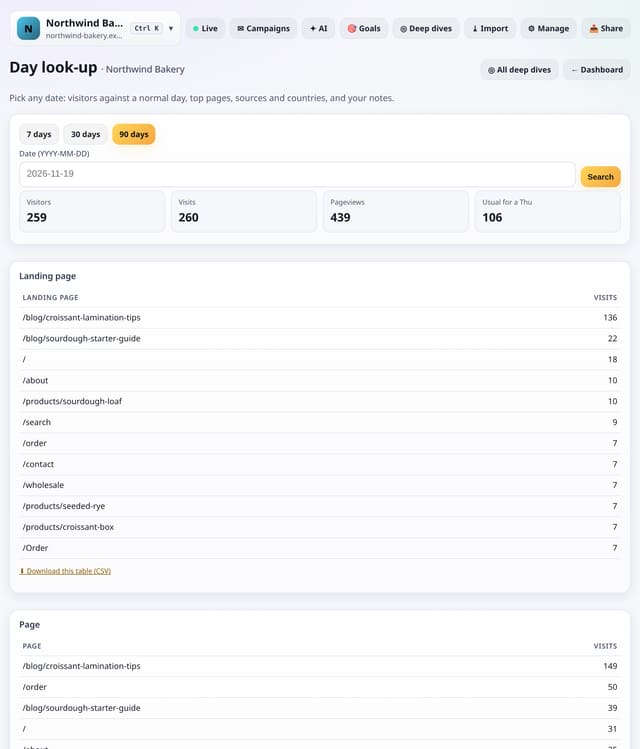
Pick any date and see its visitors against a normal day, its top pages, sources and countries, and your notes.
Why use it: When someone asks “what happened on the 3rd?”, this is the one screen that answers it.
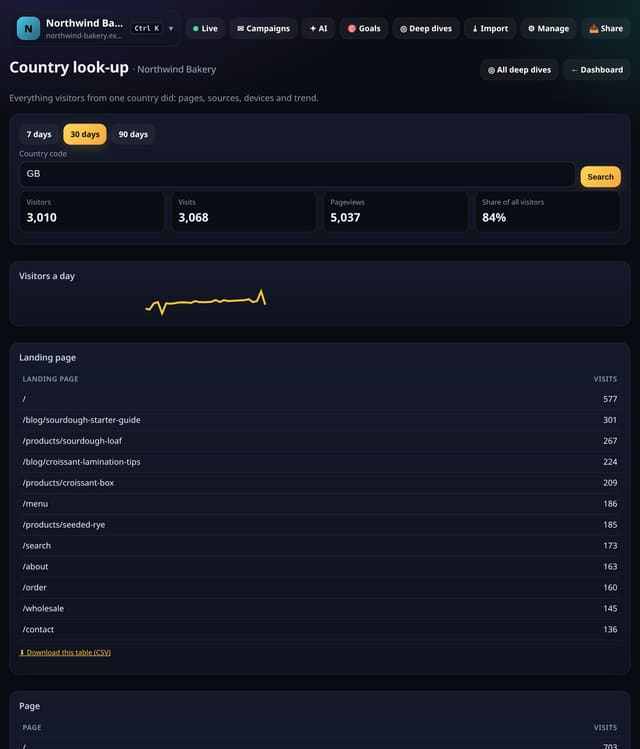
Everything visitors from one country did: pages, sources, devices and a daily trend.
Why use it: Countries matter for shipping, languages and ads.
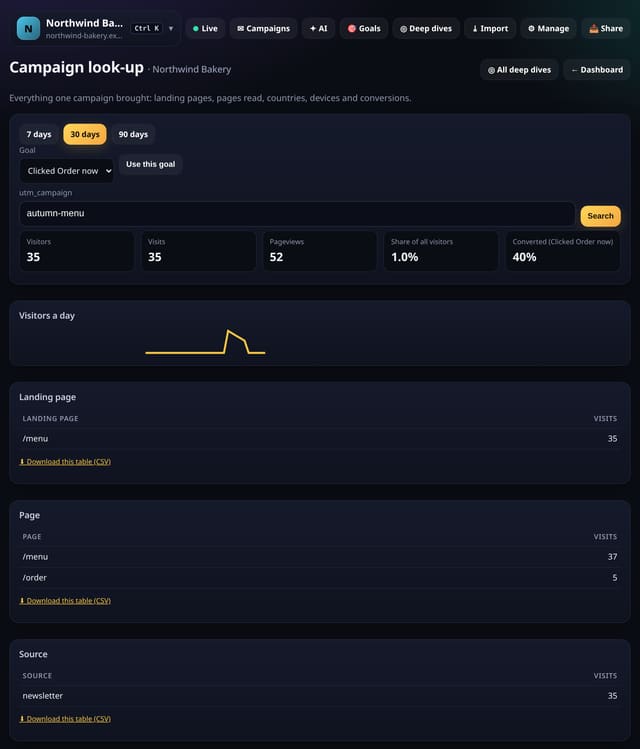
Everything one campaign brought: landing pages, pages read, countries, devices and, with a goal picked, conversions.
Why use it: A campaign report usually stops at visitors.
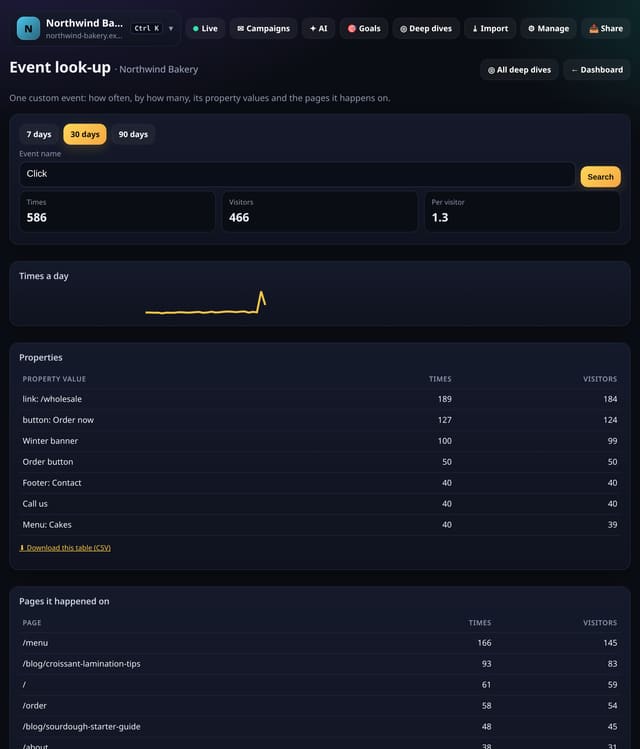
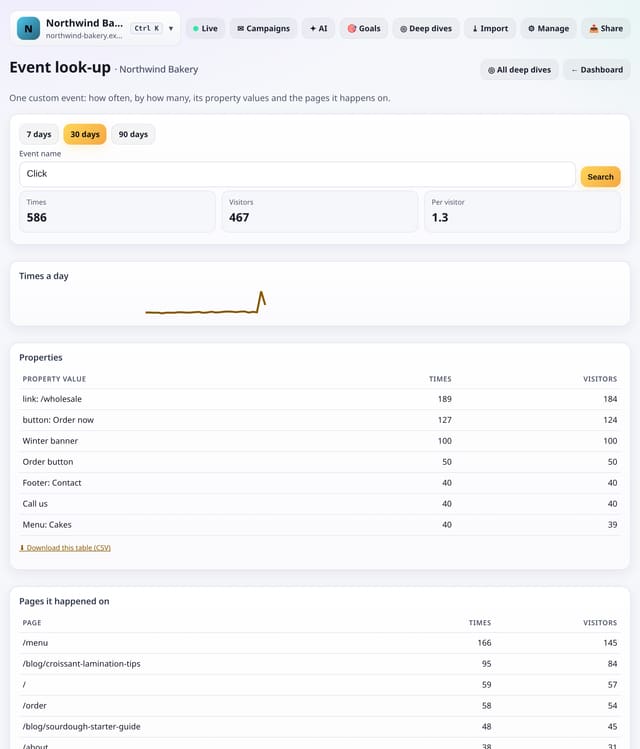
One custom event: how often it happens, for how many visitors, its property values and the pages it happens on.
Why use it: Custom events pile up.
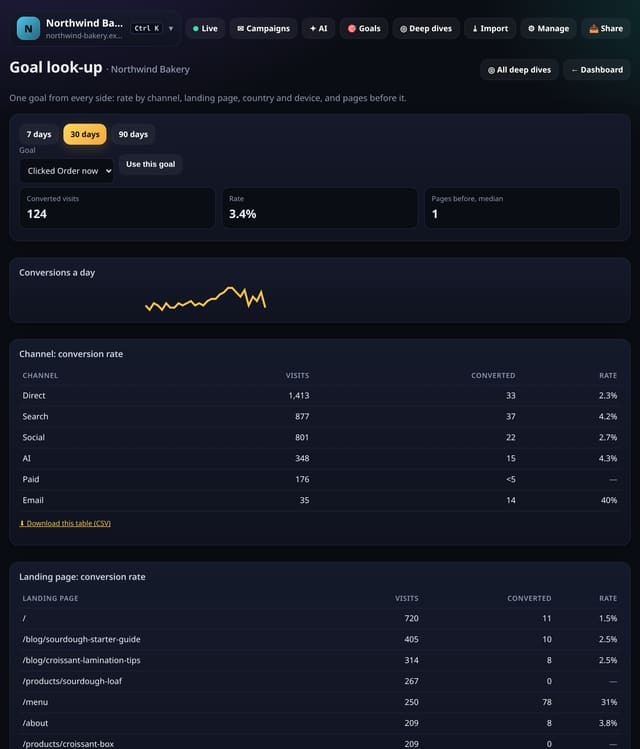
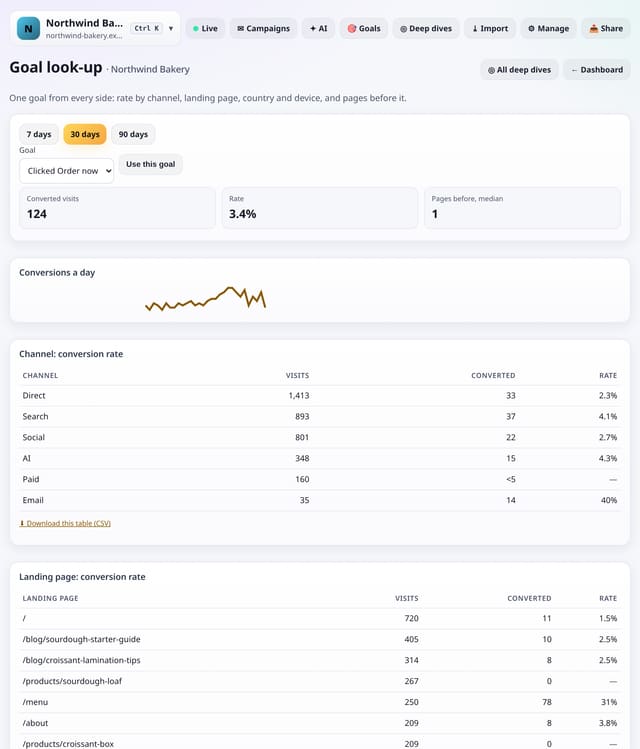
One goal from every side: the rate by channel, landing page, country and device, and how many pages came before it.
Why use it: A single conversion rate hides where it comes from.
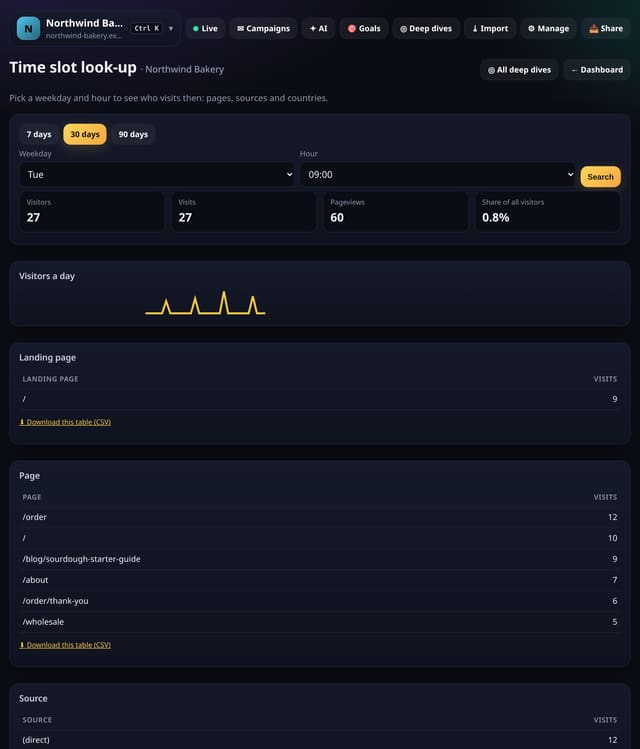
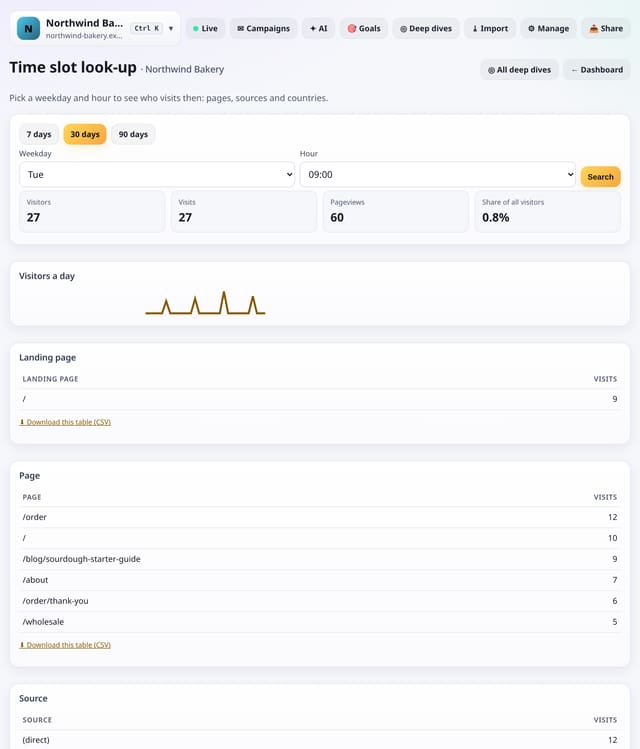
Pick a weekday and an hour to see who visits then: pages, sources and countries, against the rest of the week.
Why use it: Knowing that Tuesday at 9 is busy is useful.
About Time slot look-upHow to use it: Time slot look-upQS-450
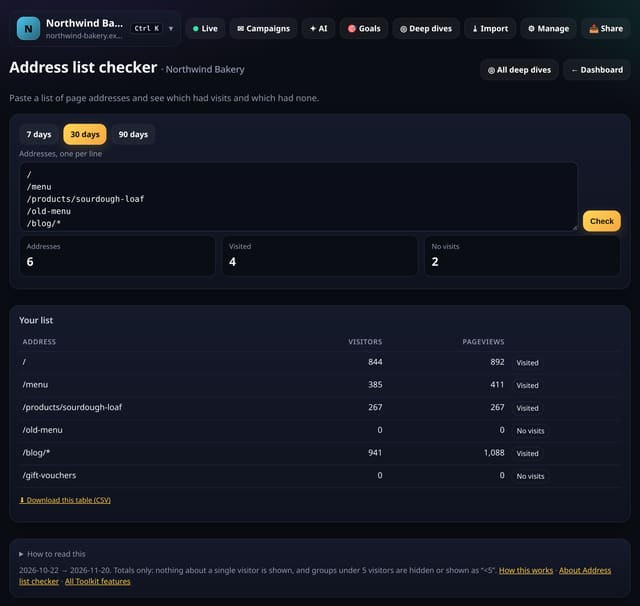
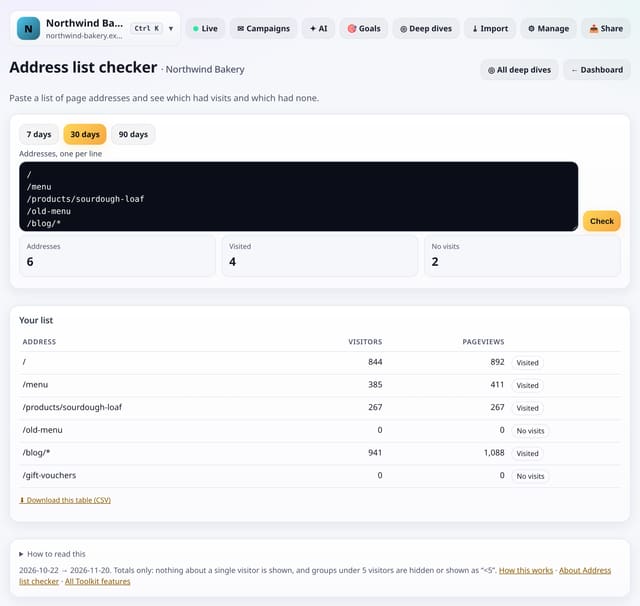
Paste a list of page addresses and see which had visits in the range and which had none.
Why use it: Sitemaps grow.
About Address list checkerHow to use it: Address list checkerQS-451
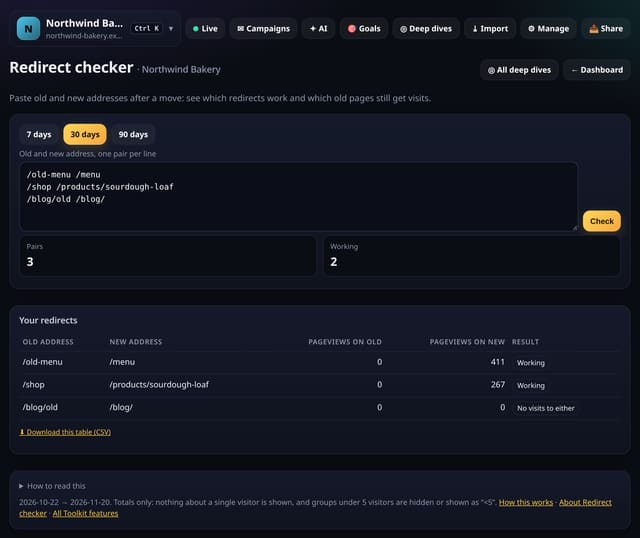
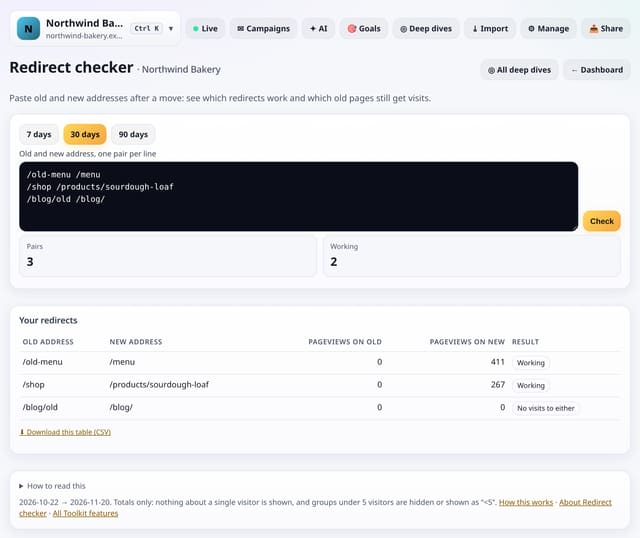
After moving pages, paste each old and new address and see which redirects work and which old pages still get visits.
Why use it: Site moves break things quietly.
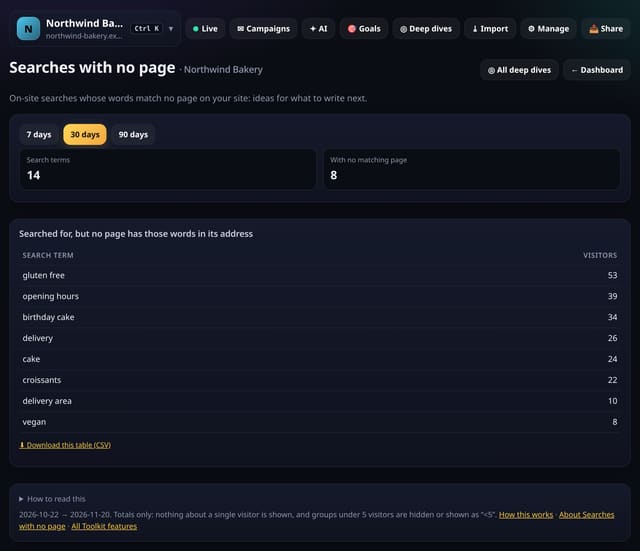
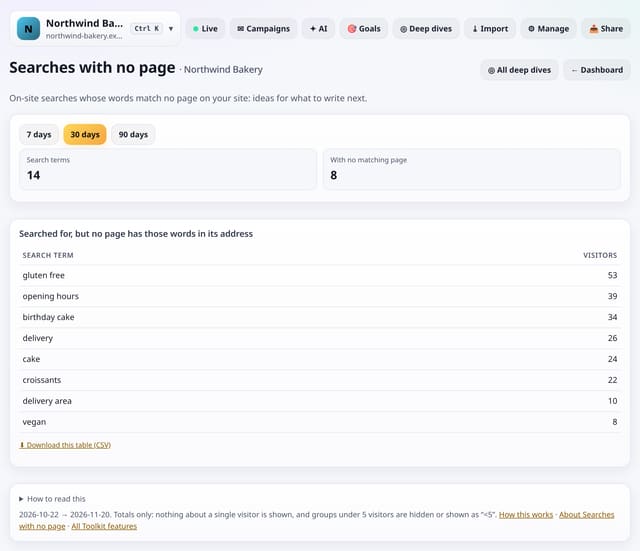
On-site searches whose words match no page address on your site: ideas for what to write next.
Why use it: People tell you what they are looking for when they search.
About Searches with no pageHow to use it: Searches with no pageQS-453
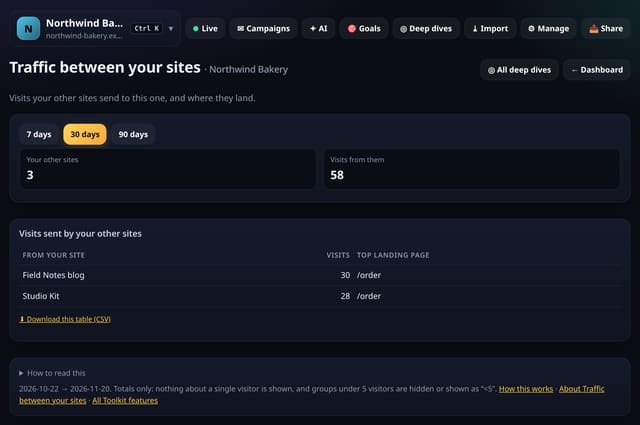
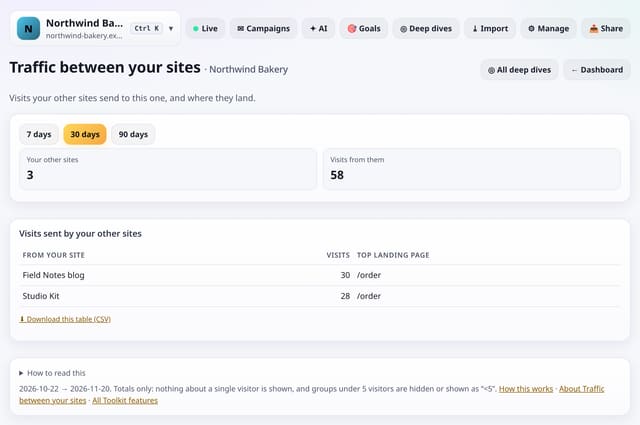
Visits your other quietstats sites send to this one, and the pages they land on.
Why use it: A blog, a shop and a help centre feed each other.
About Traffic between your sitesHow to use it: Traffic between your sitesQS-454
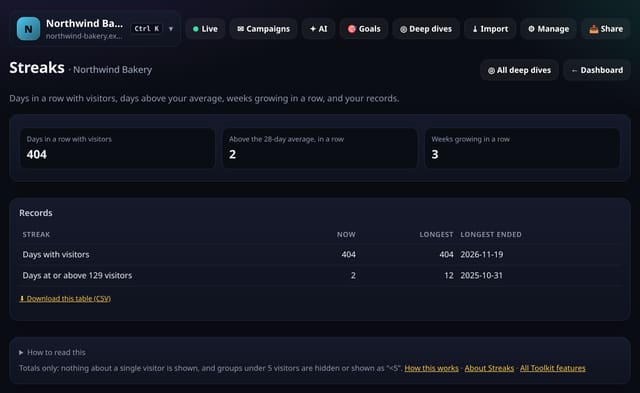
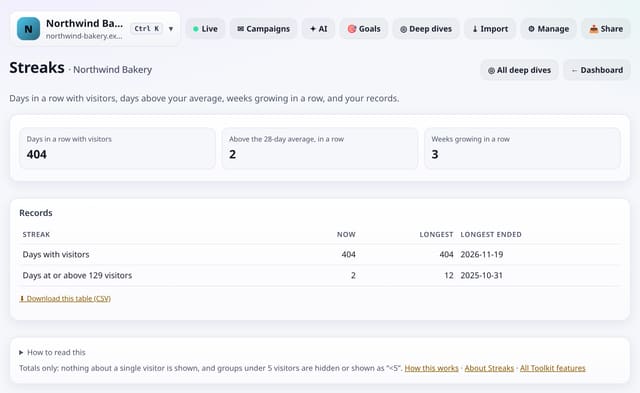
Days in a row with visitors, days above your average, weeks growing in a row, and your longest runs.
Why use it: Small wins keep you going.
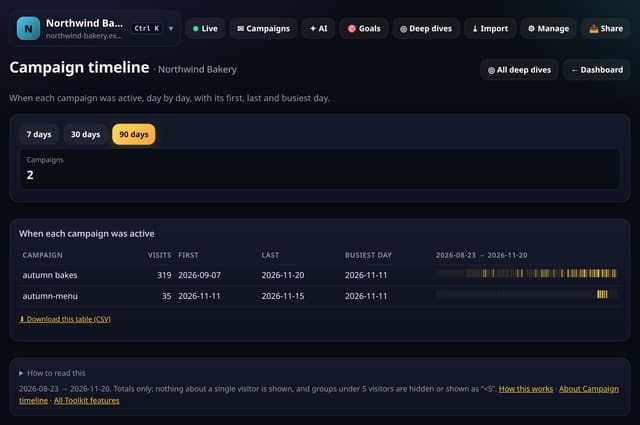
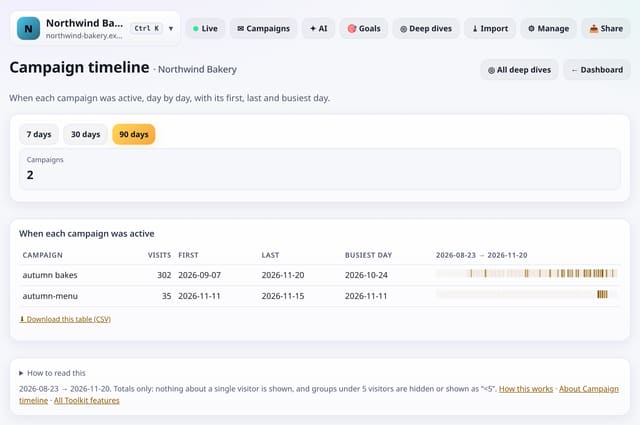
When each campaign brought visits, day by day, with its first, last and busiest day.
Why use it: Campaigns overlap and linger.
About Campaign timelineHow to use it: Campaign timelineQS-456
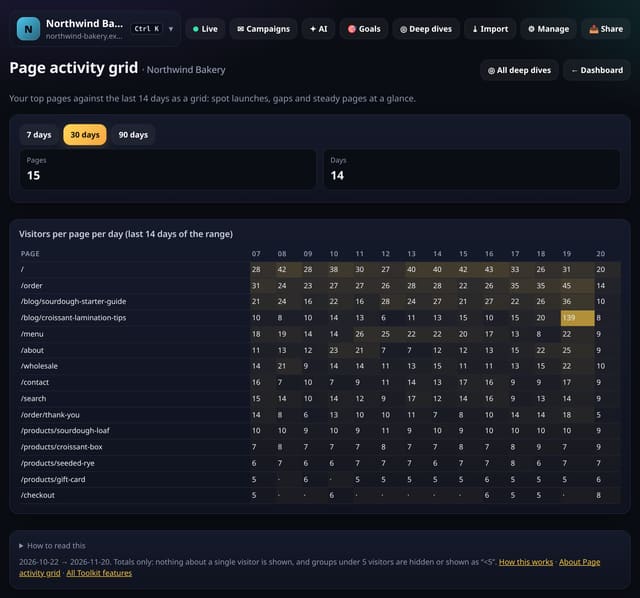
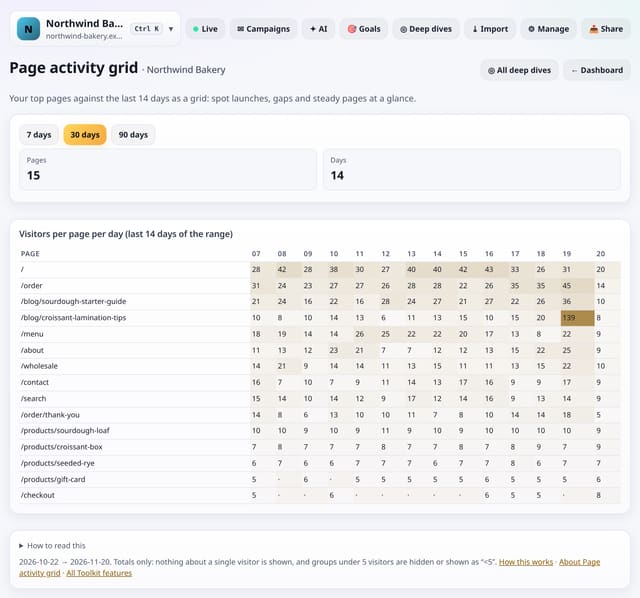
Your top pages against the last 14 days as a grid: spot launches, gaps and steady pages at a glance.
Why use it: A table of totals hides when things happened.
About Page activity gridHow to use it: Page activity gridQS-457
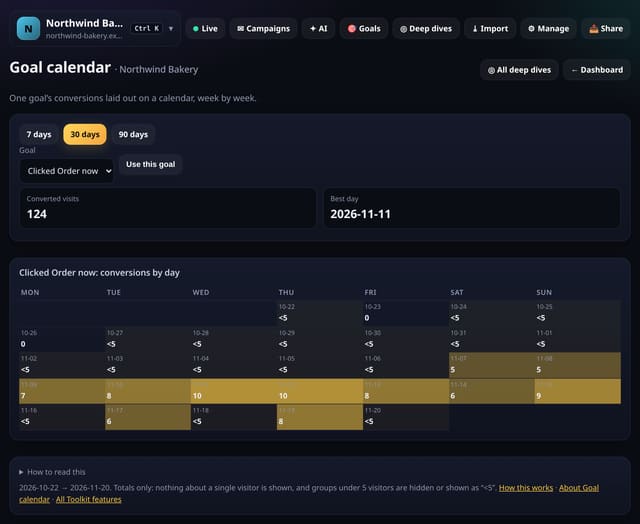
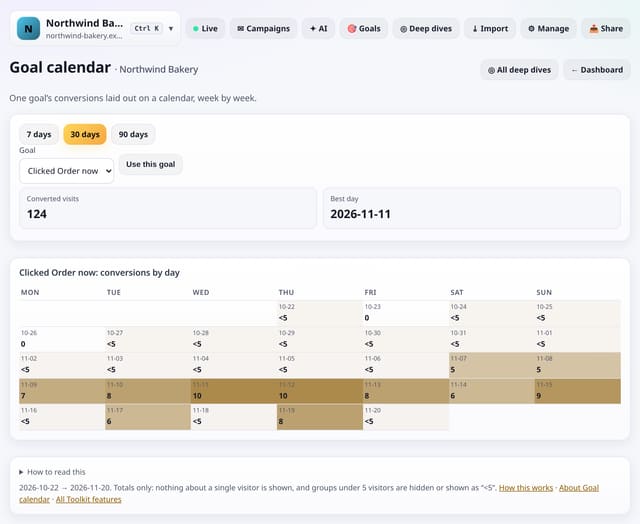
One goal’s conversions laid out on a calendar, week by week, with the best day.
Why use it: Patterns like “we convert on Mondays” jump out of a calendar in a way they never do from a line chart.
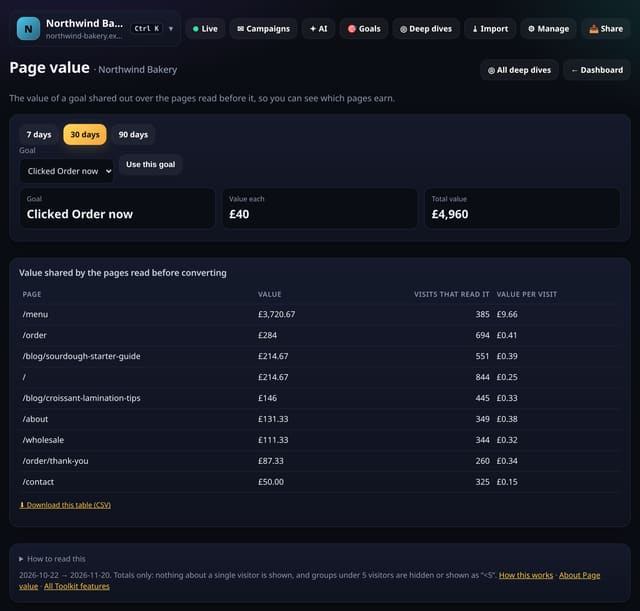
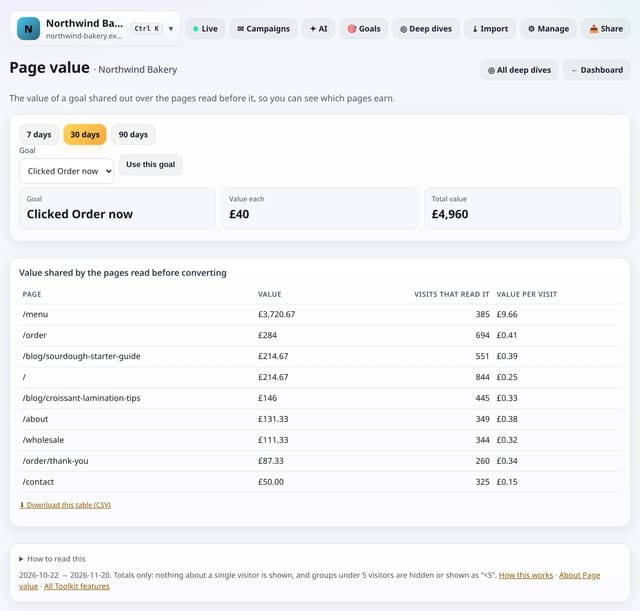
The value of a goal shared out over the pages read before it, so you can see which pages earn.
Why use it: Your blog post may never sell directly, but if it is read before half your sales, it is earning.
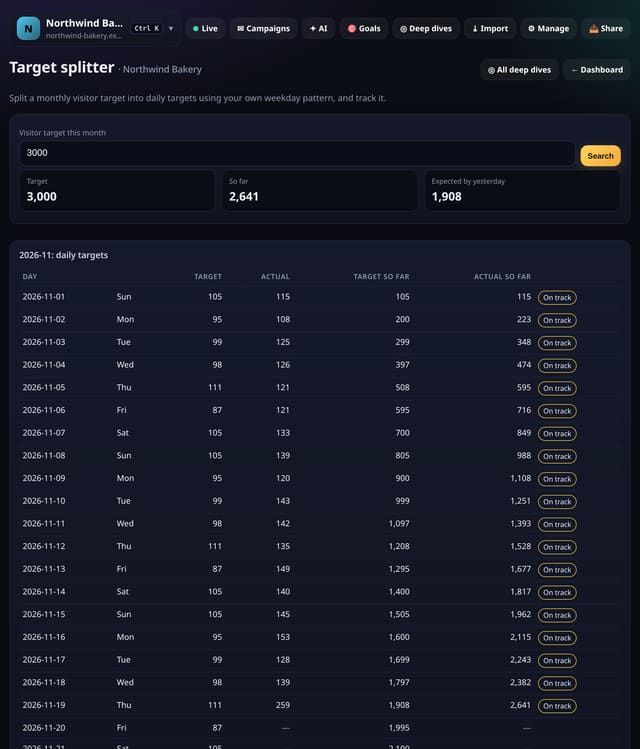
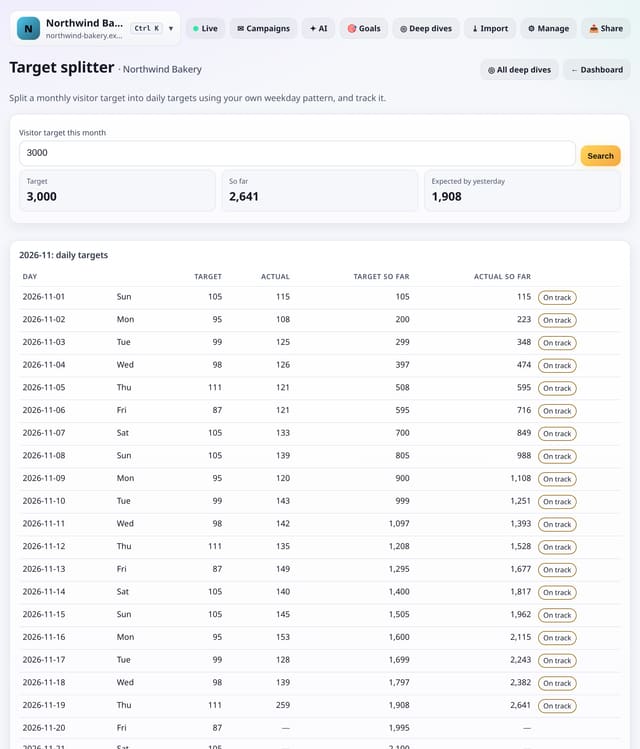
Split a monthly visitor target into daily targets using your own weekday pattern, and see how you are tracking.
Why use it: A flat daily target makes every weekend look like a failure.
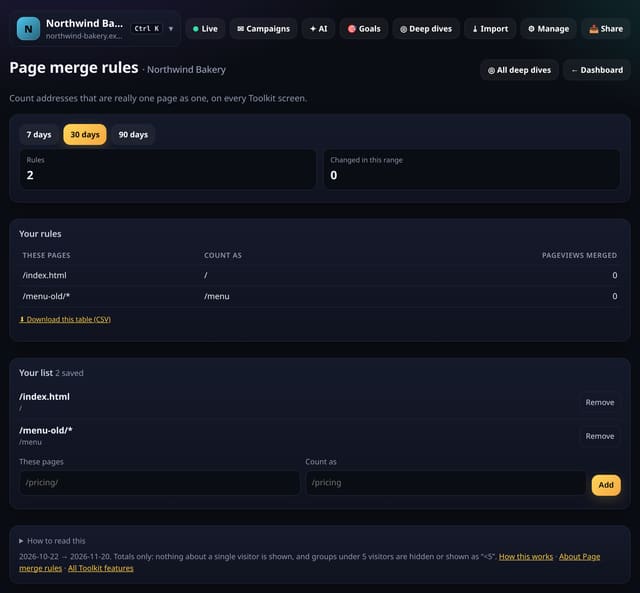
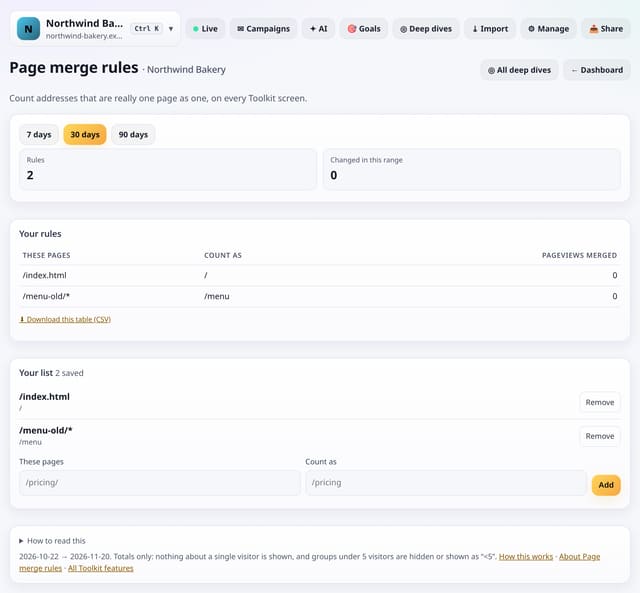
Count addresses that are really one page (old slugs, tracking variants) as one page on every Toolkit screen.
Why use it: Renamed pages and odd variants split your numbers.
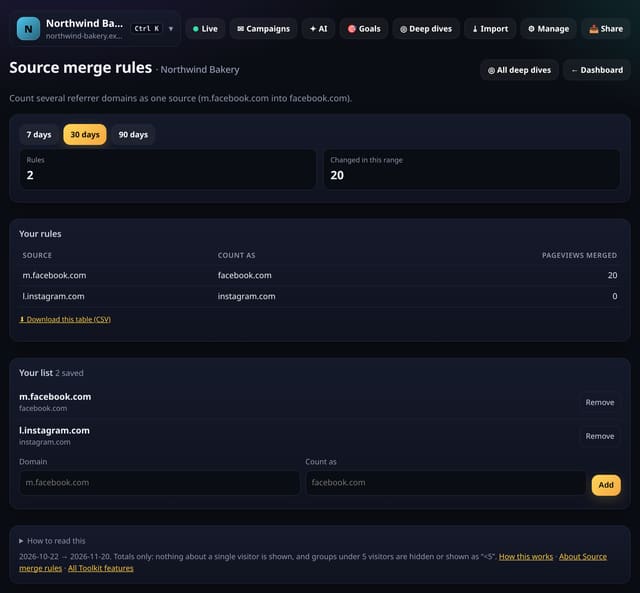
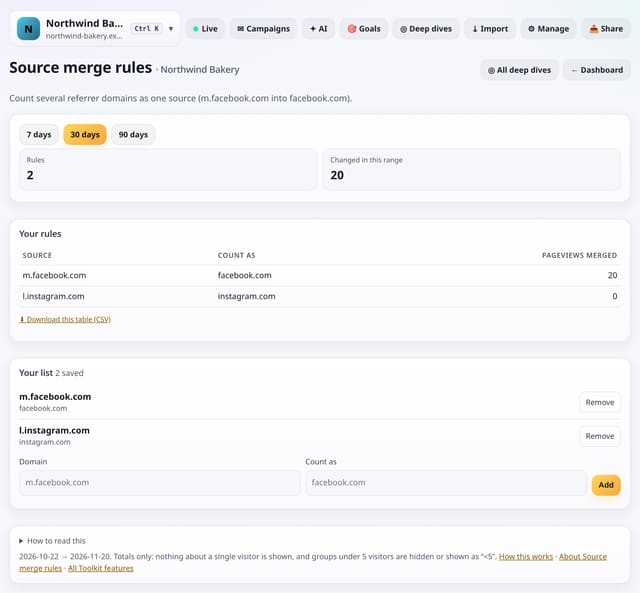
Count several referrer domains as one source, for example m.facebook.com and l.facebook.com as facebook.com.
Why use it: Big sites send visits from many subdomains.
About Source merge rulesHow to use it: Source merge rulesQS-462
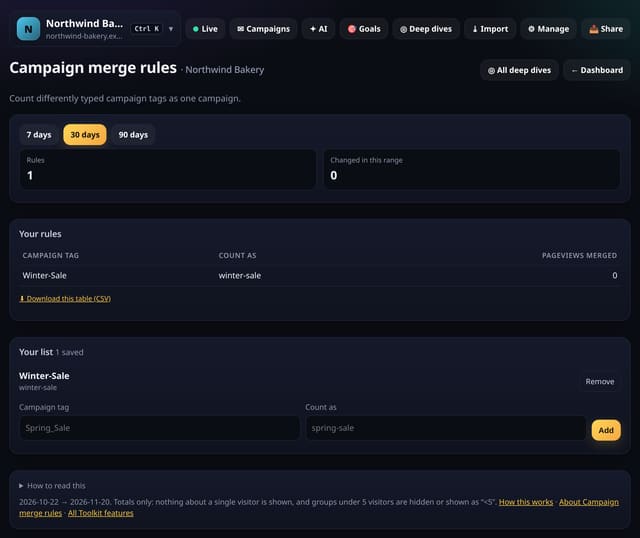
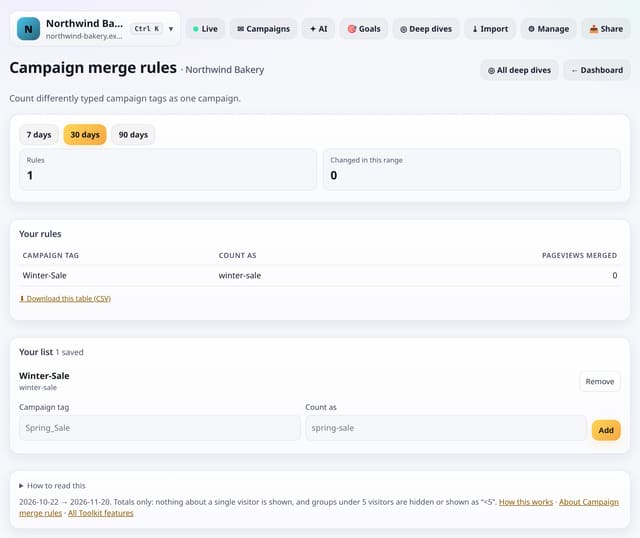
Count differently typed campaign tags (Spring-Sale, spring_sale) as one campaign.
Why use it: Campaign tags are typed by people, and people make typos.
About Campaign merge rulesHow to use it: Campaign merge rulesQS-463
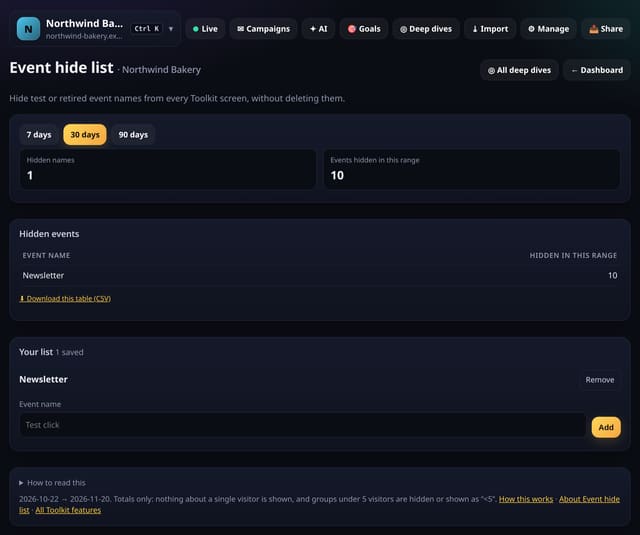
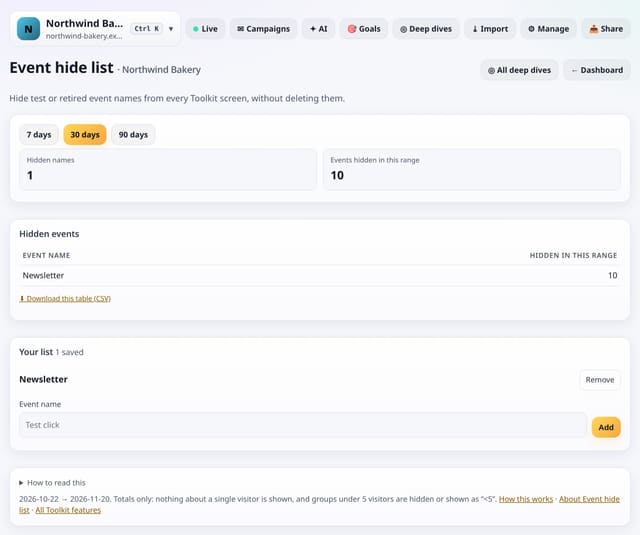
Hide test or retired event names from every Toolkit screen, without deleting them.
Why use it: Test events and old buttons clutter every event list.
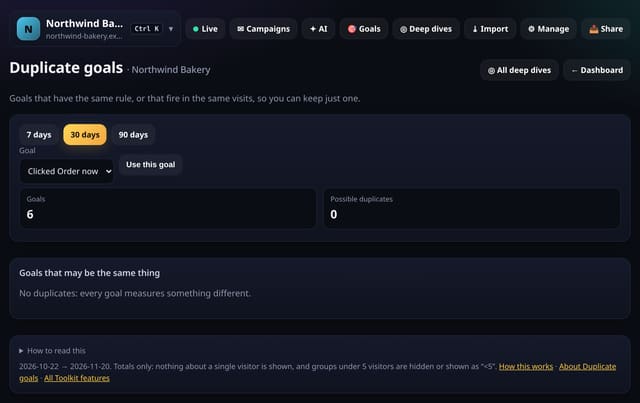
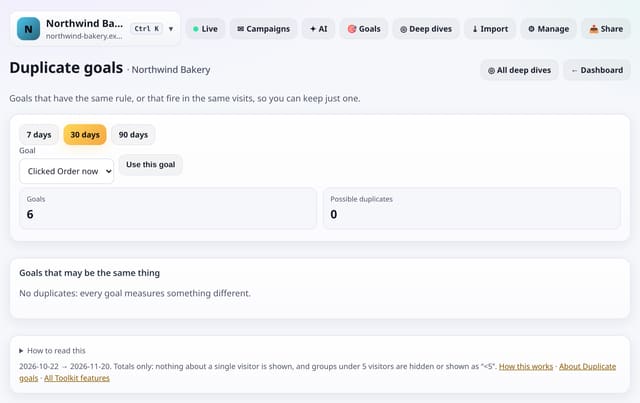
Goals with the same rule, or that are reached in nearly the same visits, so you can keep just one.
Why use it: Two goals that always fire together double-count your success.
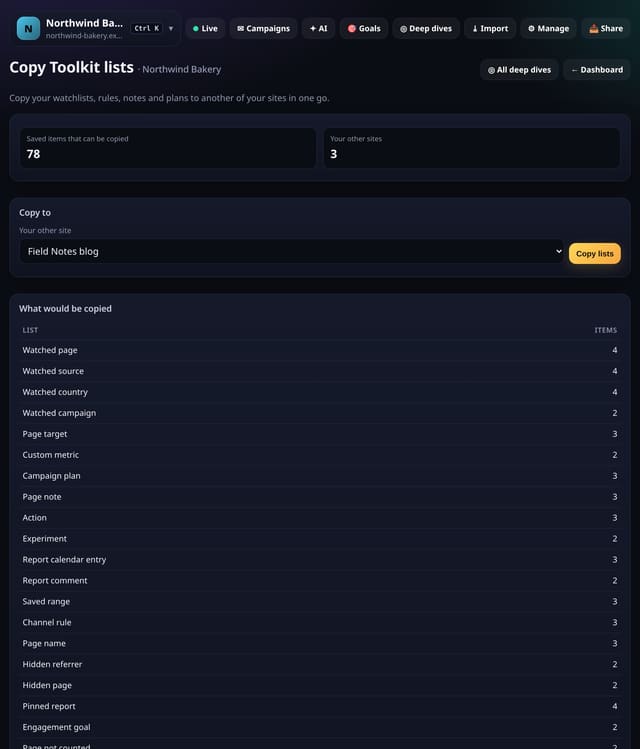
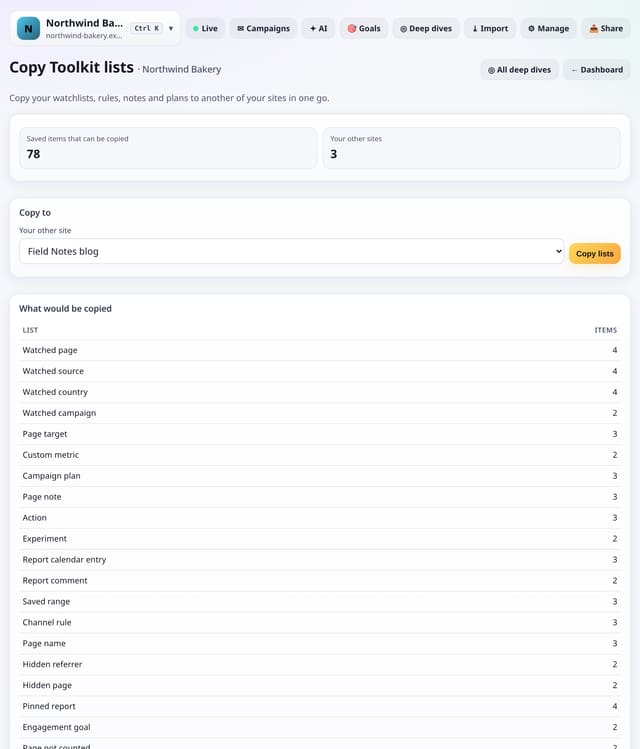
Copy your watchlists, rules, notes and plans to another of your sites in one go.
Why use it: Setting up a second site should not mean typing everything again.
About Copy Toolkit listsHow to use it: Copy Toolkit listsQS-466
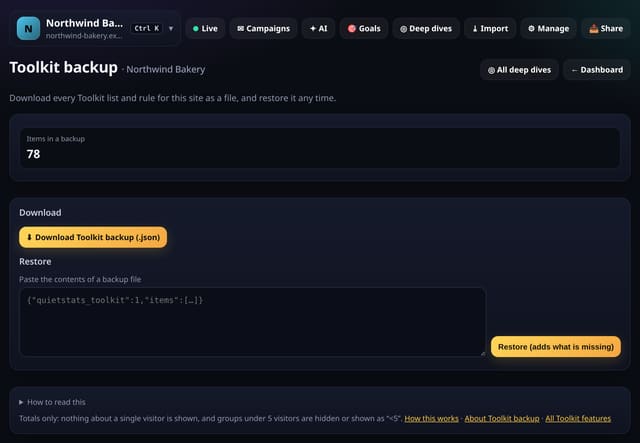
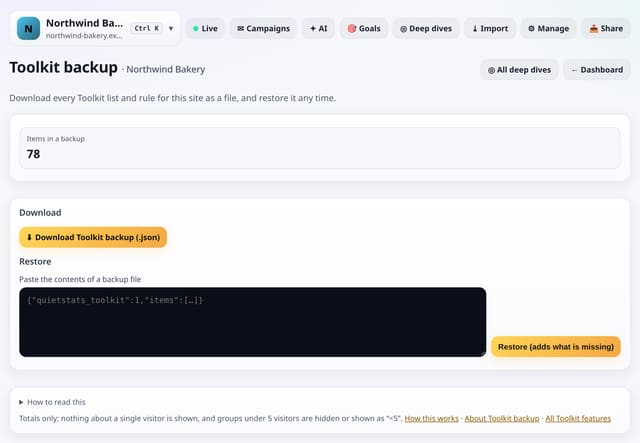
Download every Toolkit list and rule for this site as a file, and restore it any time.
Why use it: Your lists and rules are work.
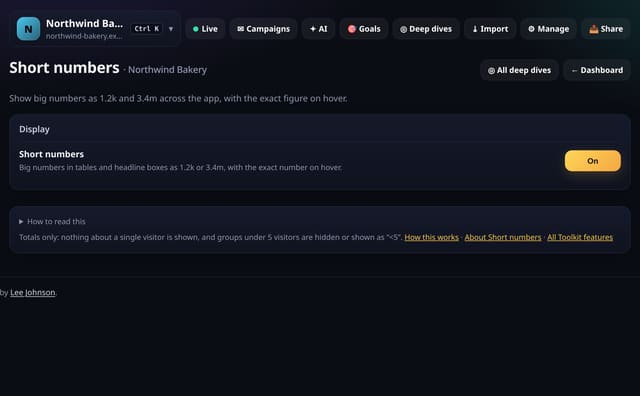
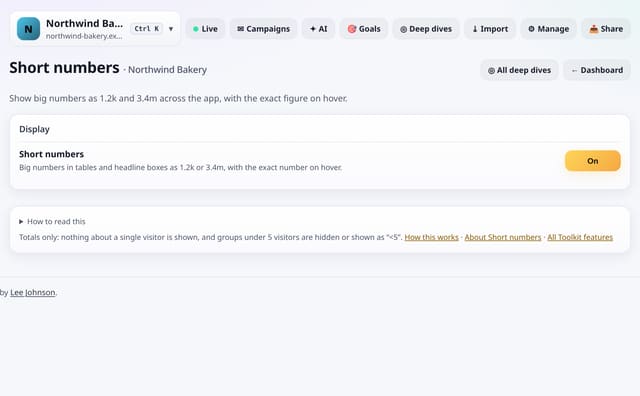
Show big numbers as 1.2k and 3.4m across the app, with the exact figure when you hover or long-press.
Why use it: On a phone, long numbers crowd the table.
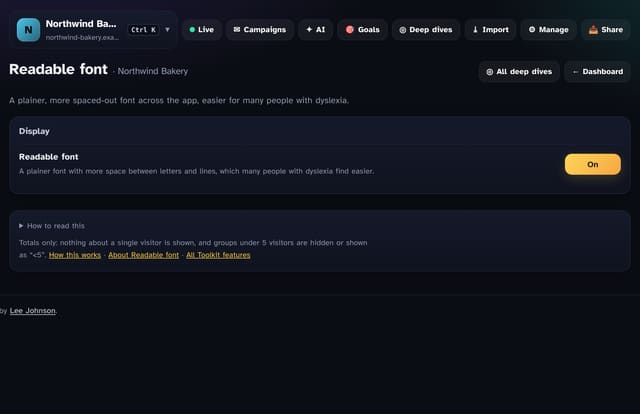
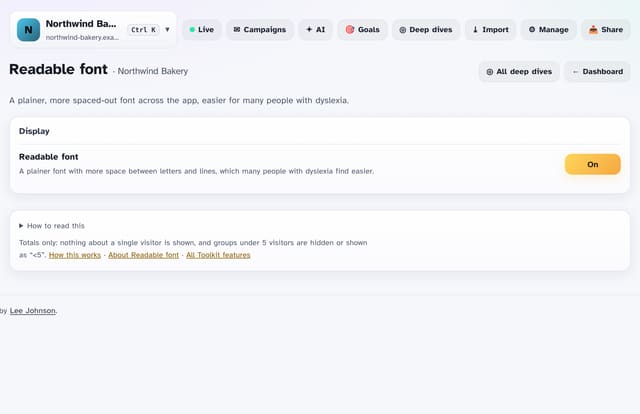
A plainer, more spaced-out font across the app, which many people with dyslexia find easier.
Why use it: Small changes to letter and line spacing make a big difference for many readers.
Underline every link so it never relies on colour alone.
Why use it: Colour alone is hard to see for many people.
Hide the menus on report screens and keep just the numbers.
Why use it: Presenting on a call or reading on a small laptop?
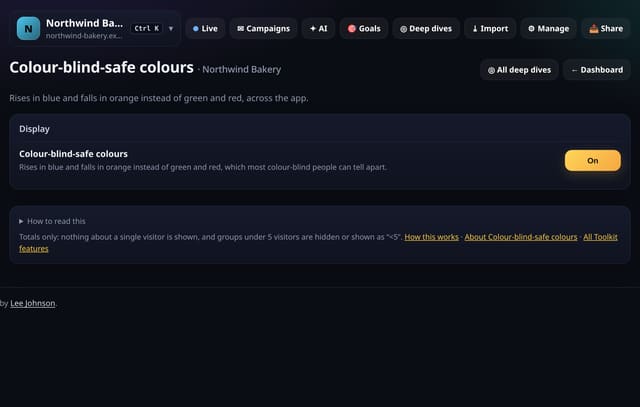
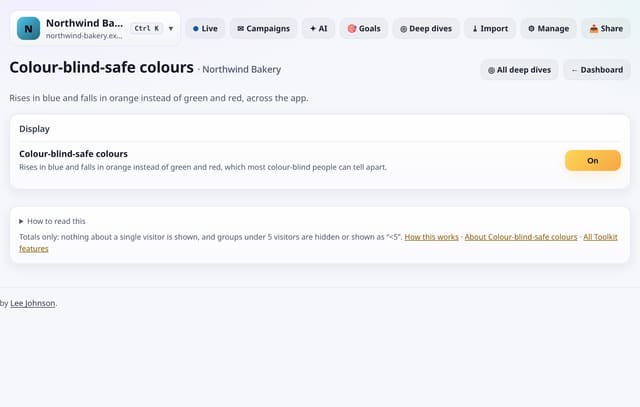
Show rises in blue and falls in orange instead of green and red, across the app.
Why use it: Red and green are the hardest colours to tell apart for the most common kinds of colour blindness.
About Colour-blind-safe coloursHow to use it: Colour-blind-safe coloursQS-472
Added in the evening: 50 new screens in Deep dives → Analysis lab, also searchable on All reports. Each one works something out rather than re-counting a list: which pages and events go with converting (lift), whether a week’s conversion rate is really out of line (control limits), the days your traffic changed level (change points), which pages hold your site together (PageRank from real journeys), whether a change came from your audience mix or from behaviour, which daily numbers move together, and two pages or sources side by side with a fair significance test. Same rules as everything else: no cookies, no IP addresses, totals only, groups under 5 hidden, nothing new collected and the tracking script unchanged.
Open any of them from Deep dives → Analysis lab. Pick a goal at the top where a screen asks for one.
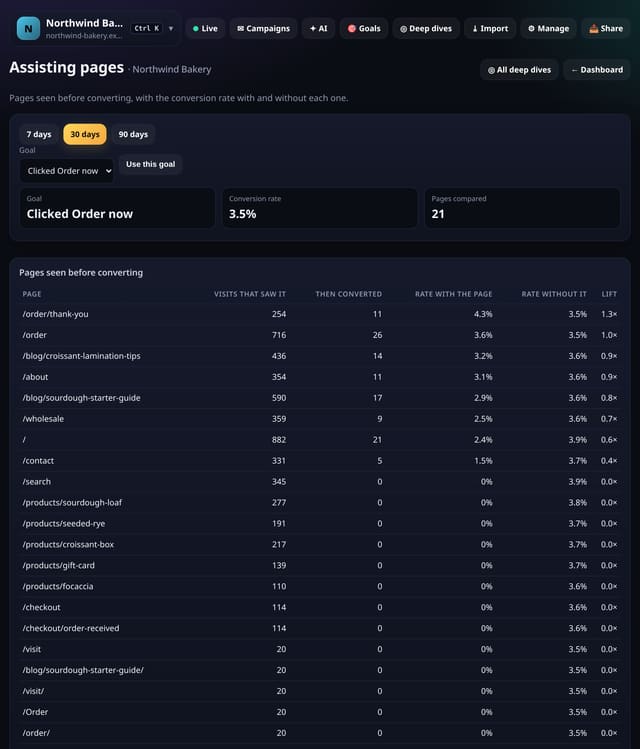
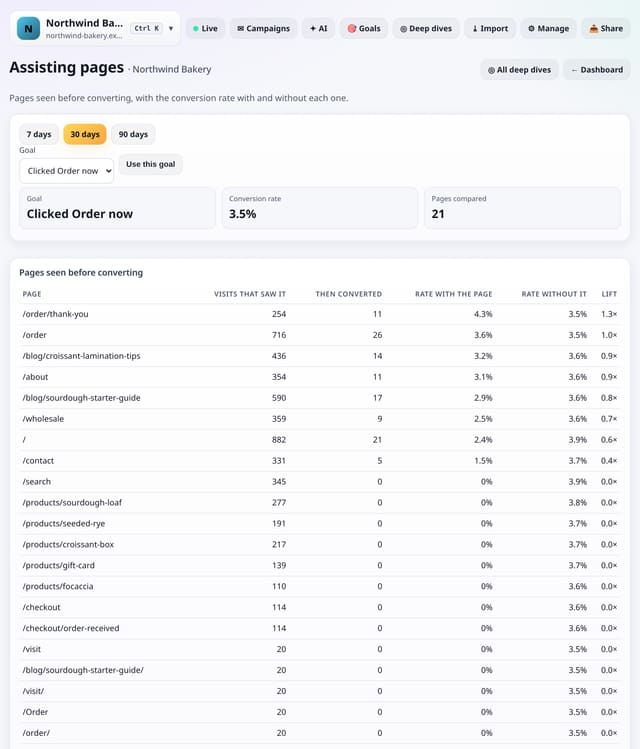
Every page seen in a visit before the goal, with the conversion rate of visits that saw it against visits that did not, as a lift.
Why use it: Your thank-you page always gets the credit.
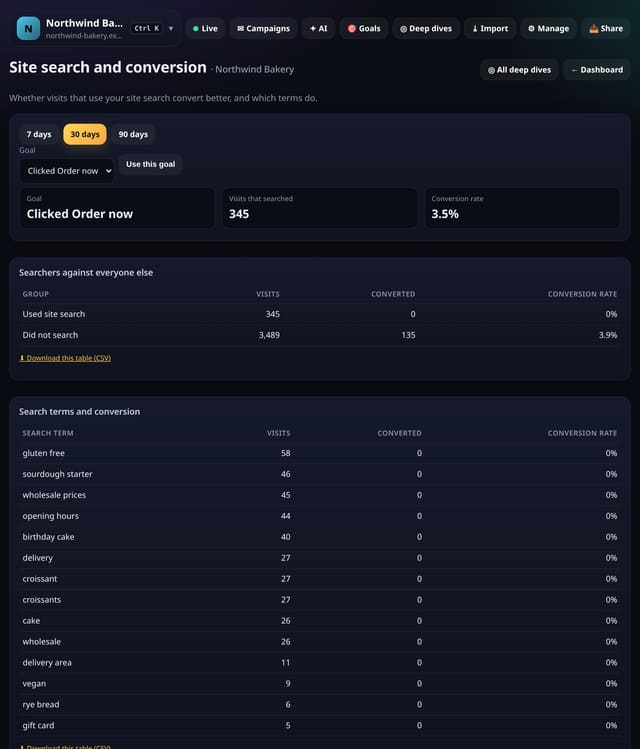
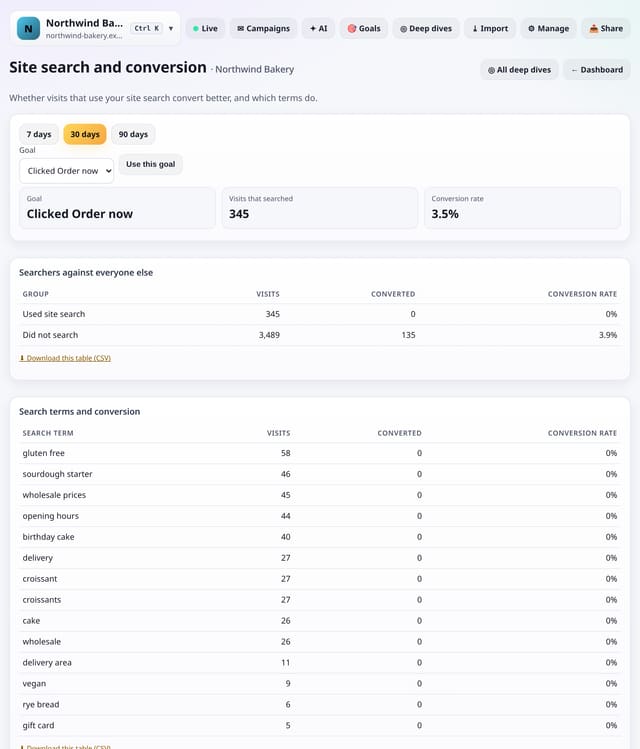
Whether visits that use your site search convert more or less than visits that do not, and which search terms go with converting.
Why use it: Searchers often know what they want.
About Site search and conversionHow to use it: Site search and conversionQS-476
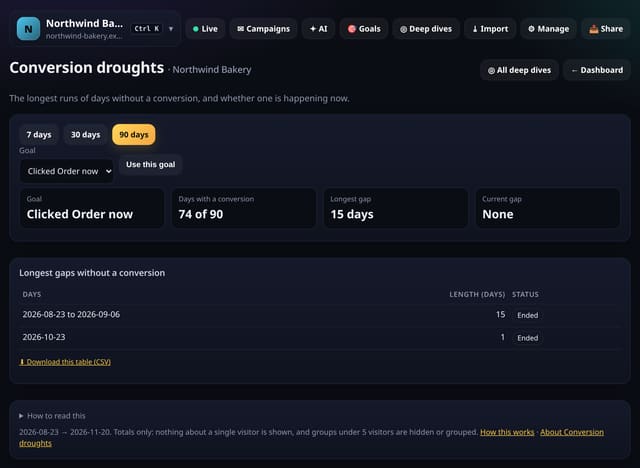
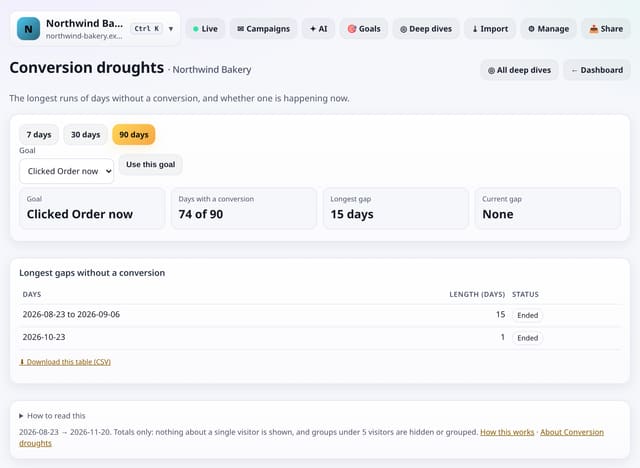
The longest runs of days with no conversions, and whether you are in one right now.
Why use it: A goal that stops firing is easy to miss on a busy chart.
About Conversion droughtsHow to use it: Conversion droughtsQS-477
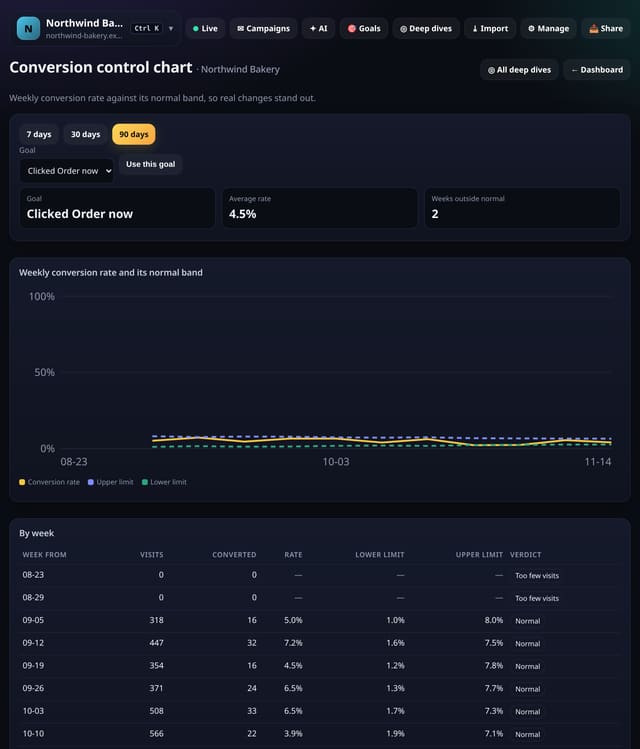
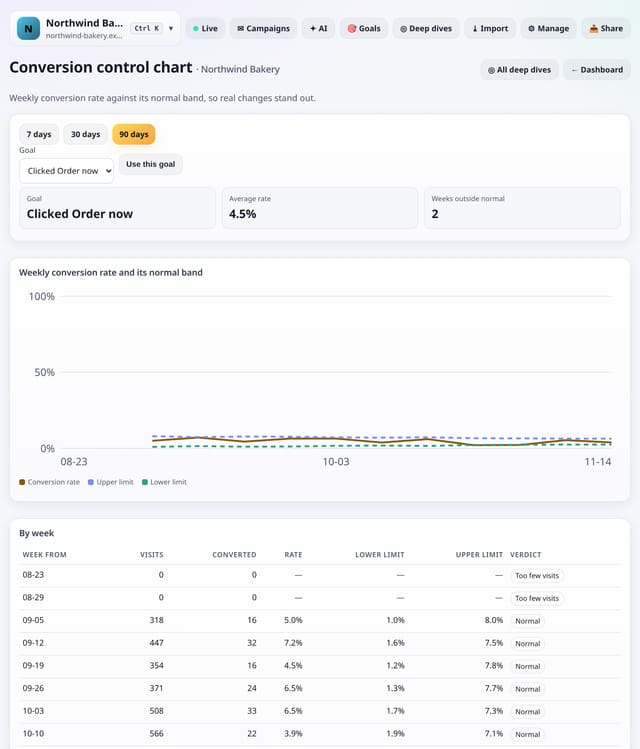
Your weekly conversion rate drawn against its normal band, so weeks that are really different stand out from normal ups and downs.
Why use it: Conversion rates bounce around, especially on small sites.
About Conversion control chartHow to use it: Conversion control chartQS-478
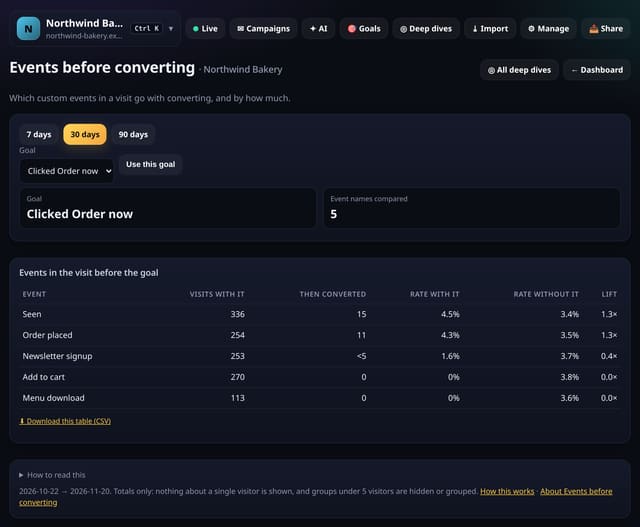
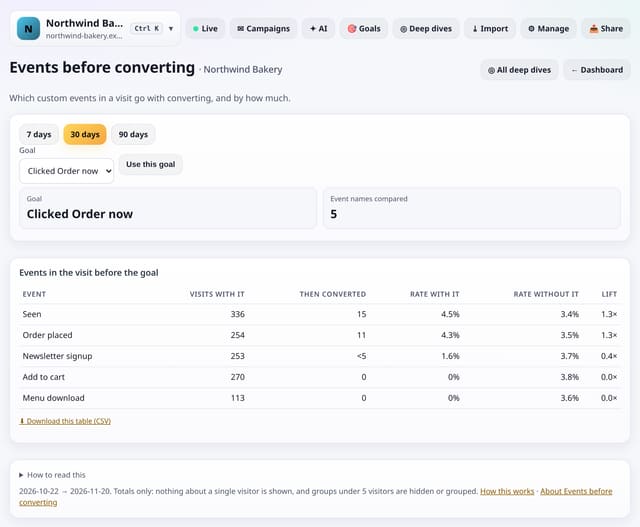
Which custom events in a visit (clicks, downloads, video plays) go with converting, and by how much.
Why use it: If watching the demo video doubles conversions, put the video higher up.
About Events before convertingHow to use it: Events before convertingQS-479
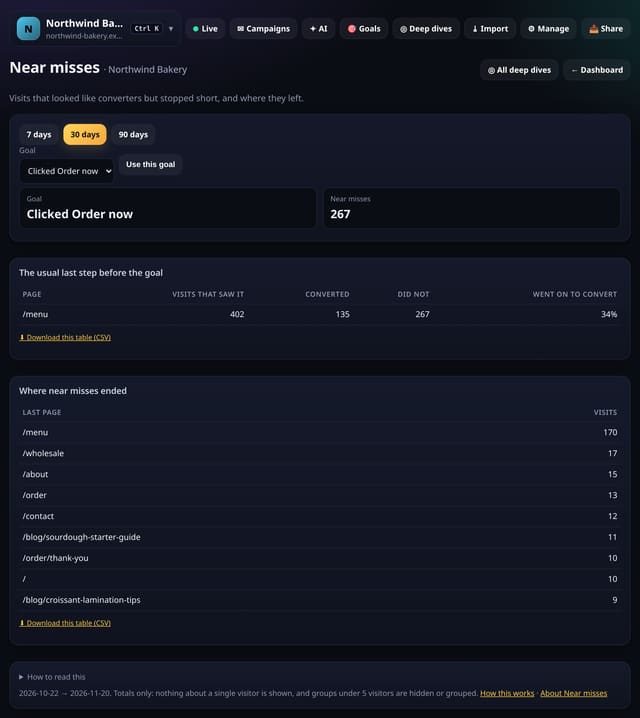
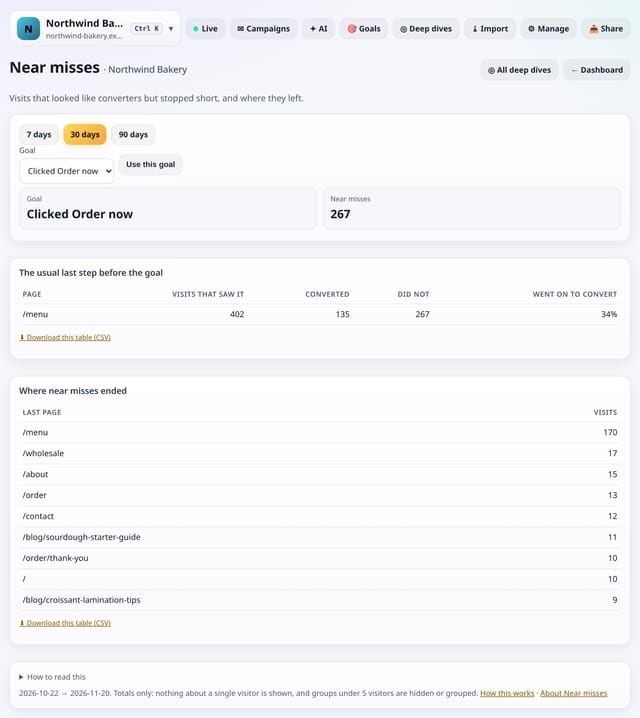
Visits that reached the usual last step before your goal but did not convert, and the page where they left.
Why use it: These are the people you nearly had.
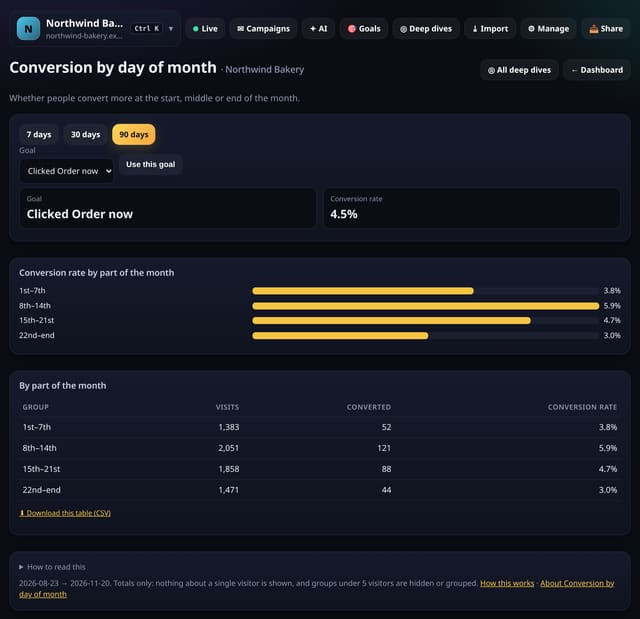
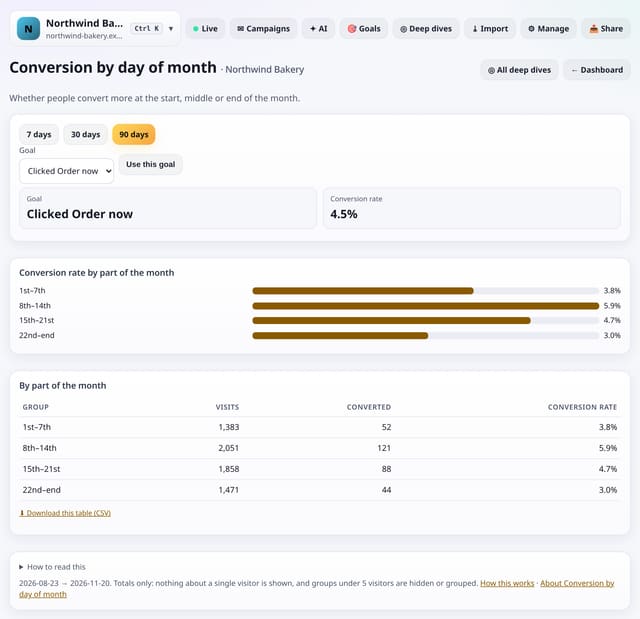
Whether people convert more in the first, second, third or last week of the month, for example around payday.
Why use it: If conversions rise at the end of the month, time your emails and offers for then.
About Conversion by day of monthHow to use it: Conversion by day of monthQS-481
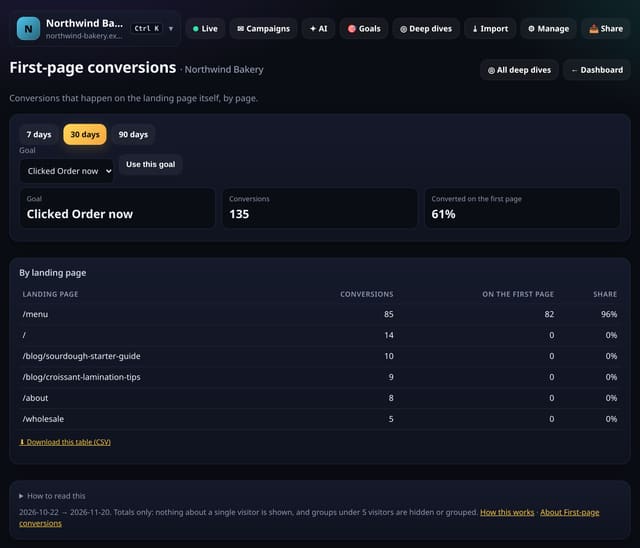
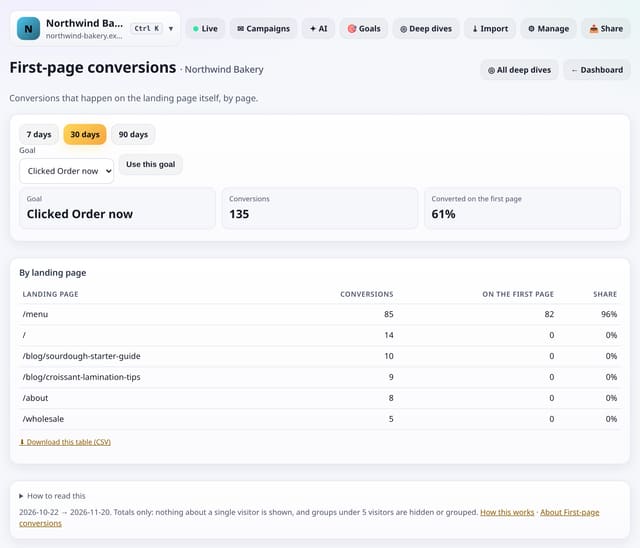
Which landing pages get people to convert without opening any other page first.
Why use it: Pages that convert on the spot are your best landing pages for ads and links.
About First-page conversionsHow to use it: First-page conversionsQS-482
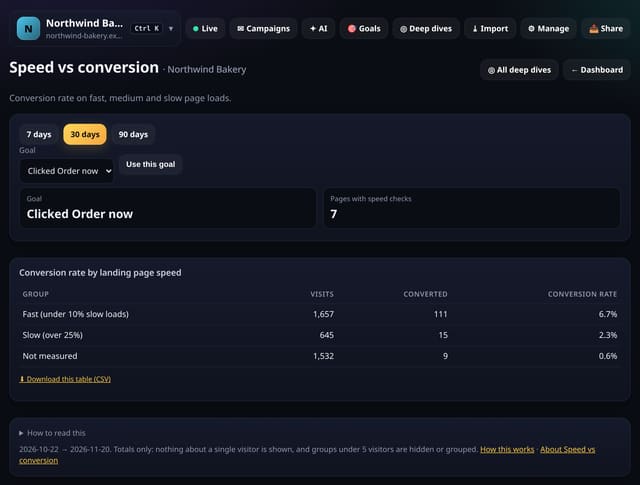
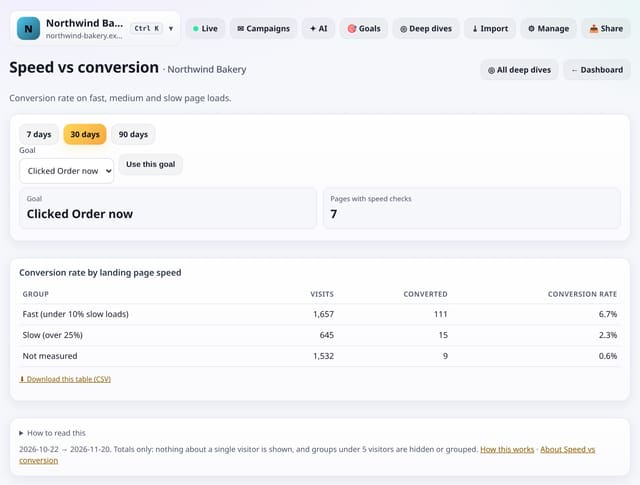
The conversion rate of visits that landed on fast, mixed and slow pages, from the speed data quietstats already measures.
Why use it: It puts a number on speed.
About Speed vs conversionHow to use it: Speed vs conversionQS-483
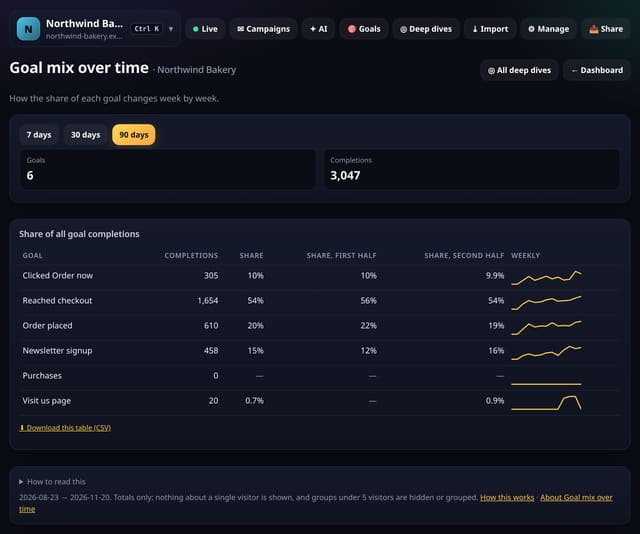
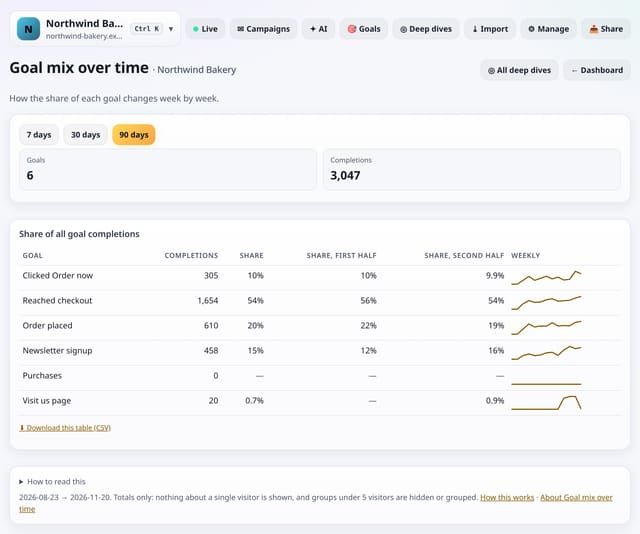
How the share of each of your goals changes between the first and second half of the range, with a weekly line for each.
Why use it: If sign-ups grow but demo requests shrink, your audience may be changing.
About Goal mix over timeHow to use it: Goal mix over timeQS-484
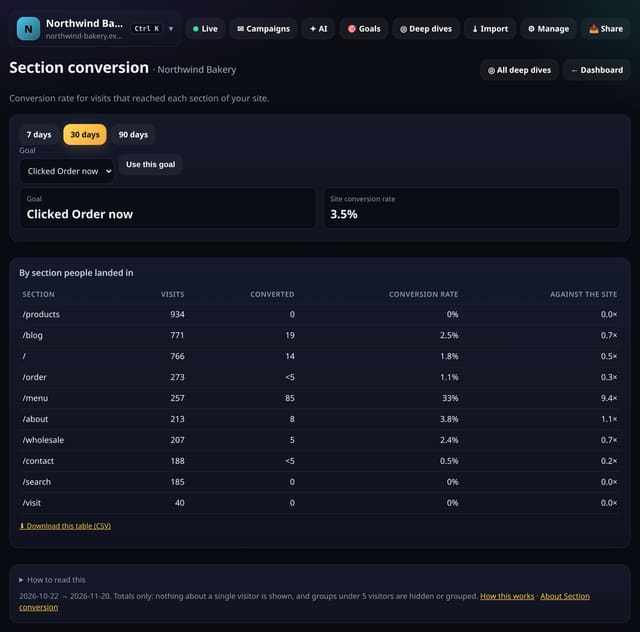
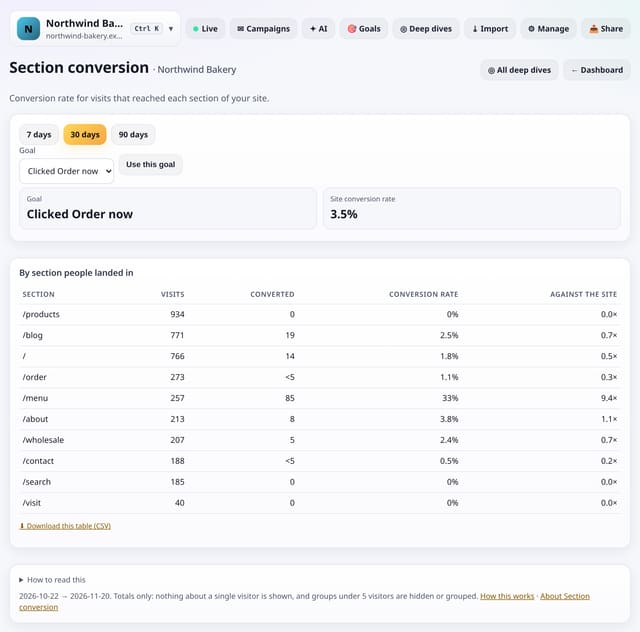
The conversion rate of visits by the section of your site they landed in, such as /blog, /docs or /pricing.
Why use it: It tells you whether your blog actually brings customers, or only readers, and which section is worth more links from the rest of the site.
About Section conversionHow to use it: Section conversionQS-485
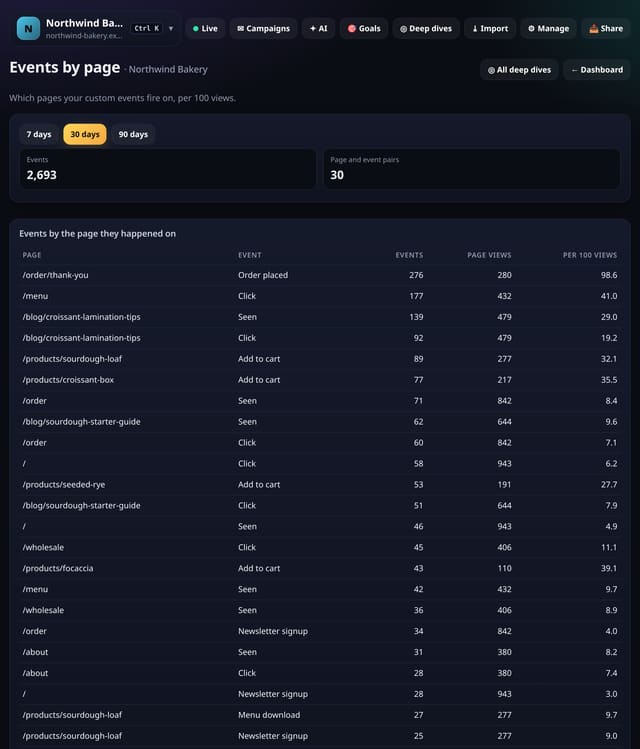
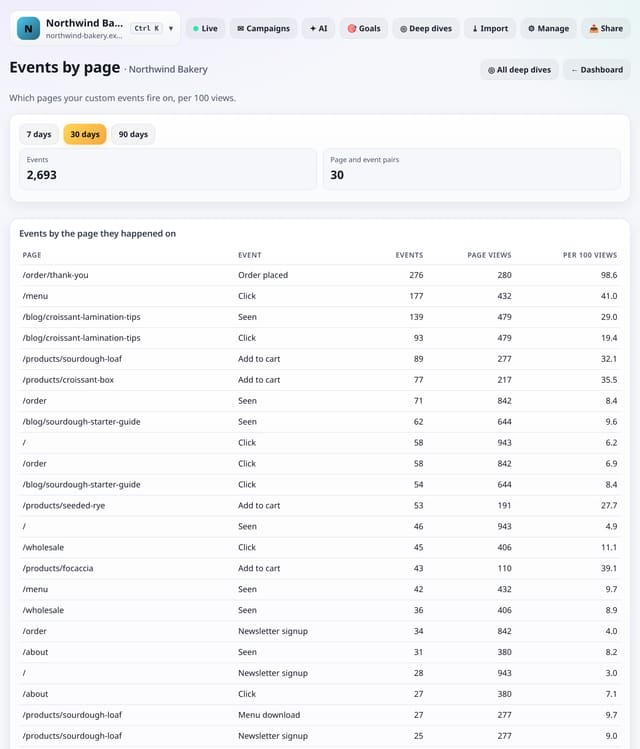
Which pages each custom event fires on, per 100 views of that page.
Why use it: It shows where a button gets pressed most for the views it gets, which pages a download really comes from, and where an event never fires.
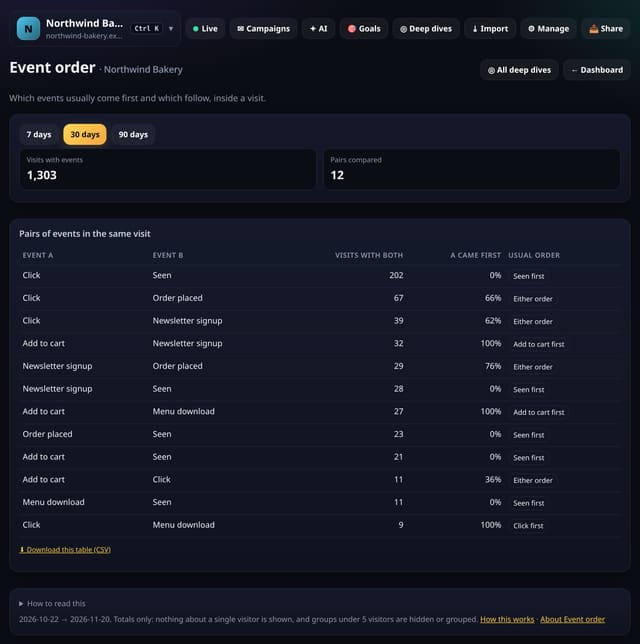
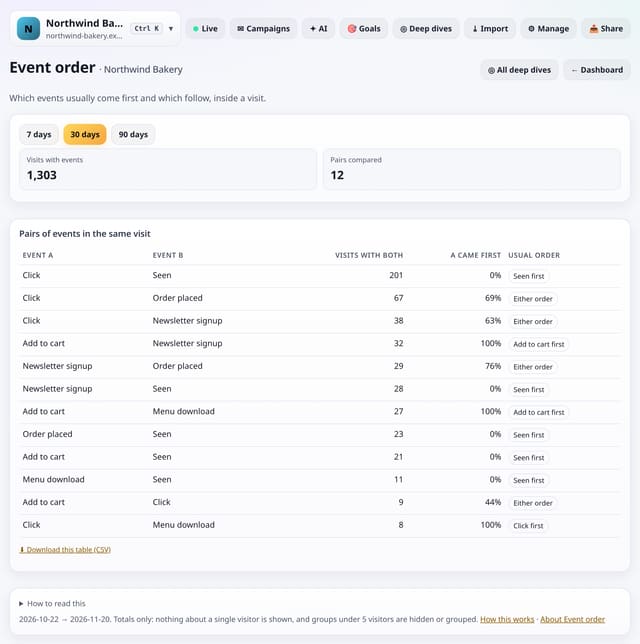
Inside a visit, which custom events usually come first and which follow them.
Why use it: If people usually watch the video before downloading the brochure, the video belongs higher up.
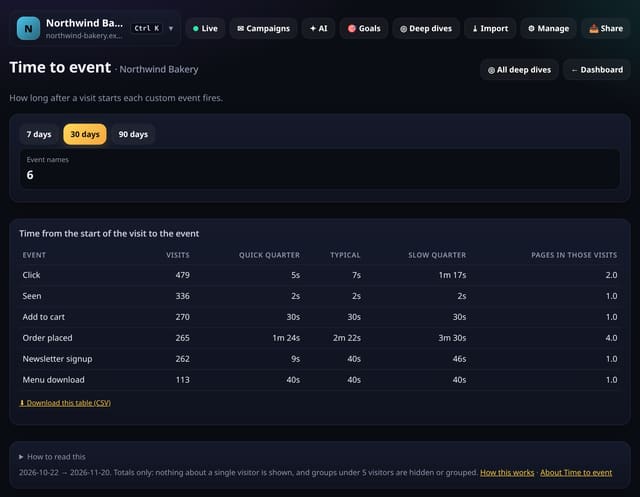
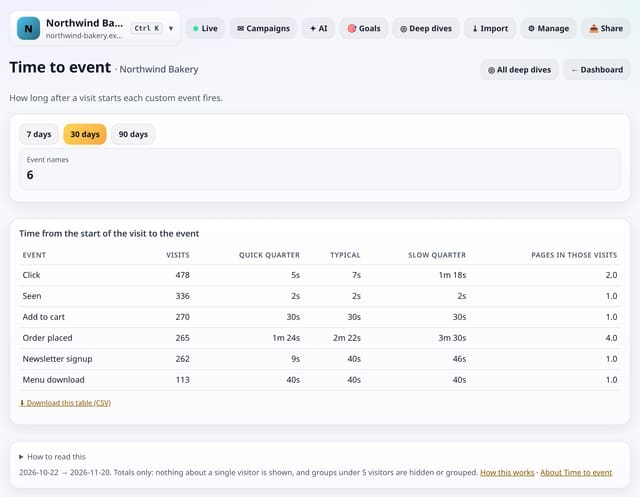
How long after a visit starts each custom event first fires, as a typical time and a spread.
Why use it: If people click your main button after 3 minutes, the page may be making them hunt for it.
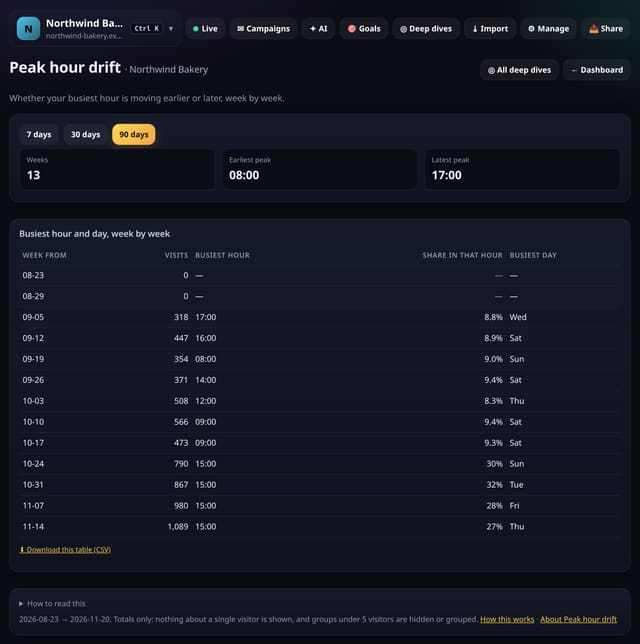
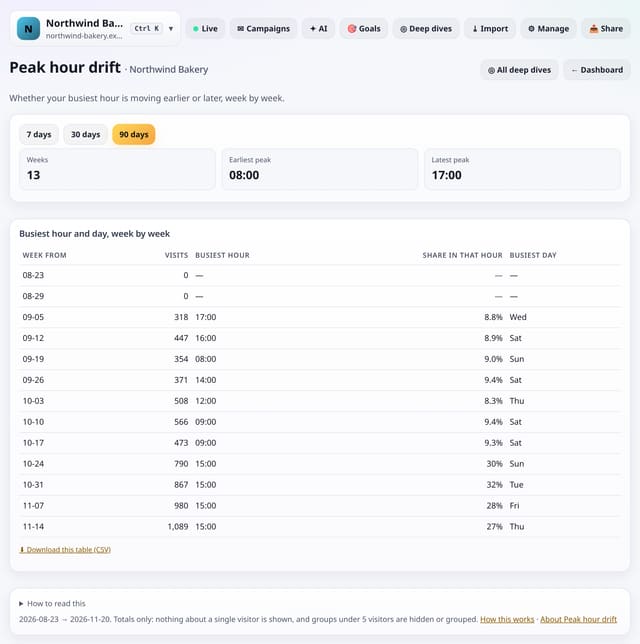
Your busiest hour and busiest day, week by week, so you can see whether your peak is moving.
Why use it: Seasons, school terms and new audiences shift when people visit.
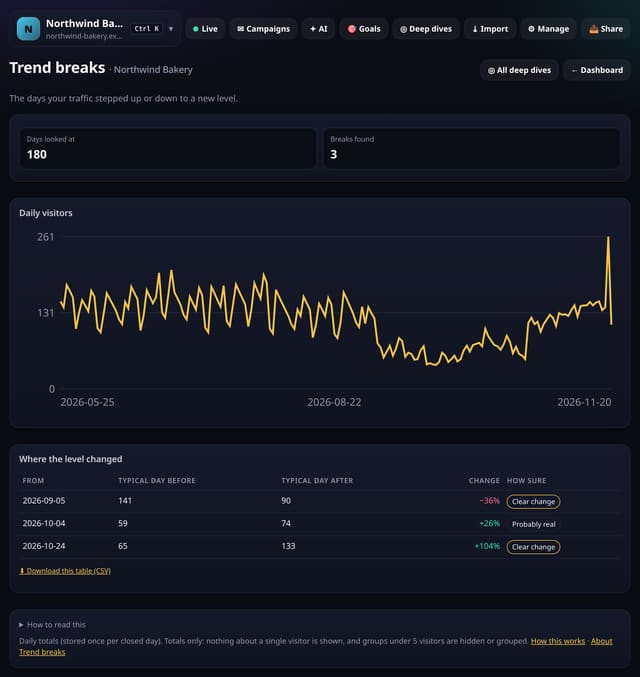
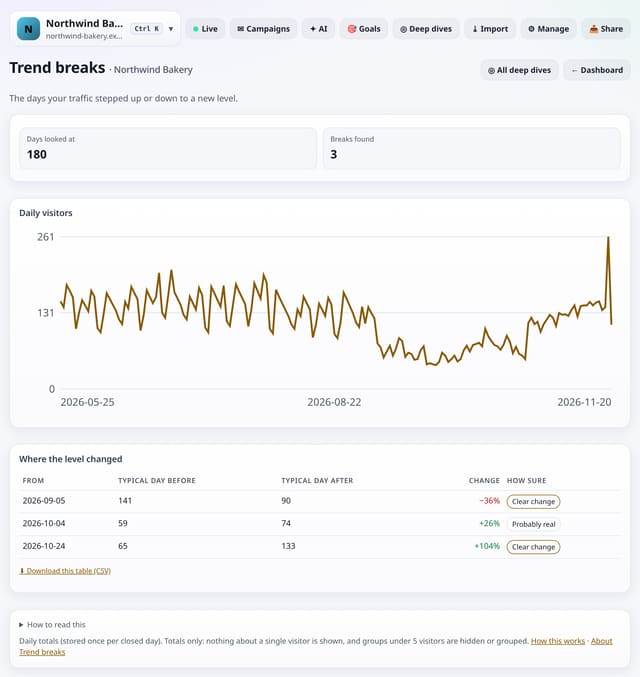
The days your daily visitors stepped up or down to a new level and stayed there, found automatically.
Why use it: A spike is gone tomorrow; a step change lasts.
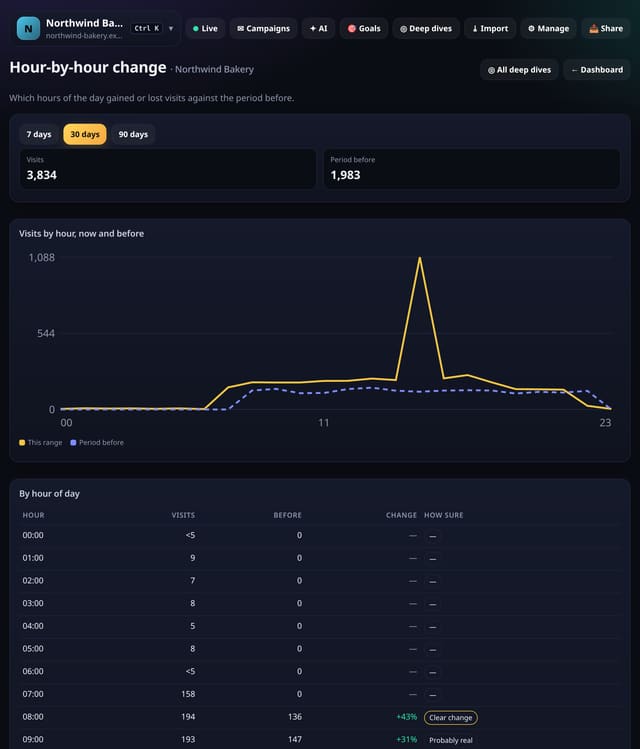
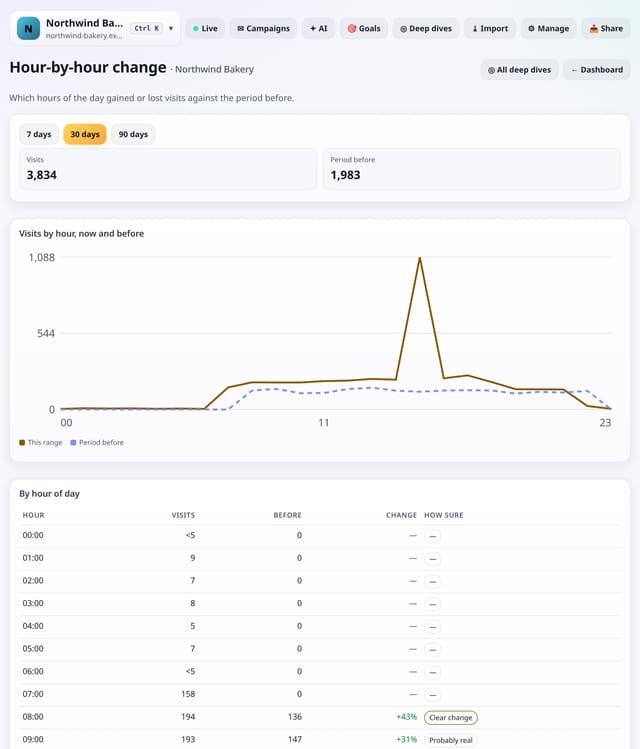
Visits for each hour of the day against the period before, so you can see which hours grew and which fell.
Why use it: A drop in evening visits but not morning ones points to something specific: a newsletter time, an ad schedule or a different audience.
About Hour-by-hour changeHow to use it: Hour-by-hour changeQS-491
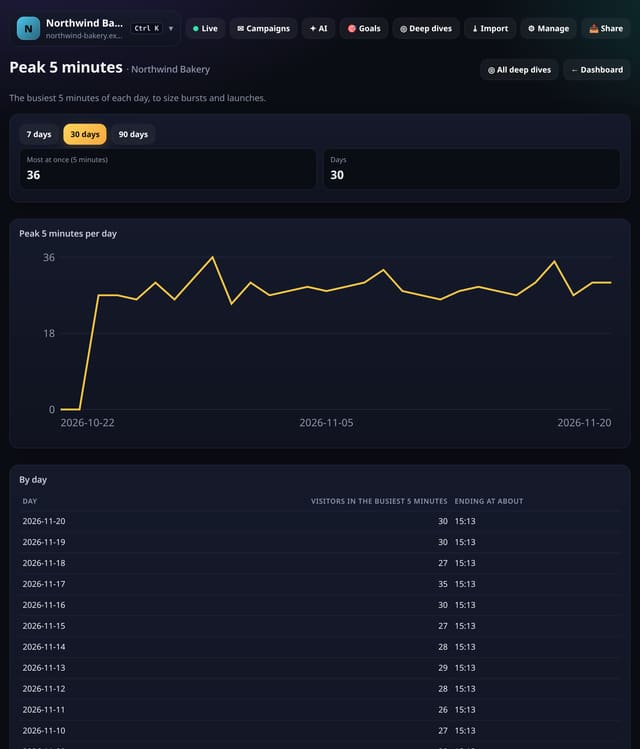
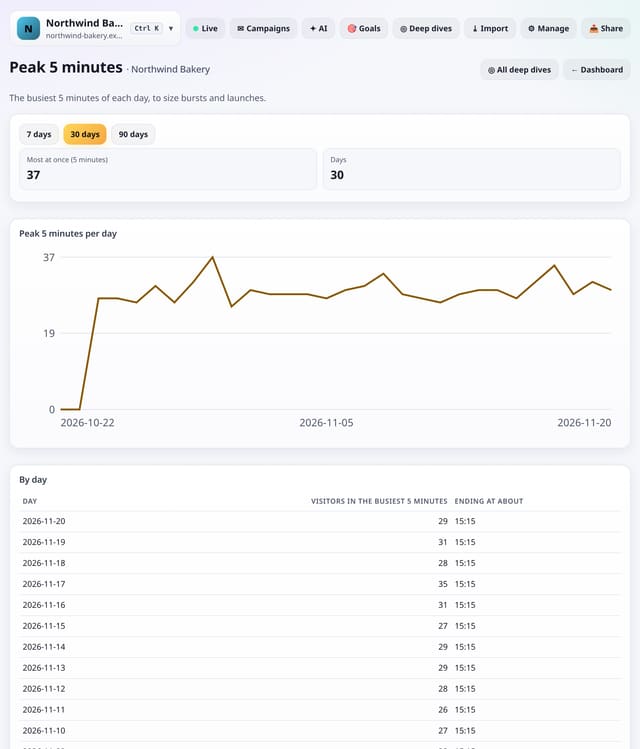
The busiest 5 minutes of each day, with the time it happened, to size bursts from launches, emails and posts.
Why use it: Daily totals hide bursts.
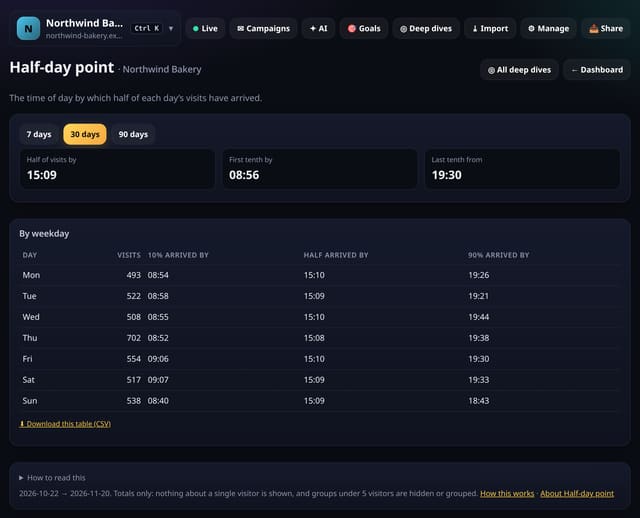
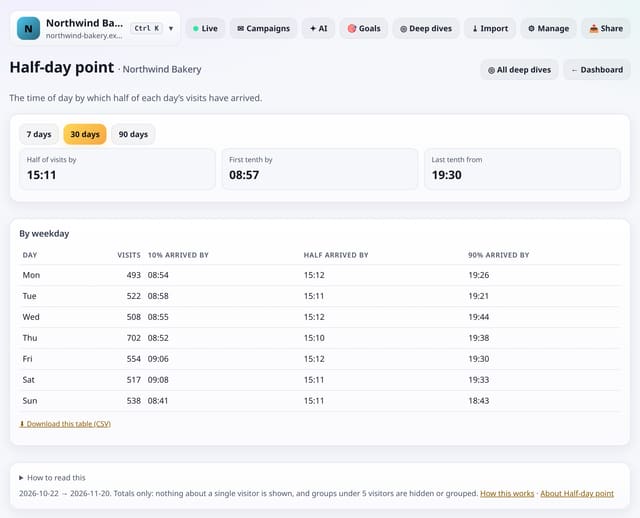
The time of day by which half your visits have arrived, for each day of the week.
Why use it: If half your visitors have arrived by 11am, a post at 2pm misses them.
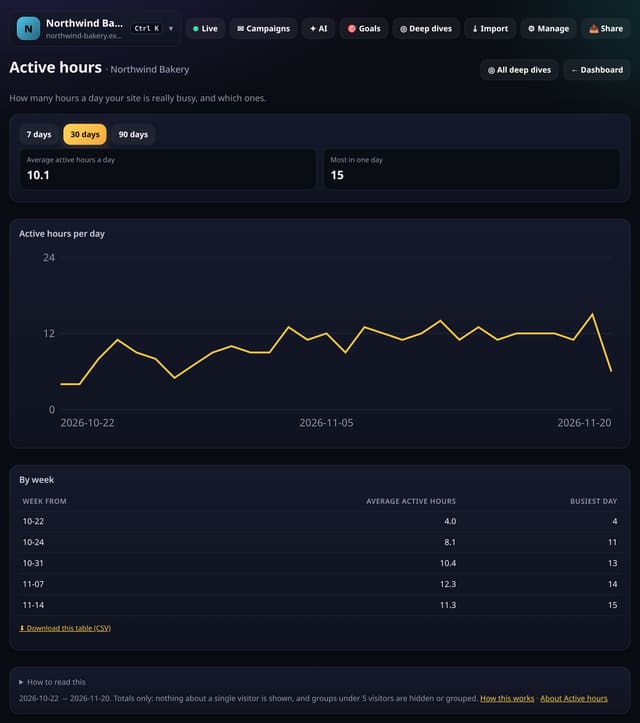
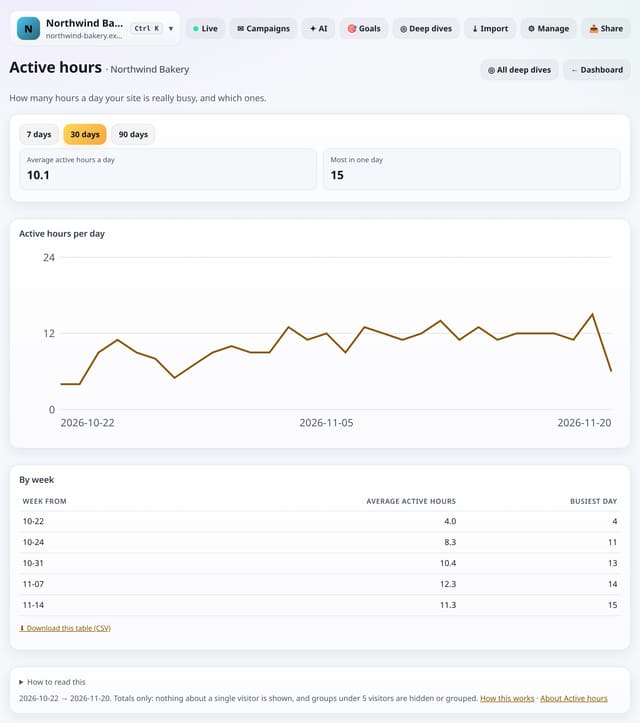
How many hours a day your site is really busy, day by day and week by week.
Why use it: A site busy for 6 hours needs a different plan from one busy for 18.
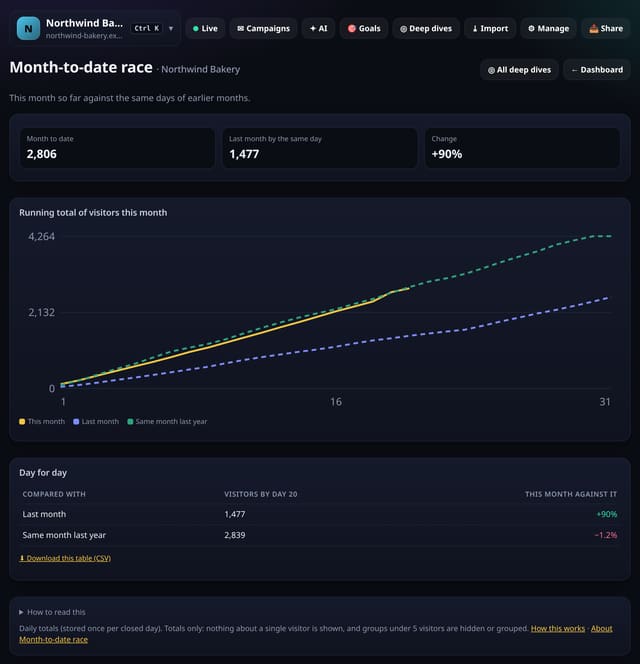
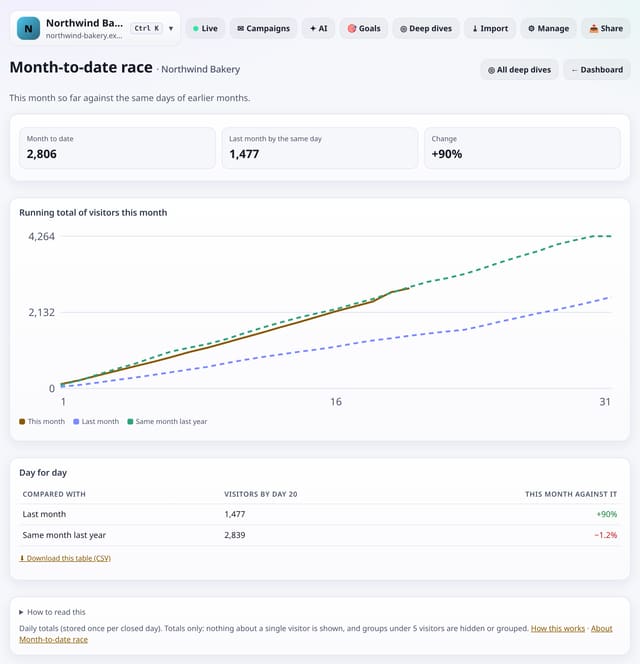
This month so far against last month and the same month last year, day for day, as a race chart.
Why use it: Half way through the month you can already tell whether it will be a good one, without waiting for the end.
About Month-to-date raceHow to use it: Month-to-date raceQS-495
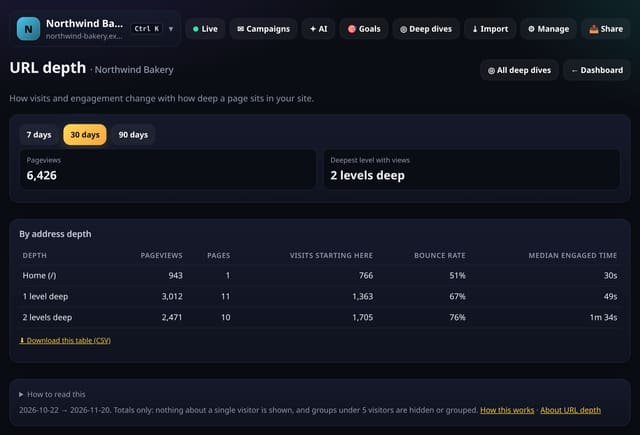
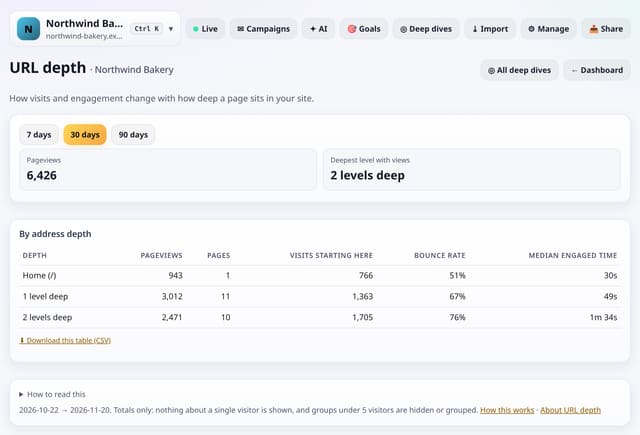
How pageviews, entrances, bounce rate and engaged time change with how deep a page sits in your site’s addresses.
Why use it: Deep pages are often your best content but the hardest to find.
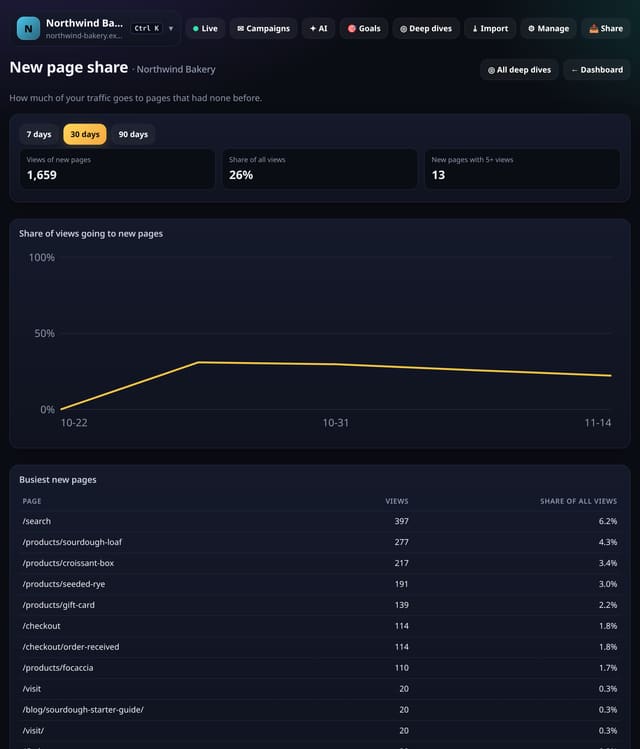
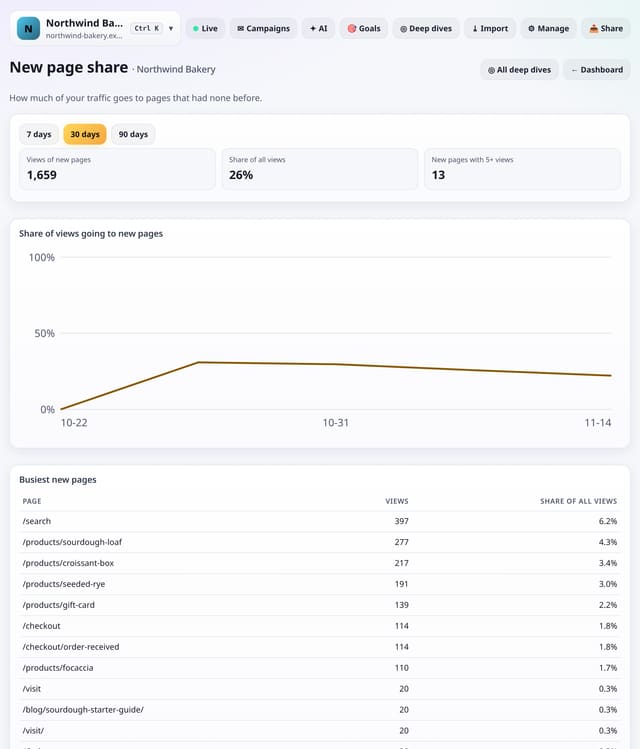
The share of your pageviews that went to pages with no views in the period before, week by week, and the busiest new pages.
Why use it: Publishing is only half the job.
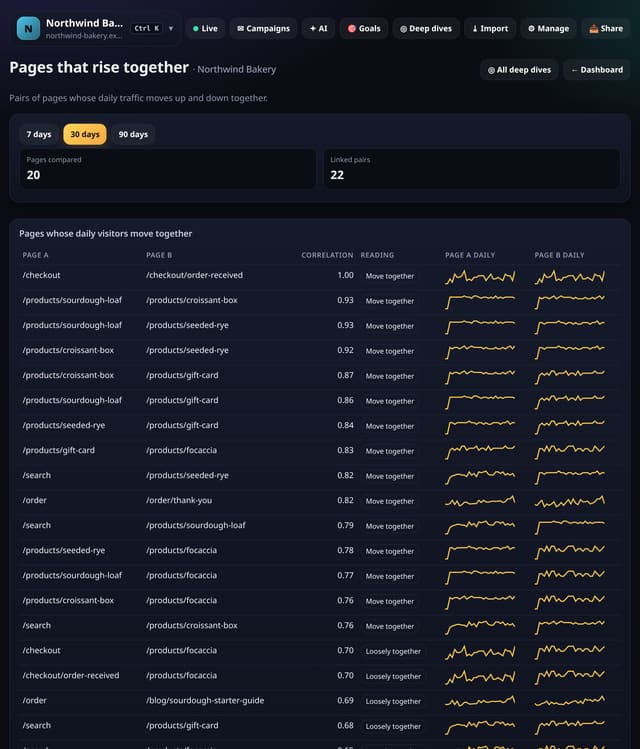
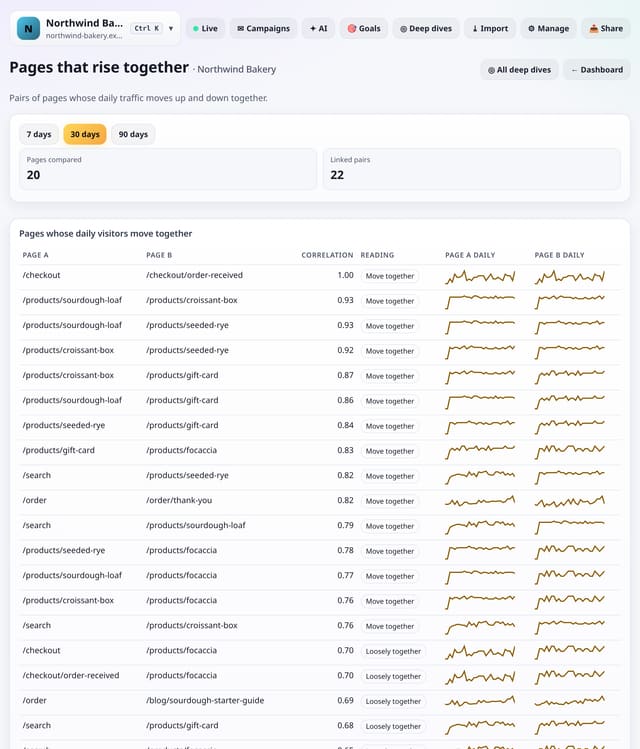
Pairs of pages whose daily visitors go up and down together (or in opposite directions), with a small chart of each.
Why use it: Pages that rise together usually share a cause: the same campaign, the same link or the same season.
About Pages that rise togetherHow to use it: Pages that rise togetherQS-498
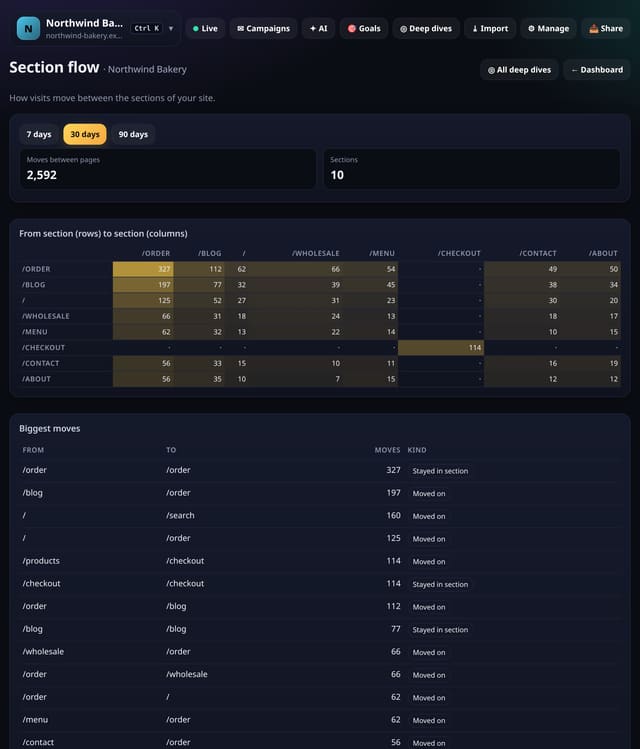
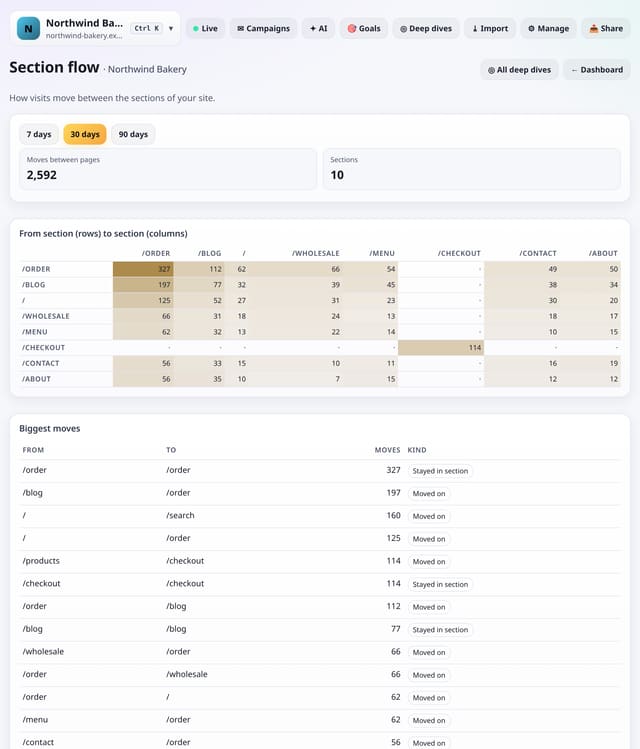
A grid of moves from one section of your site to another (for example /blog to /pricing), with the biggest moves listed.
Why use it: It shows whether readers find their way from your content to the pages that matter.
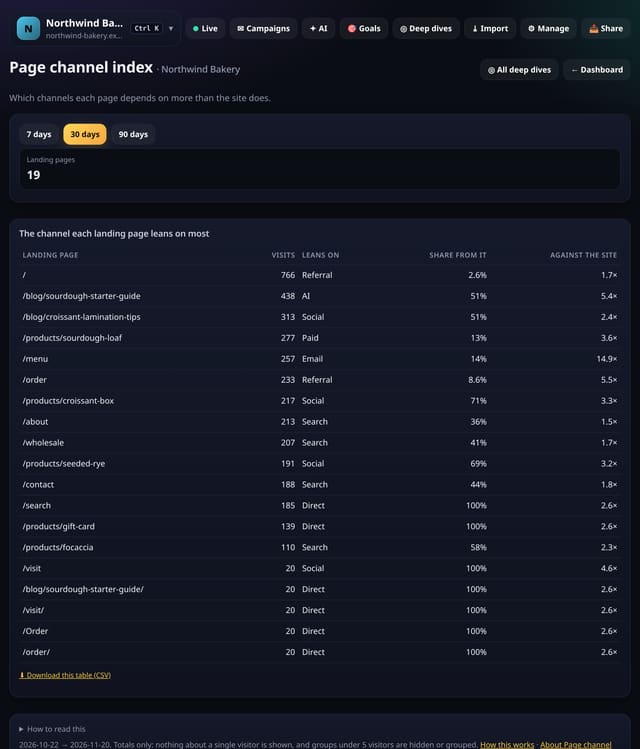
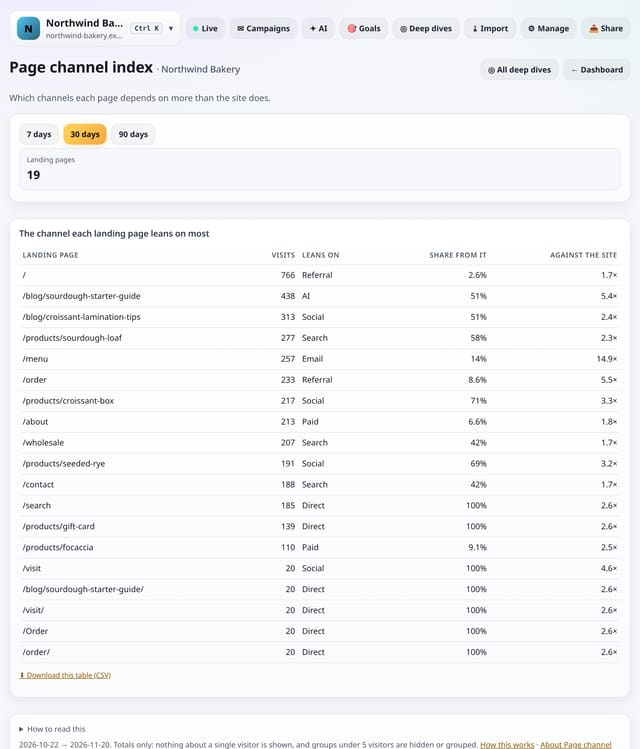
For each landing page, the channel it leans on most compared with your whole site, as an index.
Why use it: A page that gets most of its visits from one channel is at risk if that channel dips.
About Page channel indexHow to use it: Page channel indexQS-500
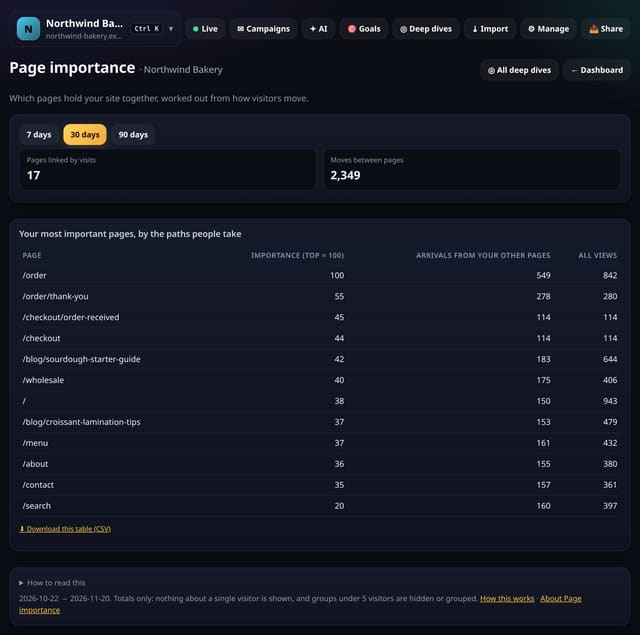
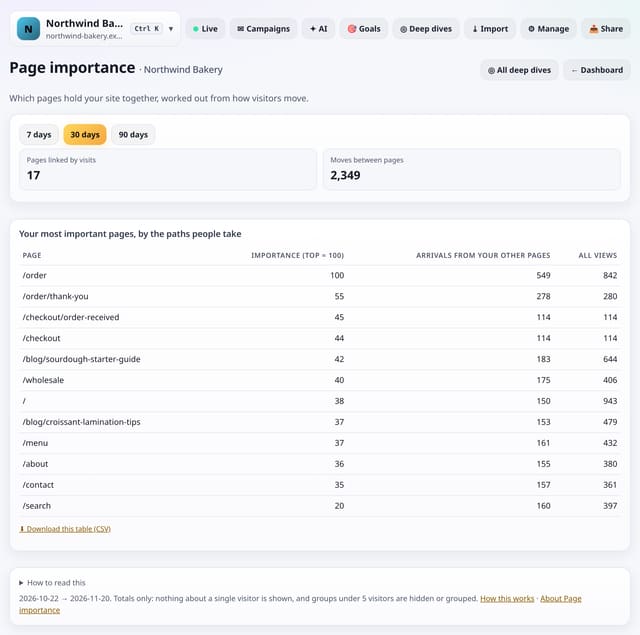
A PageRank-style score for every page, worked out from how visitors actually move between your pages.
Why use it: Pages with high importance are crossroads.
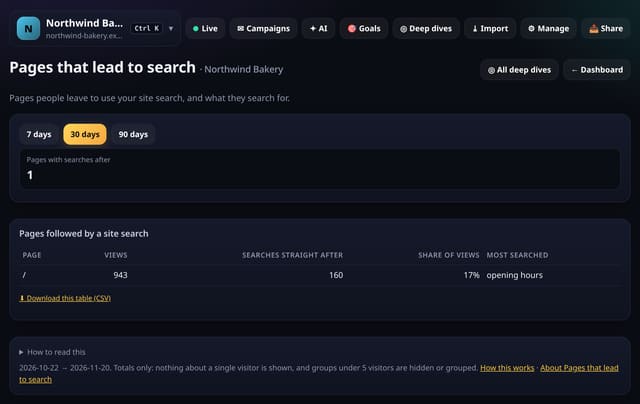
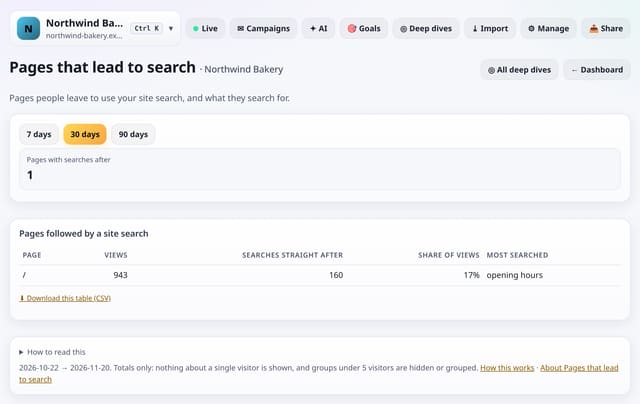
Pages people leave straight for your site search, how often, and what they search for next.
Why use it: A search straight after a page means the page did not answer the question.
About Pages that lead to searchHow to use it: Pages that lead to searchQS-502
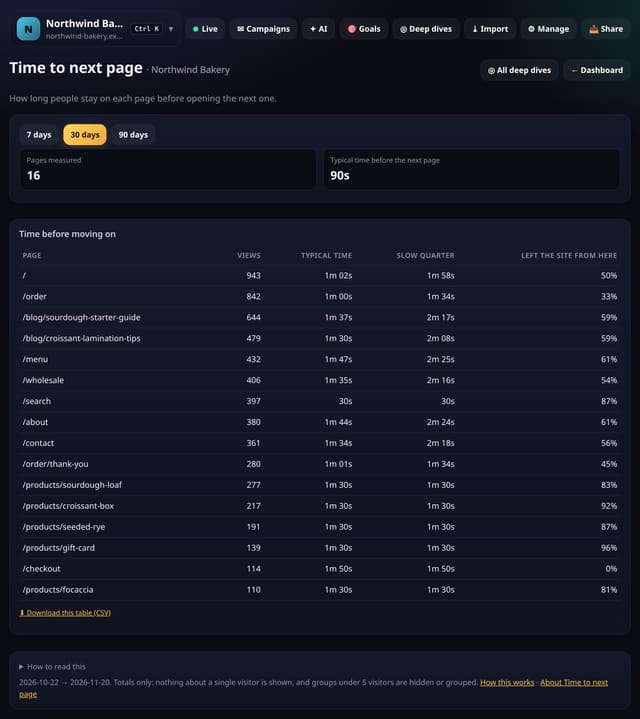
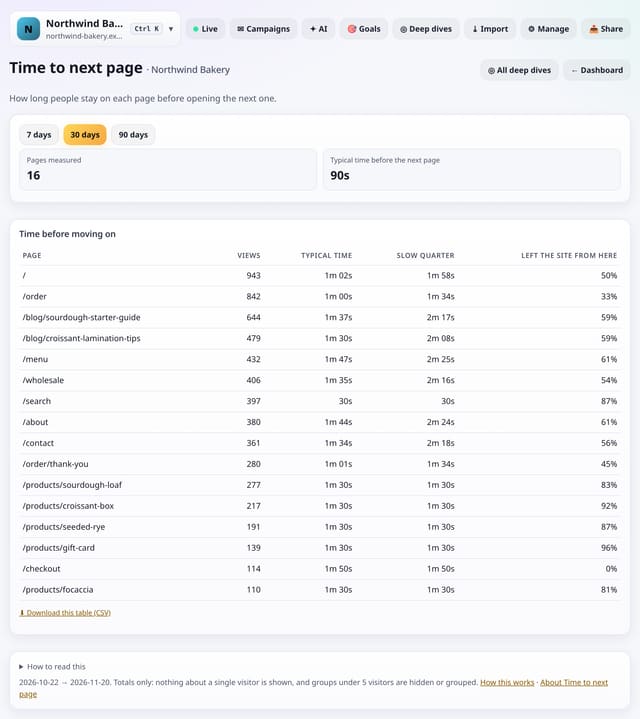
For each page, how long people stay before opening the next page, and how often they leave from it.
Why use it: It works without the engagement add-on.
About Time to next pageHow to use it: Time to next pageQS-503
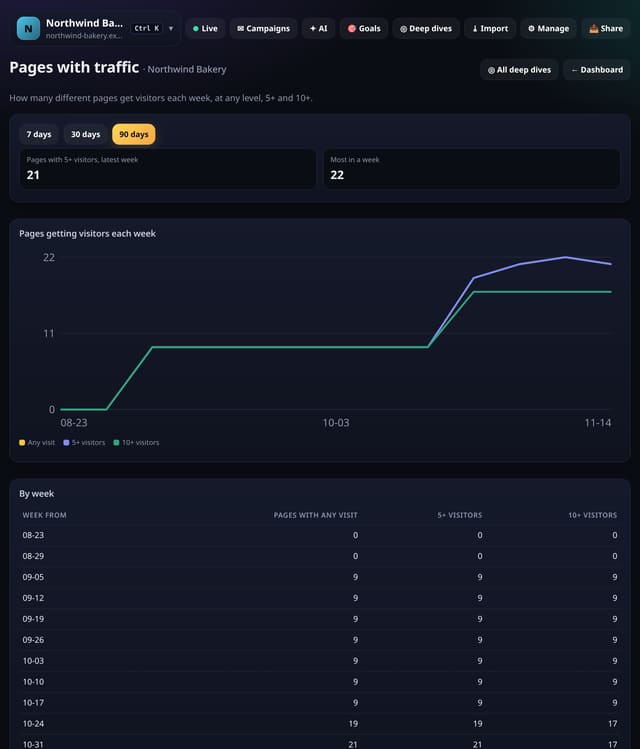
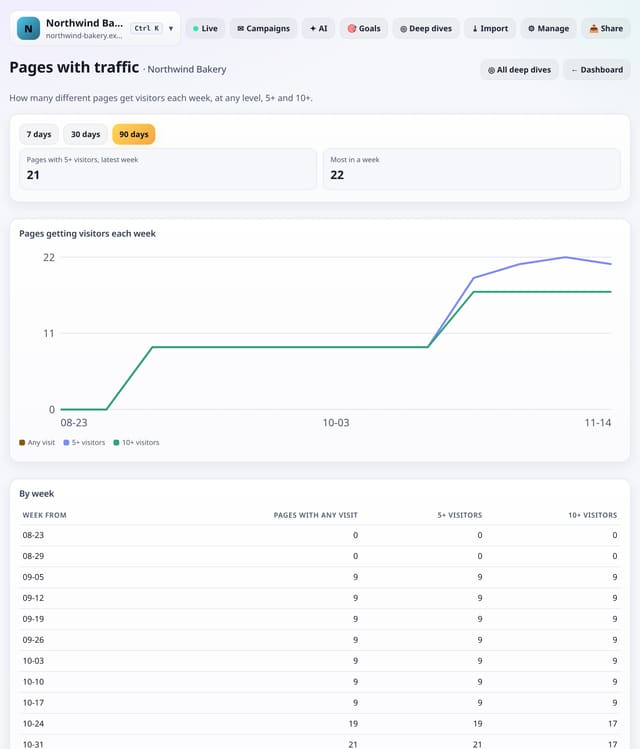
How many different pages got visitors each week: any visitor, 5 or more and 10 or more.
Why use it: A growing count means more of your site is earning its keep.
About Pages with trafficHow to use it: Pages with trafficQS-504
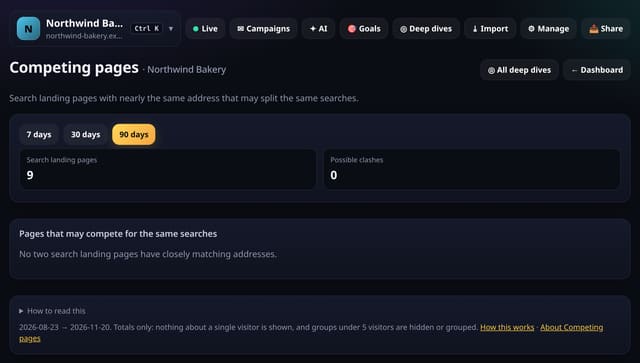
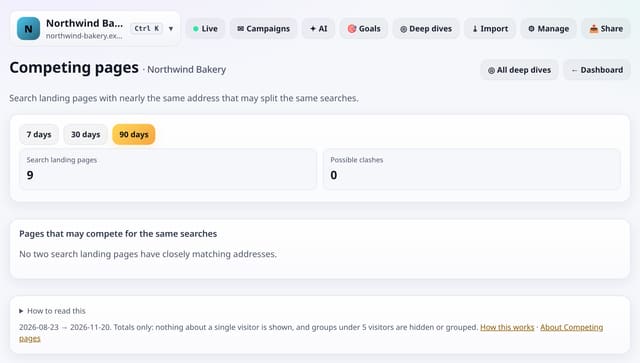
Pairs of search landing pages with nearly the same words in their address, which may be competing for the same searches.
Why use it: Two pages on the same topic can split your search traffic so neither ranks well.
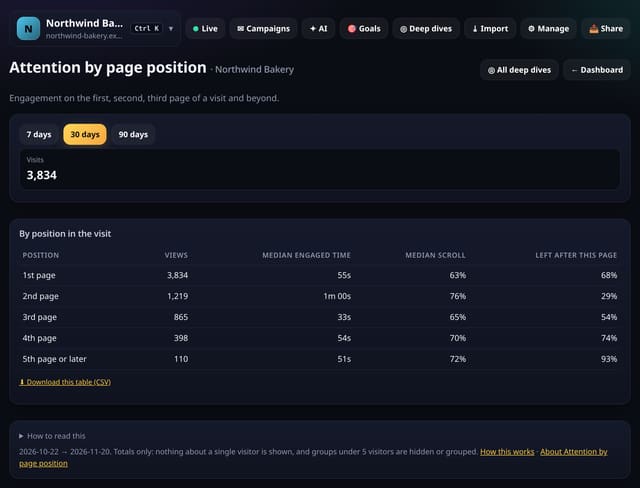
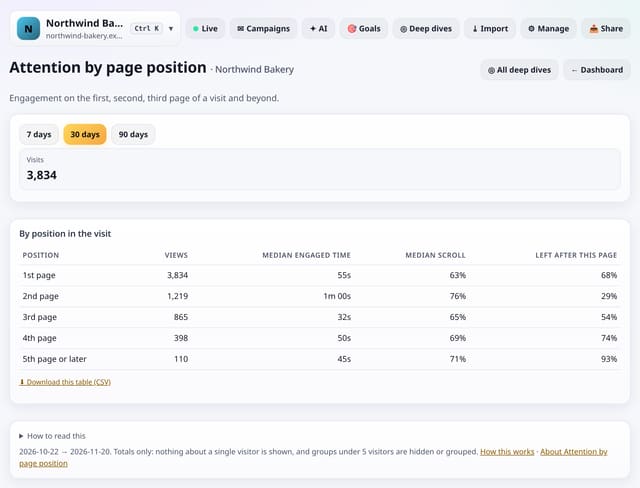
Engaged time, scroll depth and exits for the first, second, third page of a visit and beyond.
Why use it: If the second page holds attention much better than the first, your landing pages are the weak link.
About Attention by page positionHow to use it: Attention by page positionQS-506
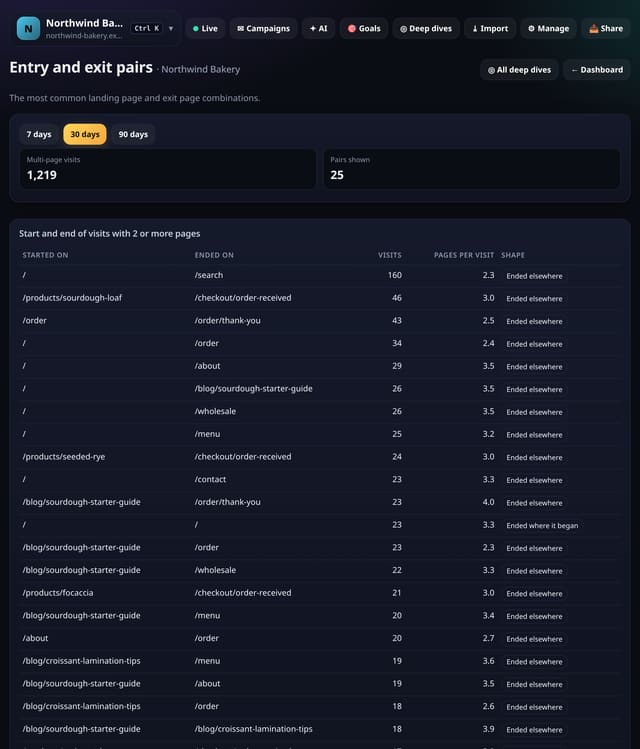
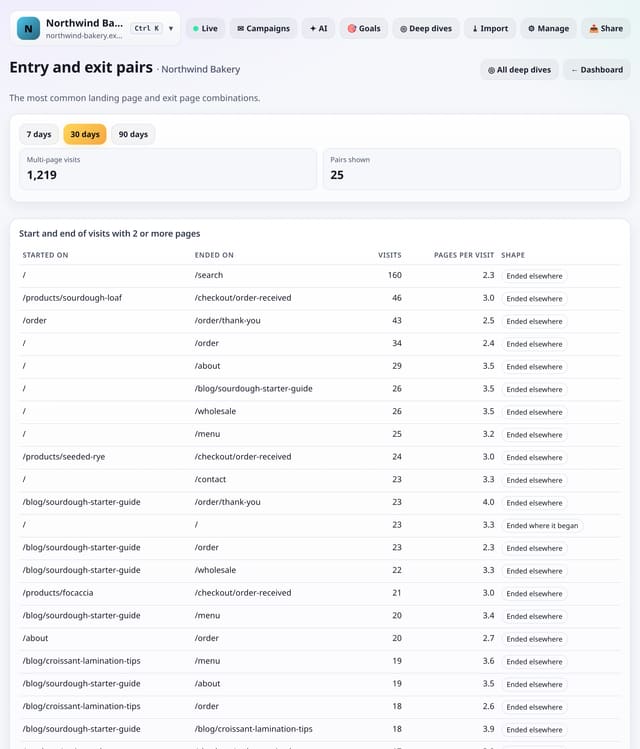
The most common combinations of landing page and last page for visits with 2 or more pages.
Why use it: A common end page that is not a goal is a good place to add a next step.
About Entry and exit pairsHow to use it: Entry and exit pairsQS-507
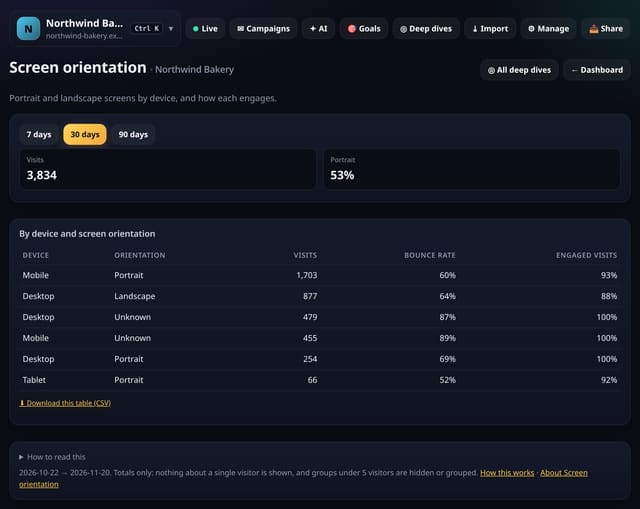
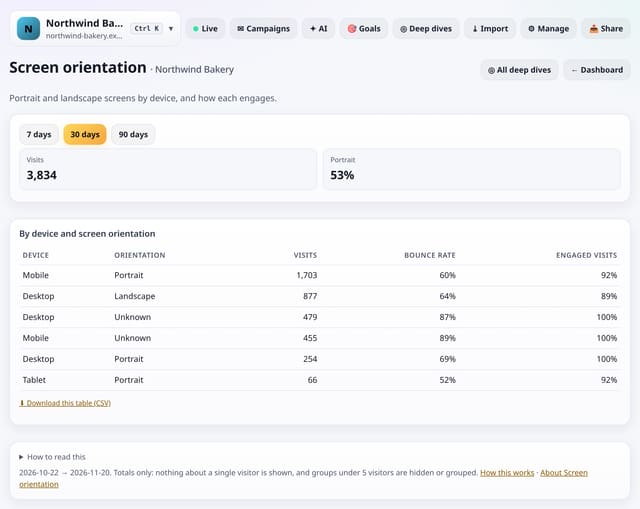
Portrait and landscape screens for each device type, with bounce rate and engaged visits for each.
Why use it: Landscape phones and portrait tablets are easy to forget when testing.
About Screen orientationHow to use it: Screen orientationQS-508
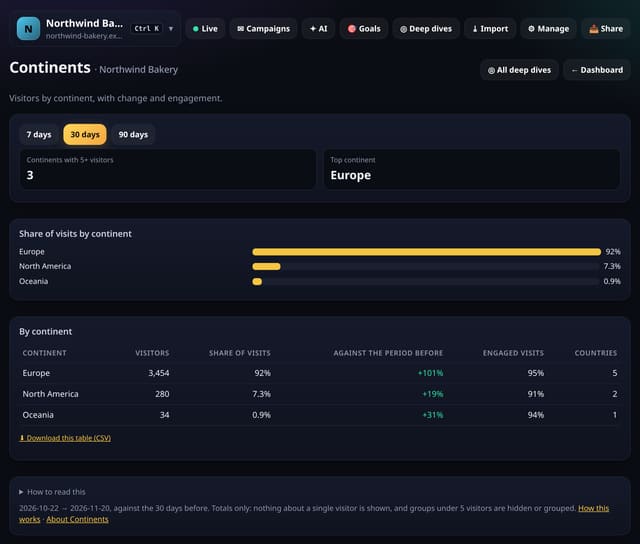
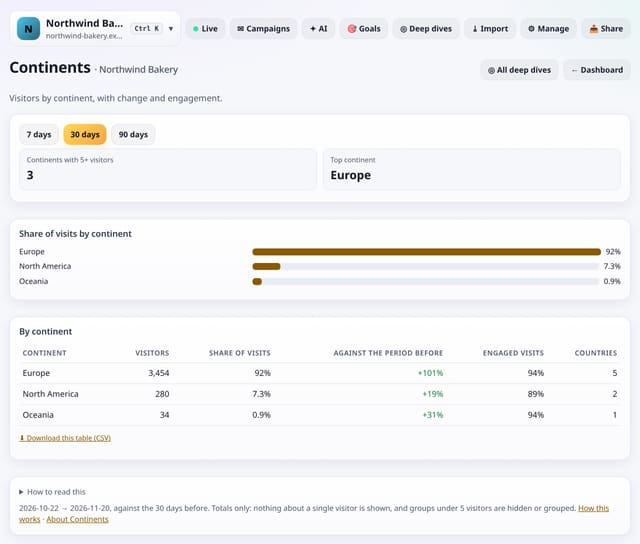
Visitors by continent, with their share, the change against the period before and how engaged they are.
Why use it: Country lists get long.
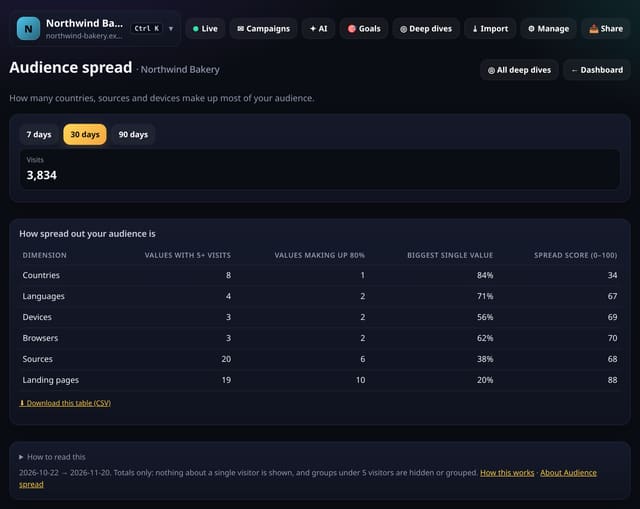
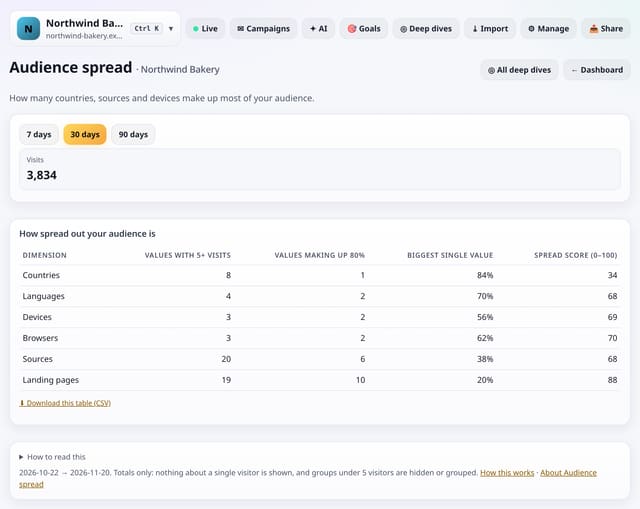
For countries, languages, devices, browsers, sources and landing pages: how many values make up 80% of visits, and a 0–100 spread score.
Why use it: Low spread on sources means you depend on one; rising spread on countries means you are reaching new places.
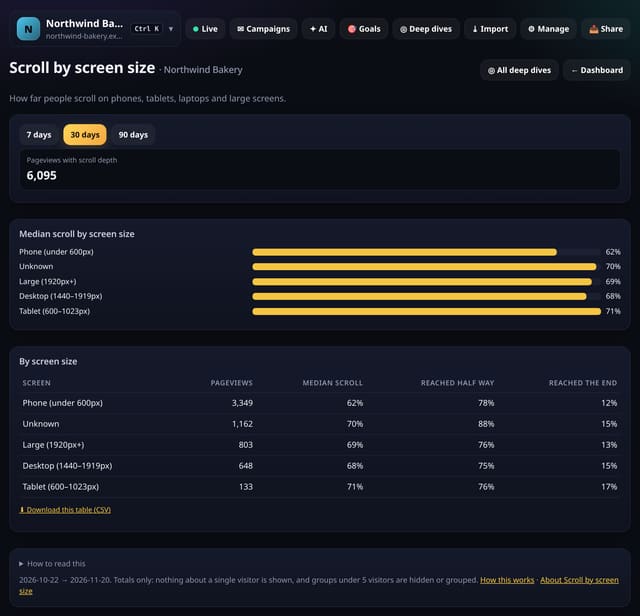
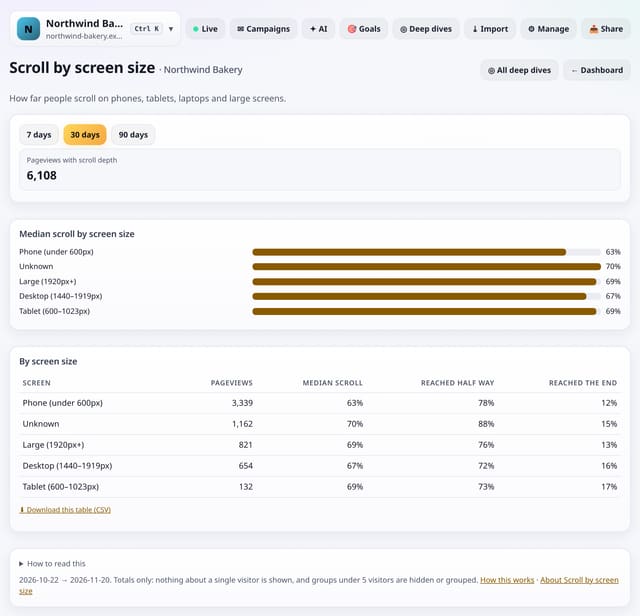
How far people scroll on phones, tablets, laptops, desktops and large screens.
Why use it: If phones scroll much less than laptops, your mobile layout may push the content too far down, or the page may be too long on a small screen.
About Scroll by screen sizeHow to use it: Scroll by screen sizeQS-511
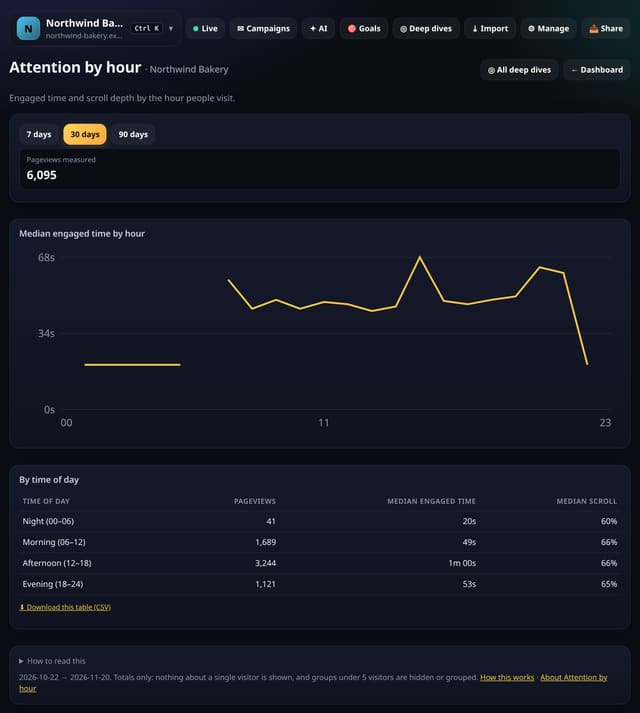
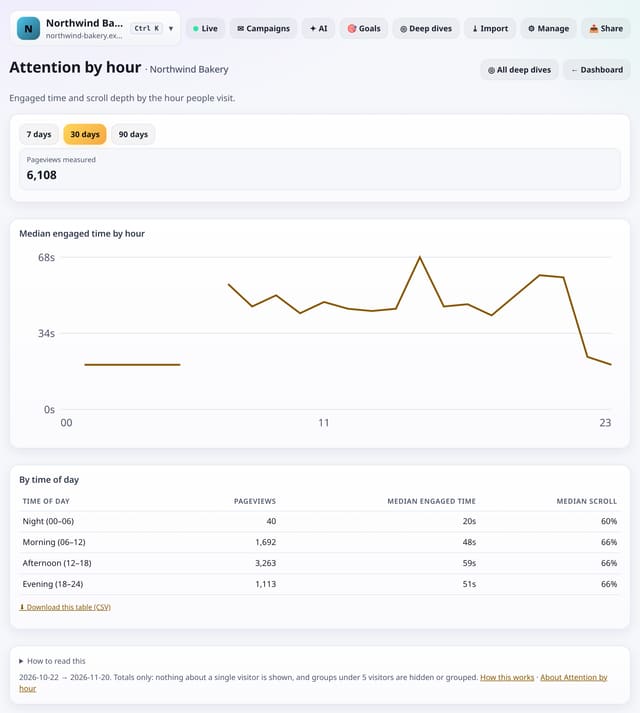
Median engaged time and scroll depth by the hour of day people visit, plus night, morning, afternoon and evening.
Why use it: Busy hours are not always attentive hours.
About Attention by hourHow to use it: Attention by hourQS-512
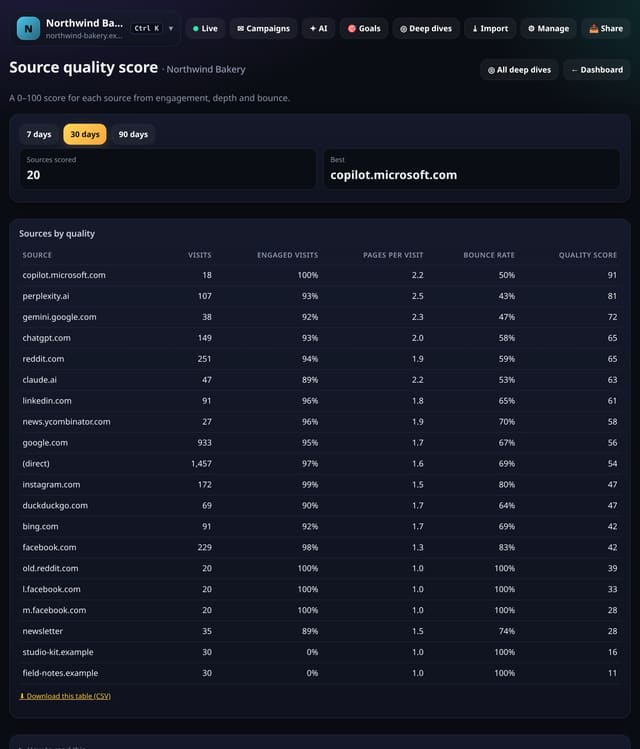
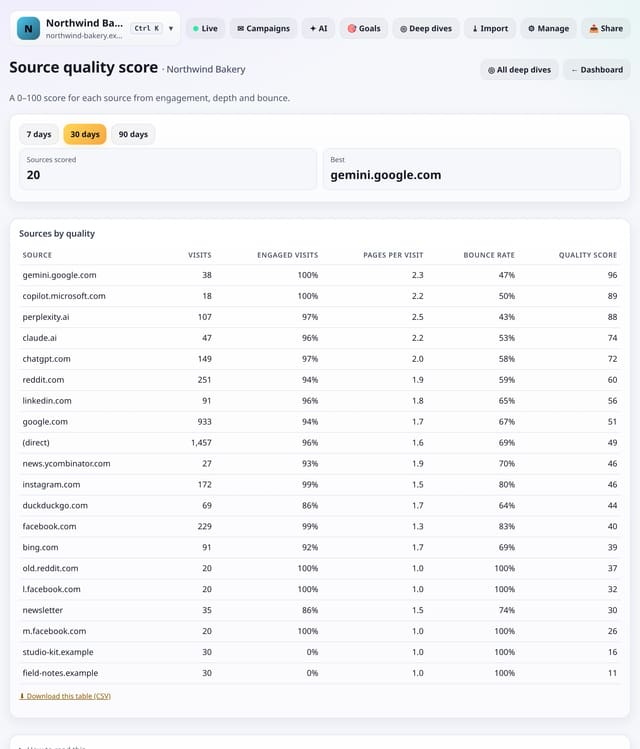
A 0–100 score for each source from three things: engaged visits, pages per visit and bounce rate.
Why use it: Big sources are not always good ones.
About Source quality scoreHow to use it: Source quality scoreQS-513
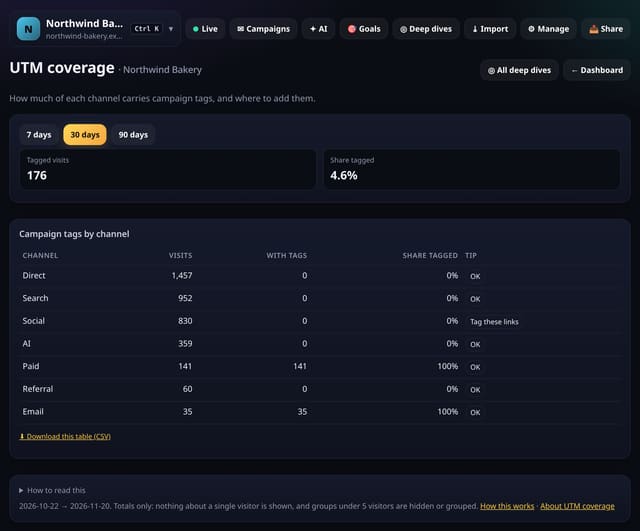
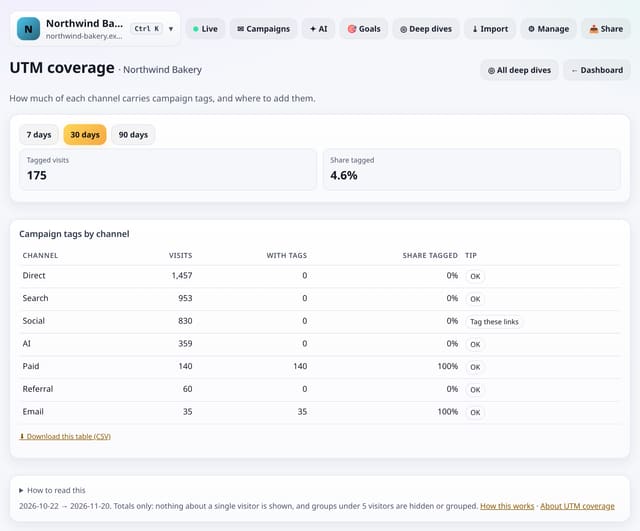
How much of each channel’s traffic carries utm tags, with a tip where tags are missing.
Why use it: Untagged email, social and ad links blur into Direct and Referral.
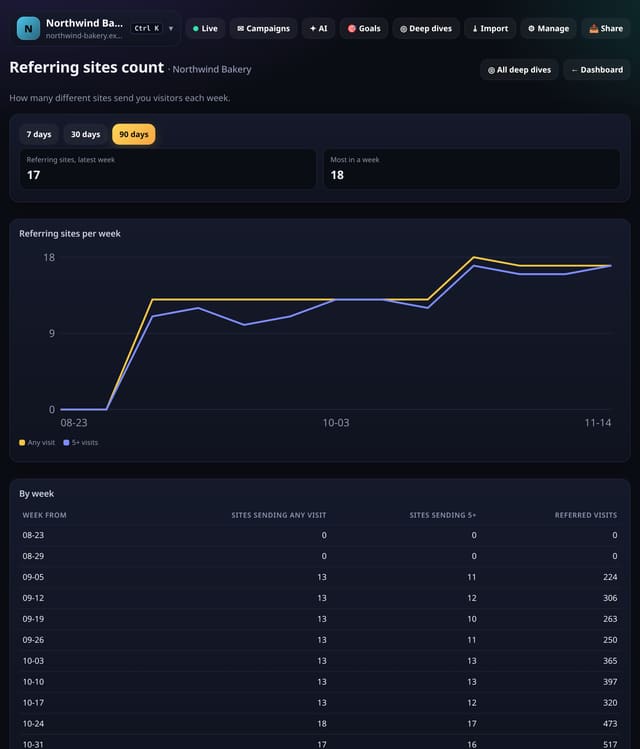
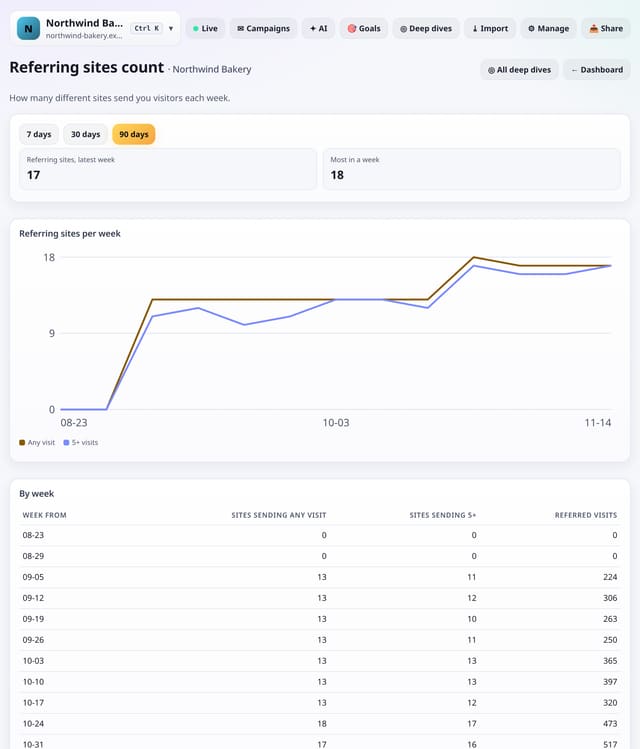
The number of different sites that sent you visitors each week, at any level and with 5 or more visits.
Why use it: A rising count is a sign your links are spreading across the web.
About Referring sites countHow to use it: Referring sites countQS-515
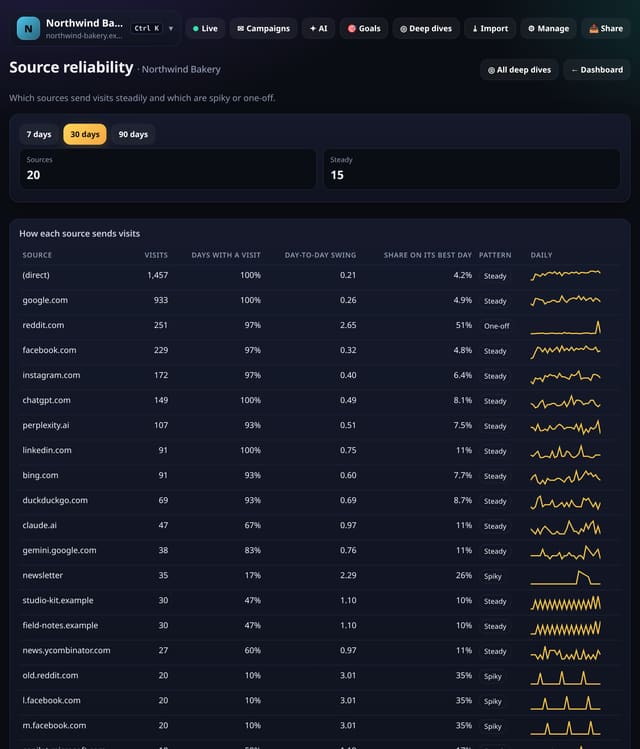
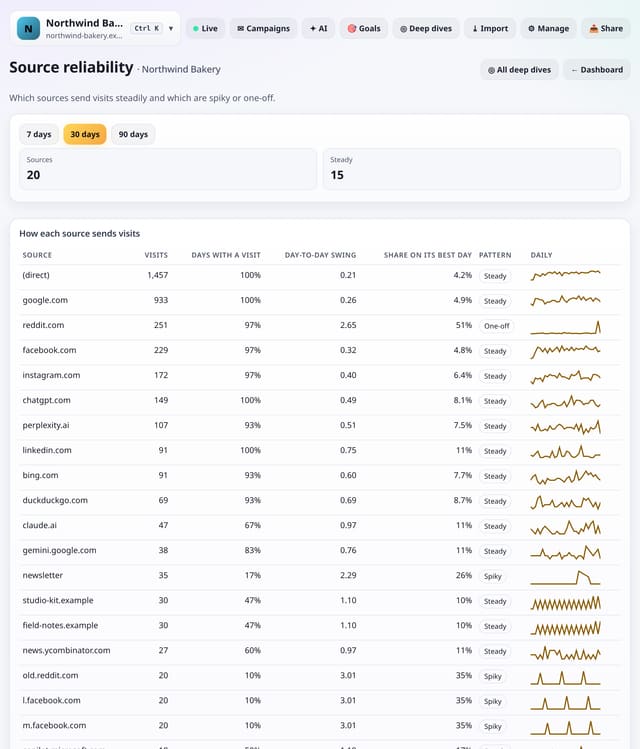
Which sources send visits steadily, which are spiky and which were a one-off, with a daily chart for each.
Why use it: Steady sources are the ones to build on.
About Source reliabilityHow to use it: Source reliabilityQS-516
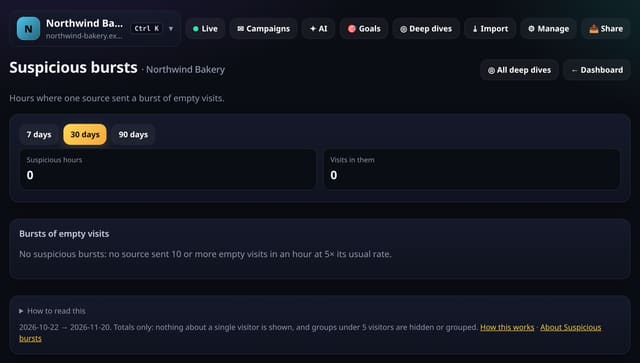
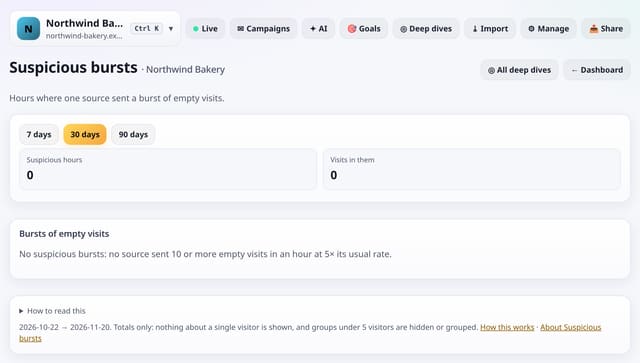
Hours in which one source sent 10 or more visits, nearly all empty, at 5 times its usual rate.
Why use it: Known bots are filtered when visits arrive, but some slip through.
About Suspicious burstsHow to use it: Suspicious burstsQS-517
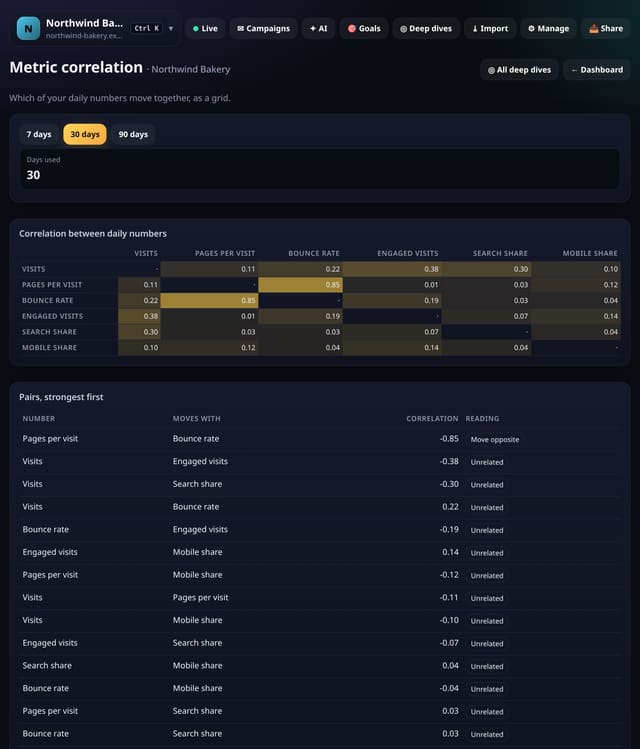
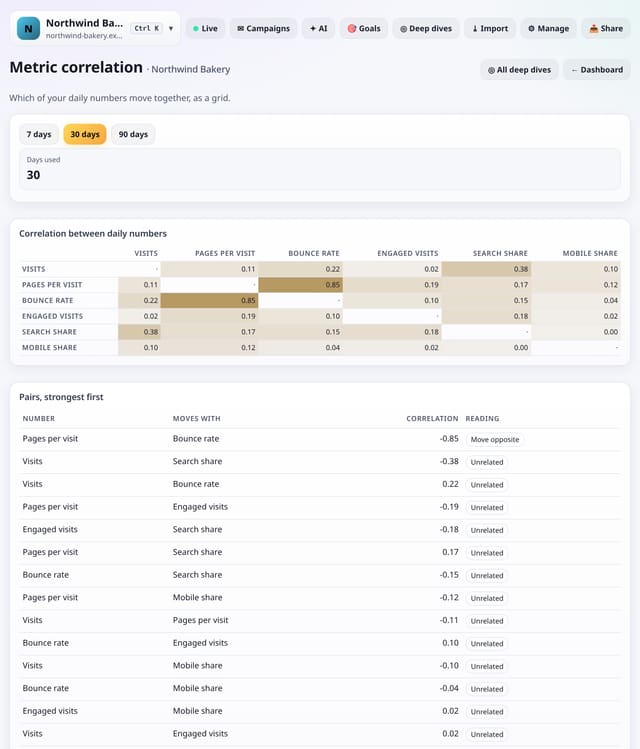
A grid showing how strongly six daily numbers move together: visits, pages per visit, bounce rate, engaged visits, search share and mobile share.
Why use it: If bounce rate rises on days when mobile share rises, your mobile pages need work.
About Metric correlationHow to use it: Metric correlationQS-518
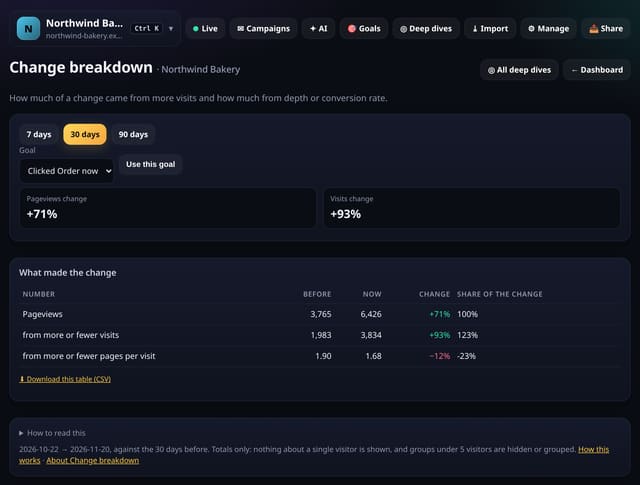
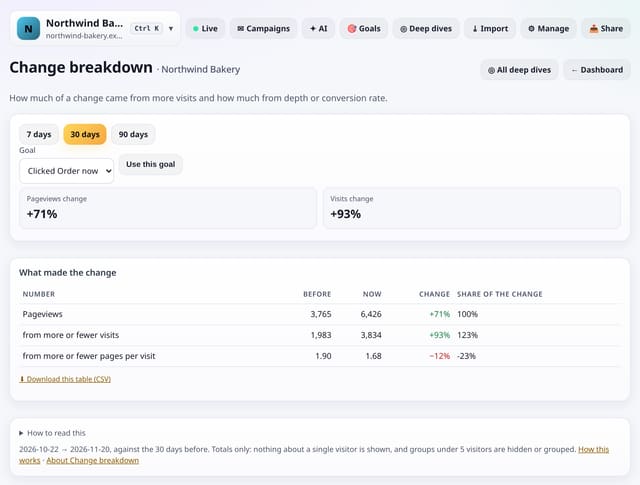
How much of a change in pageviews came from more visits and how much from more pages per visit, and the same for conversions with a goal.
Why use it: A rise in pageviews from more visits is a marketing win; a rise from deeper visits is a content win.
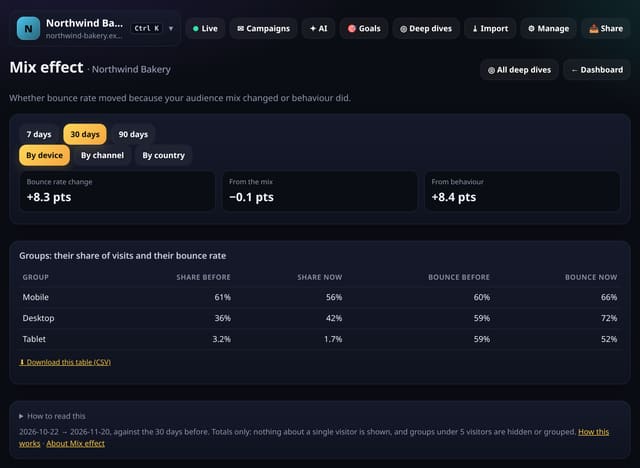
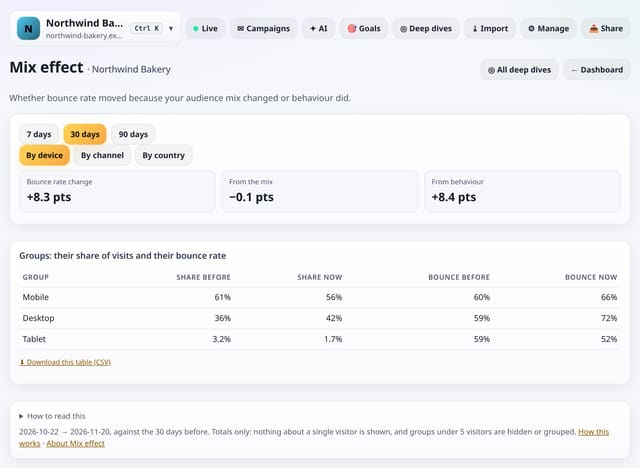
Whether your bounce rate moved because the mix of devices, channels or countries changed, or because people behaved differently.
Why use it: A rising bounce rate is alarming until you see it is all mix: more phone visits, which always bounce more.
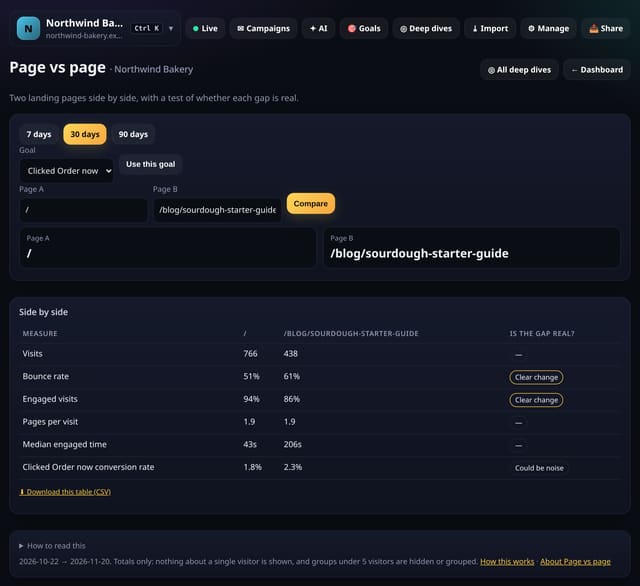
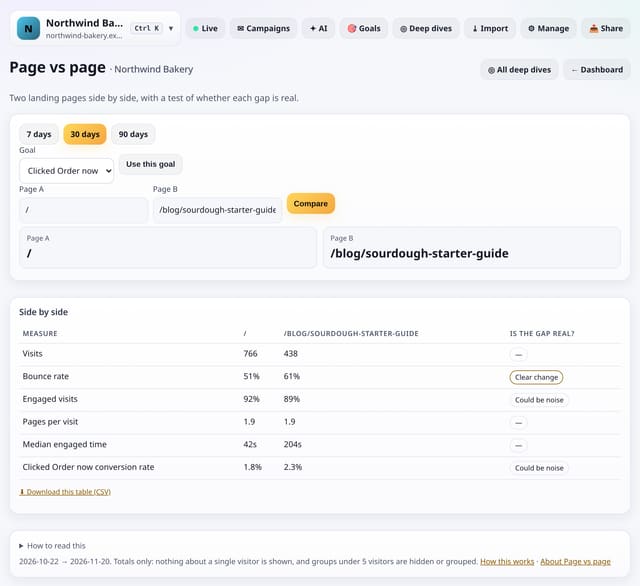
Type two landing pages to compare visits, bounce rate, engaged visits, pages per visit, engaged time and conversion rate, with a test of whether each gap is real.
Why use it: It is the quick way to settle “is the new landing page better?” without setting up an A/B test.
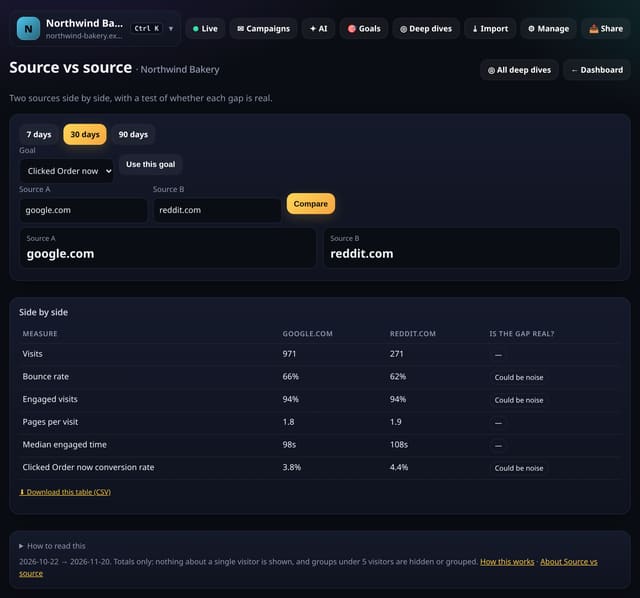
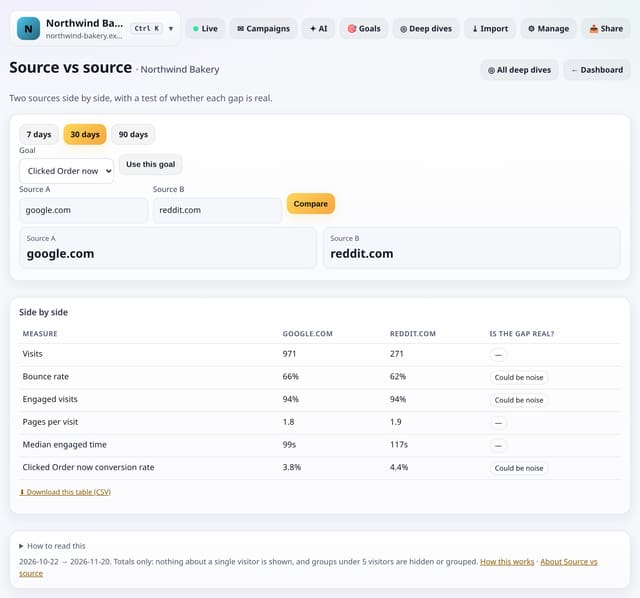
Type two sources to compare visits, bounce rate, engaged visits, pages per visit, engaged time and conversion rate, with a test of whether each gap is real.
Why use it: Settles questions like “is LinkedIn better than Facebook for us?” with a fair test instead of a guess.
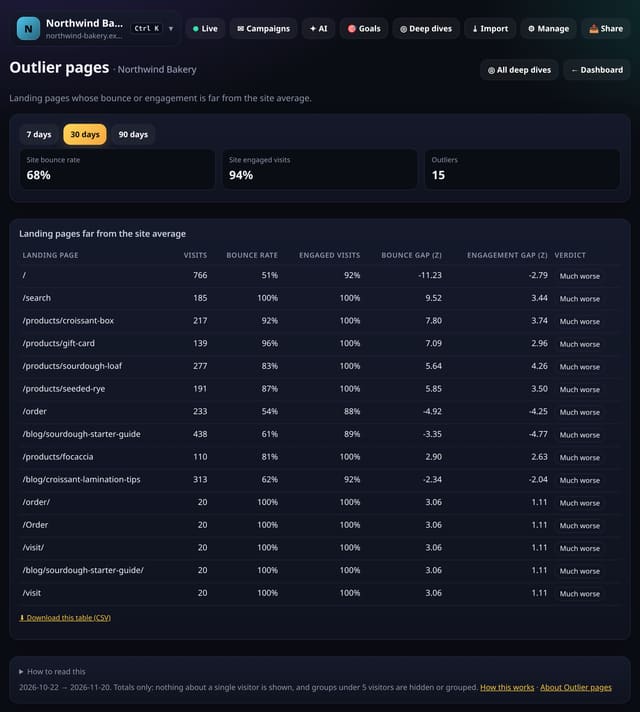
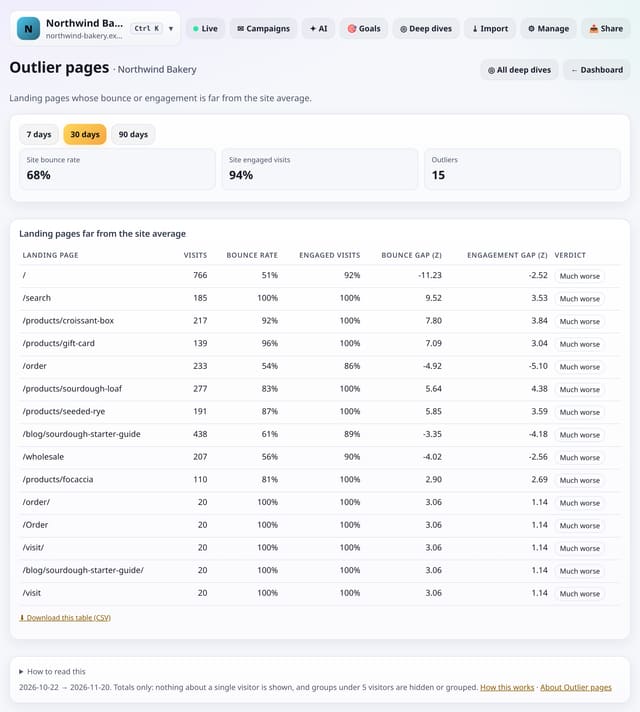
Landing pages whose bounce rate or engaged visits are far better or worse than the rest of your site.
Why use it: Copy what the much-better pages do; fix the much-worse ones first.
Added later in the evening: 50 more screens in Deep dives → Analysis lab, none of them repeats of earlier ones. They answer sharper questions: which landing page has the best chance to be best (a Bayesian test), whether your traffic or conversion trend is really rising, how long spikes take to settle, which sources and channels move together or lead each other, where visits end (a survival curve), which splits are tied together (chi-square), whether a bounce change is real or just the mix (Simpson’s paradox), and how many days you need for a reliable number. Same rules as everything else: no cookies, no IP addresses, totals only, groups under 5 hidden, nothing new collected and the tracking script unchanged.
Open any of them from Deep dives → Analysis lab. Screens that need a goal use your first goal until you pick another.
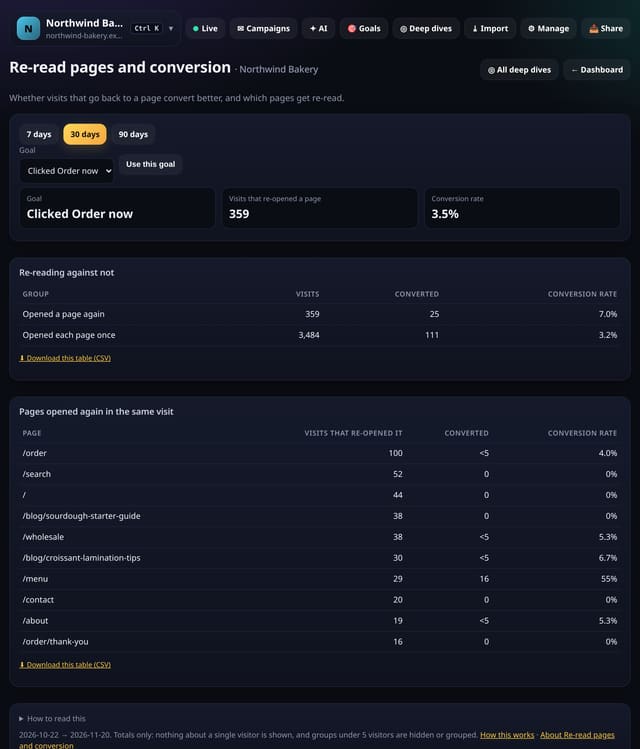
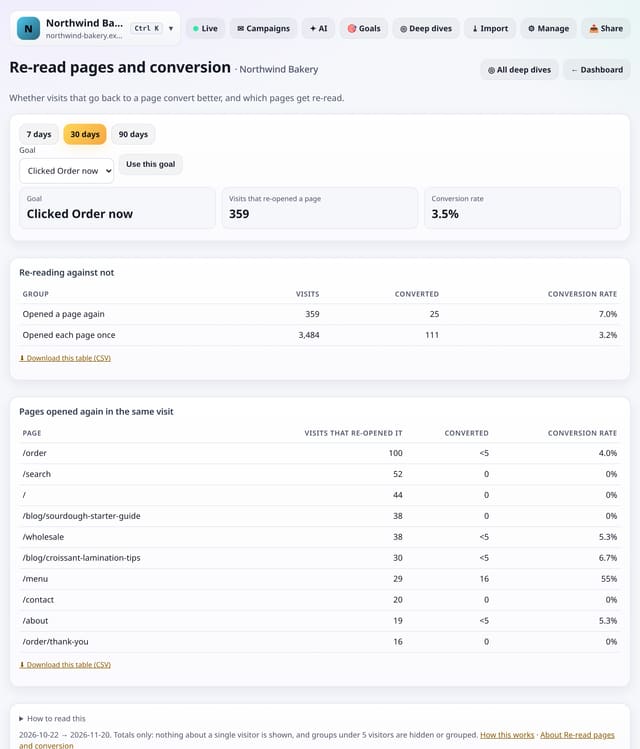
Whether visits that open the same page twice convert better than visits that do not, and which pages people go back to.
Why use it: Going back to a page such as pricing, a size guide or delivery times often means someone is close to deciding.
About Re-read pages and conversionHow to use it: Re-read pages and conversionQS-525
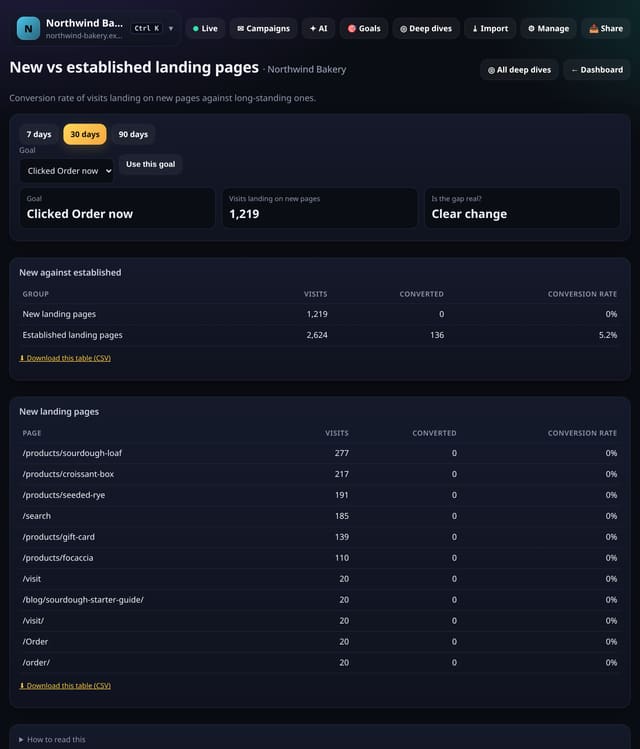
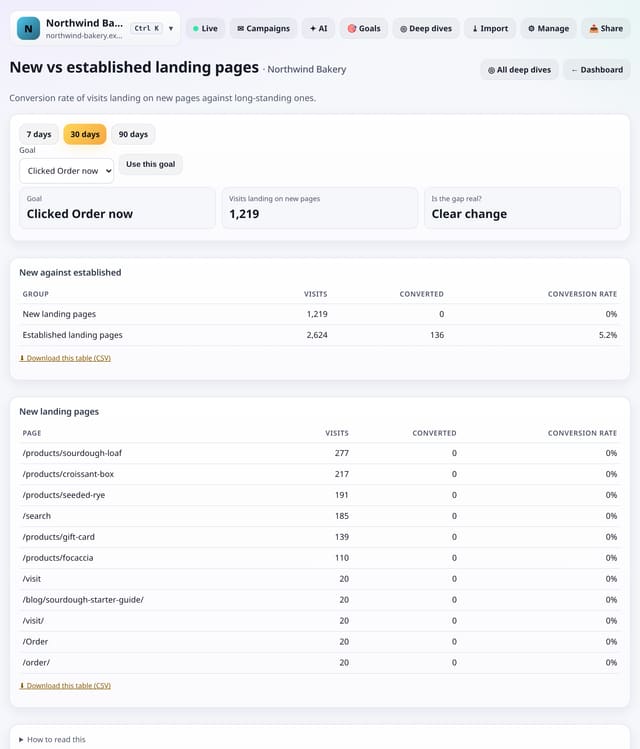
The conversion rate of visits that land on pages new in this range, against visits that land on pages you already had.
Why use it: New posts and pages often bring traffic, but do they bring customers?
About New vs established landing pagesHow to use it: New vs established landing pagesQS-526
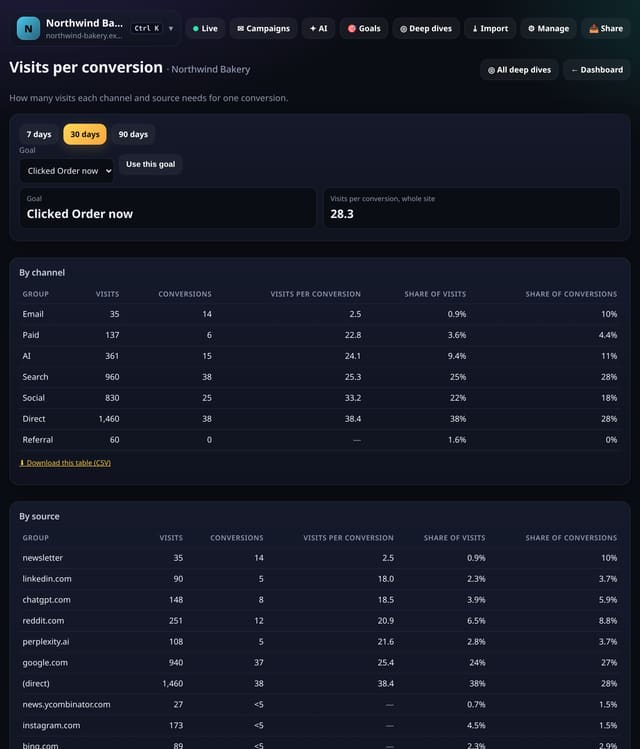
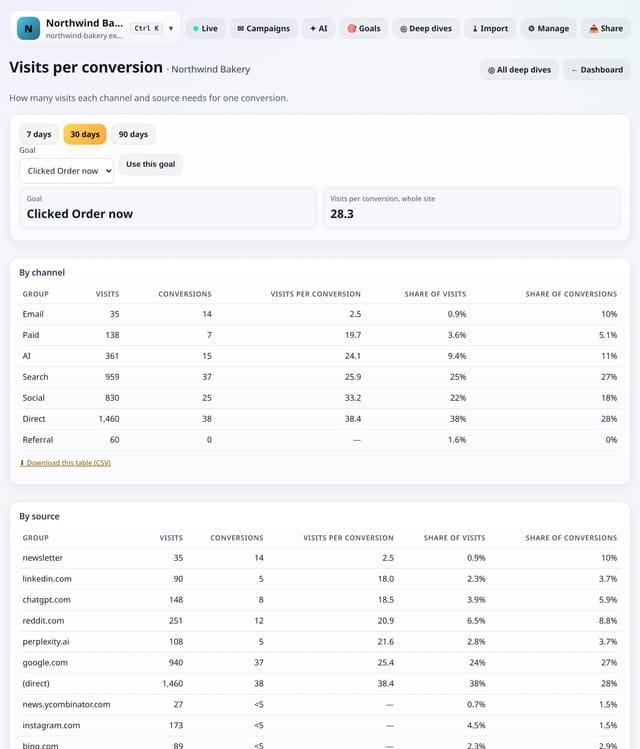
How many visits each channel and source needs for one conversion, with its share of visits against its share of conversions.
Why use it: A rate of 3% and “one in 33 visits” are the same number, but the second is easier to plan with: it tells you how much traffic you need from a source to win one more customer.
About Visits per conversionHow to use it: Visits per conversionQS-527
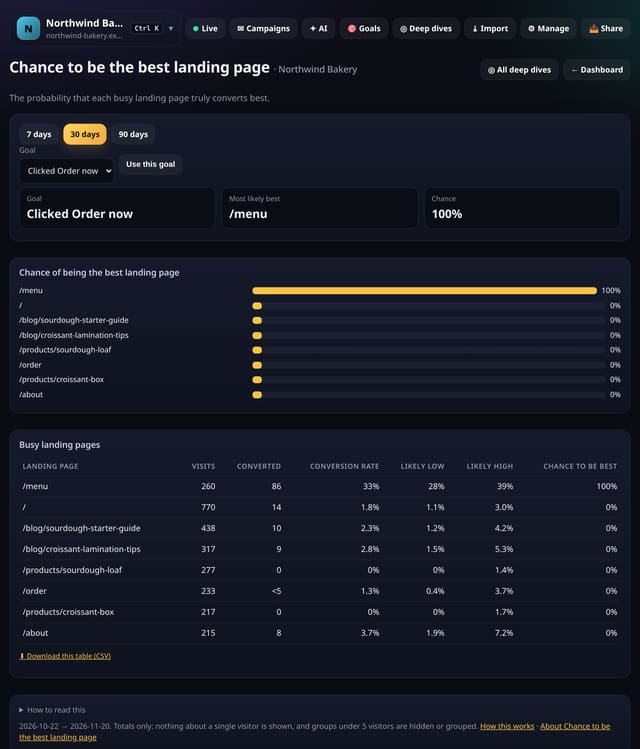
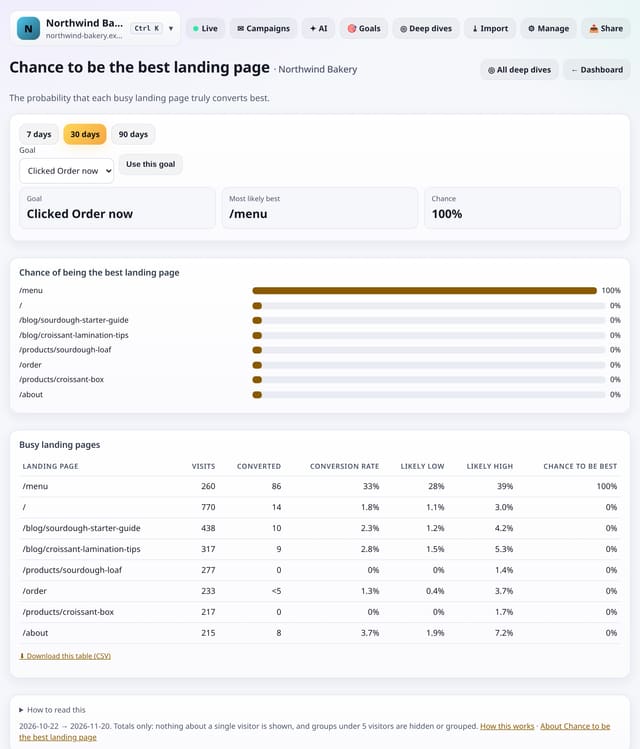
For your busy landing pages, the probability that each one truly has the highest conversion rate, worked out with a Bayesian model.
Why use it: A page with 3 conversions from 20 visits looks better than one with 40 from 400, but you cannot be sure yet.
About Chance to be the best landing pageHow to use it: Chance to be the best landing pageQS-528
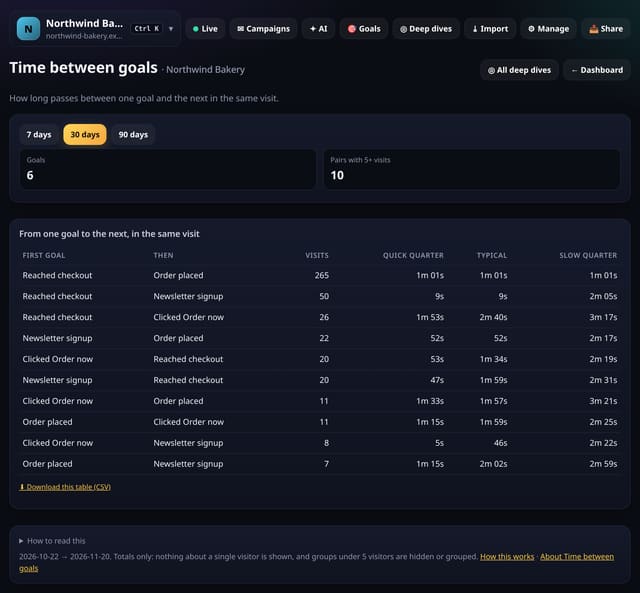
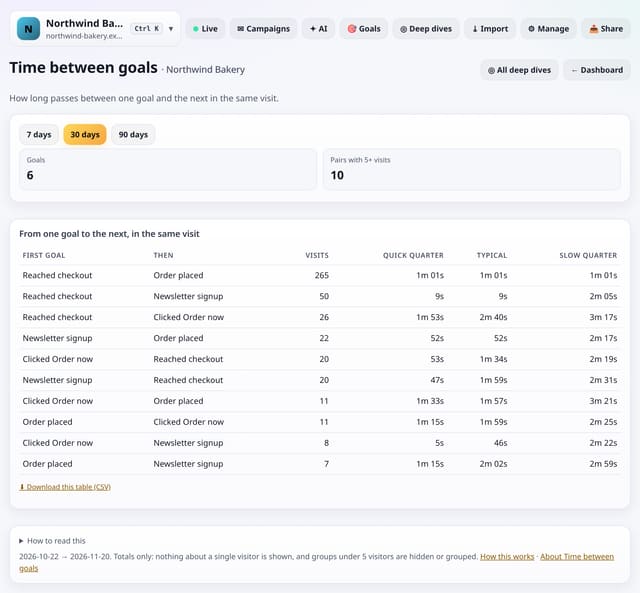
For every pair of goals reached in the same visit, how long passed between the first and the second: quick, typical and slow.
Why use it: A long gap between “Added to basket” and “Paid” points to a slow or confusing checkout; a gap of seconds means the steps flow well.
About Time between goalsHow to use it: Time between goalsQS-529
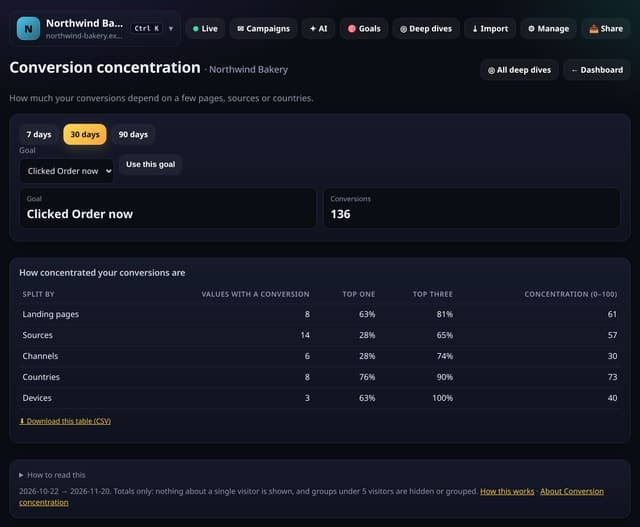
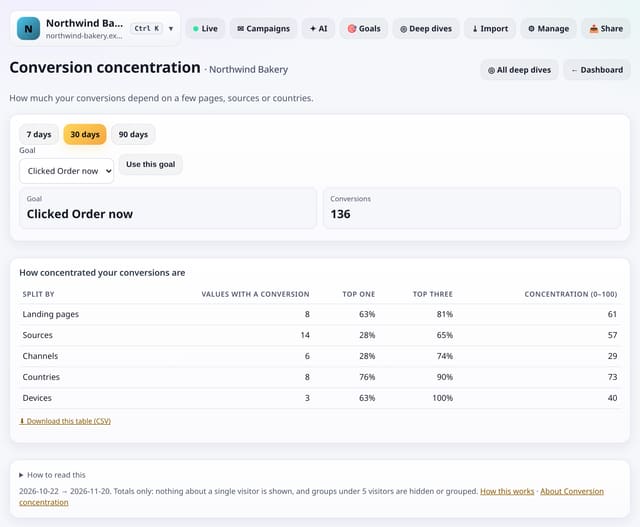
How evenly your conversions are spread across landing pages, sources, channels, countries and devices, as a 0–100 score.
Why use it: If one source brings most of your conversions and it dries up, so do your sales.
About Conversion concentrationHow to use it: Conversion concentrationQS-530
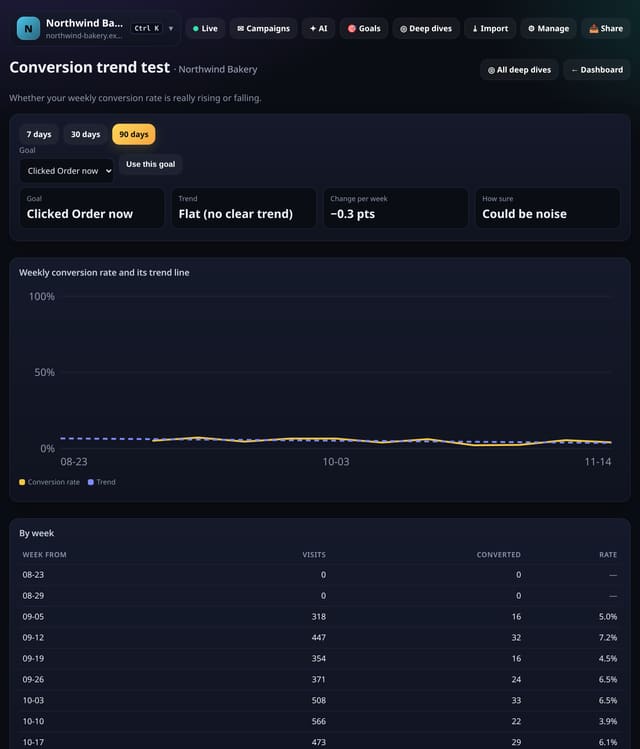
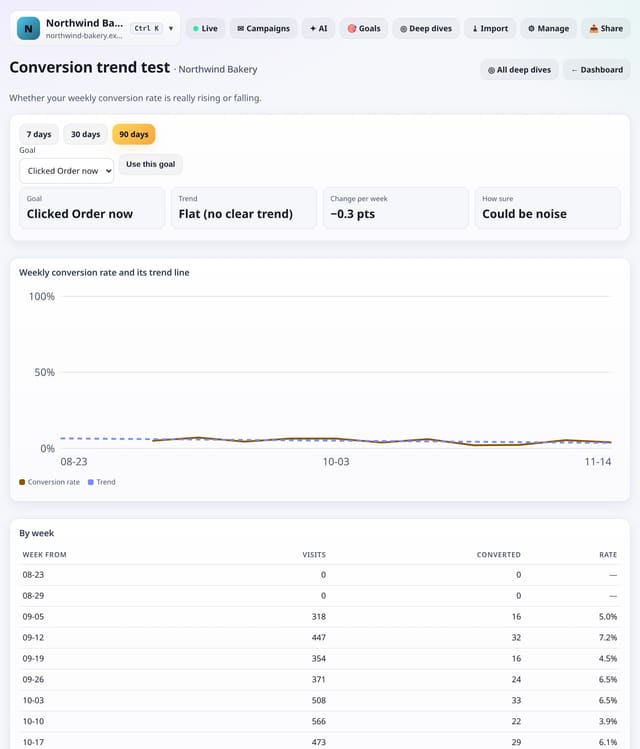
A straight-line trend through your weekly conversion rate, with a test of whether the rise or fall is more than noise.
Why use it: Weekly rates jump around.
About Conversion trend testHow to use it: Conversion trend testQS-531
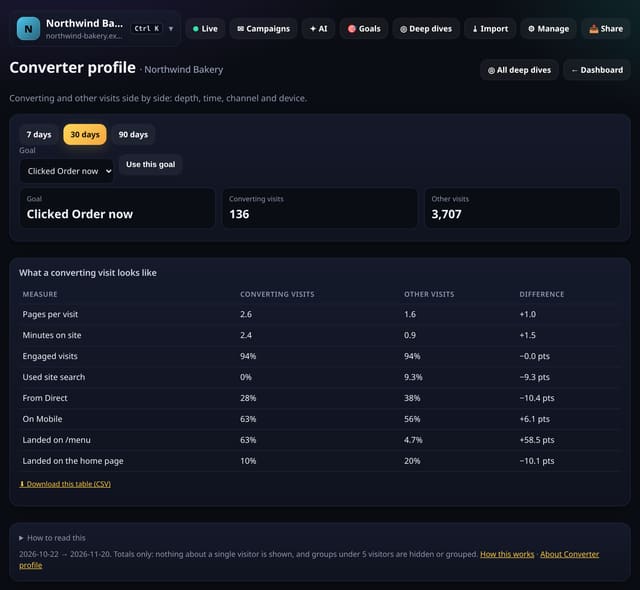
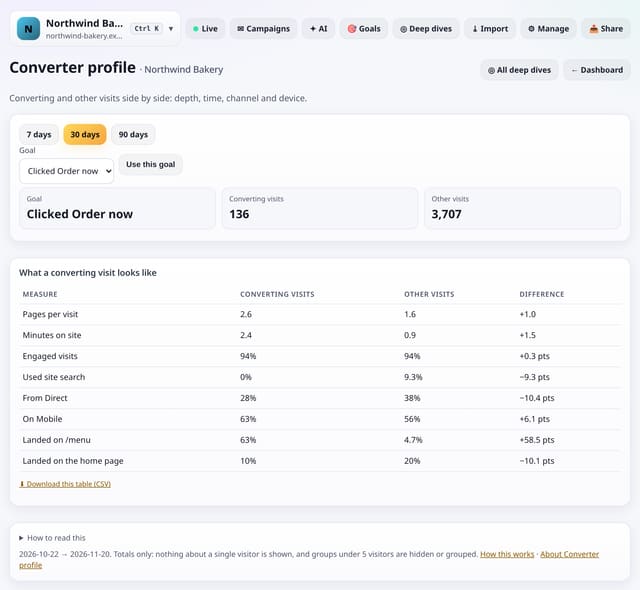
Converting visits and all other visits side by side: pages, minutes, engagement, site search, and converters’ top channel, device and landing page.
Why use it: It shows the typical path to a sale in one table, so you can make more visits look like converting ones.
About Converter profileHow to use it: Converter profileQS-532
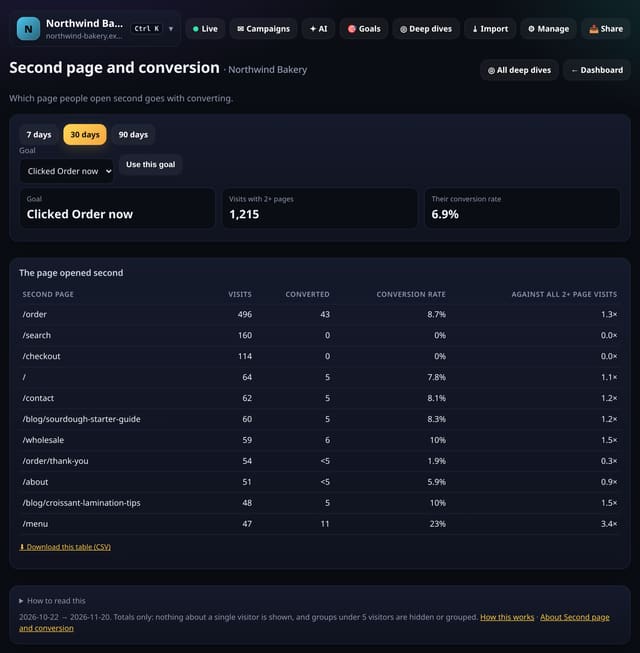
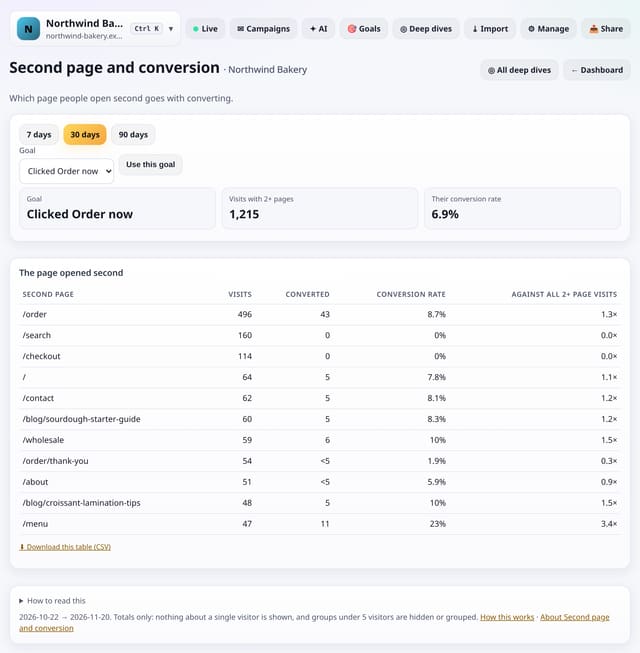
Which page people open second, and how well visits with each second page convert compared with all visits that saw two or more pages.
Why use it: The first click after landing says a lot about intent.
About Second page and conversionHow to use it: Second page and conversionQS-533
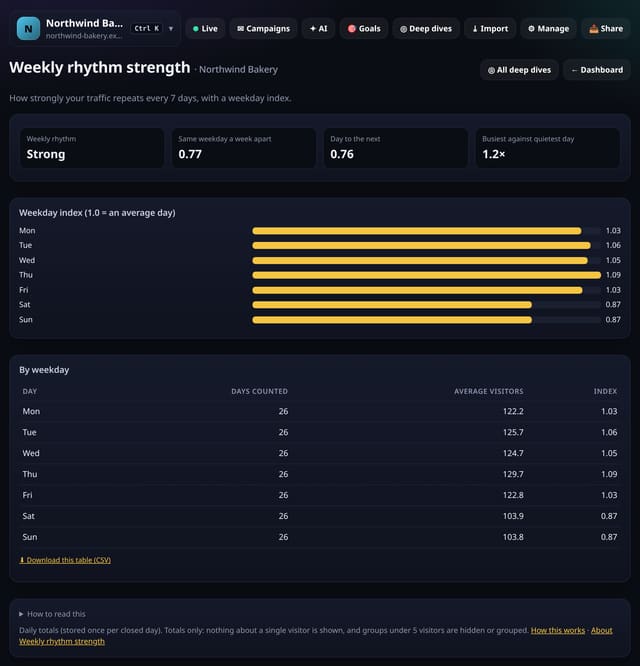
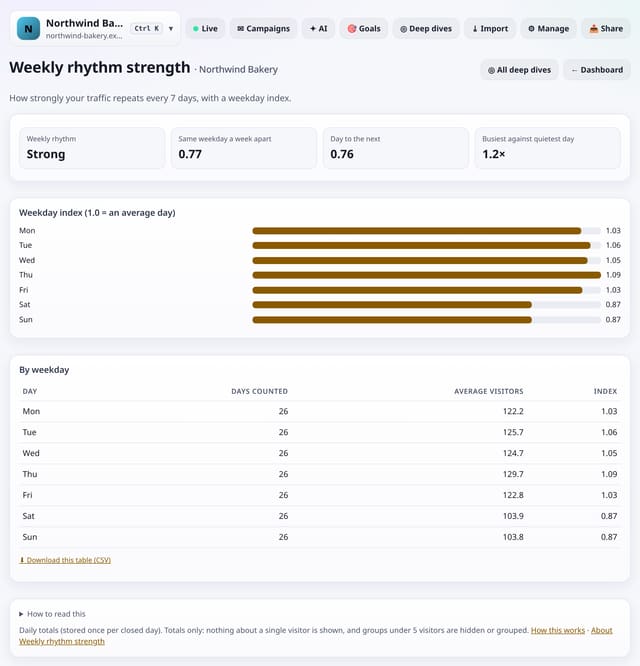
How strongly your traffic repeats every 7 days, with an index for each weekday against an average day.
Why use it: If your week repeats strongly, weekday patterns are worth planning around: post, send and staff for the busy days.
About Weekly rhythm strengthHow to use it: Weekly rhythm strengthQS-534
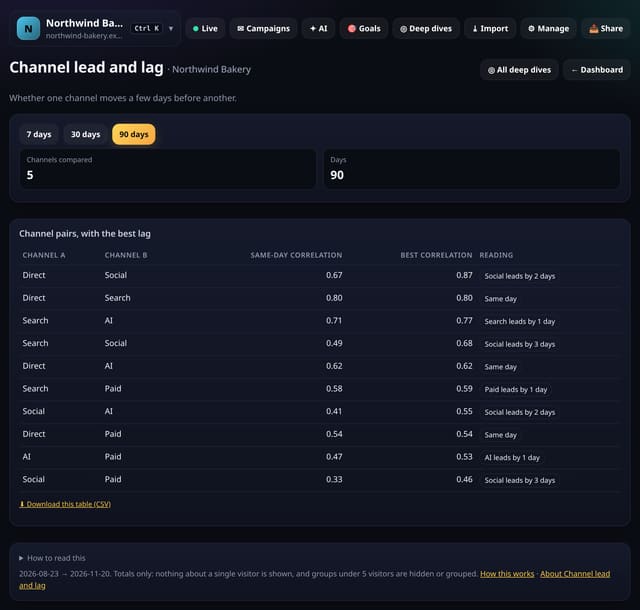
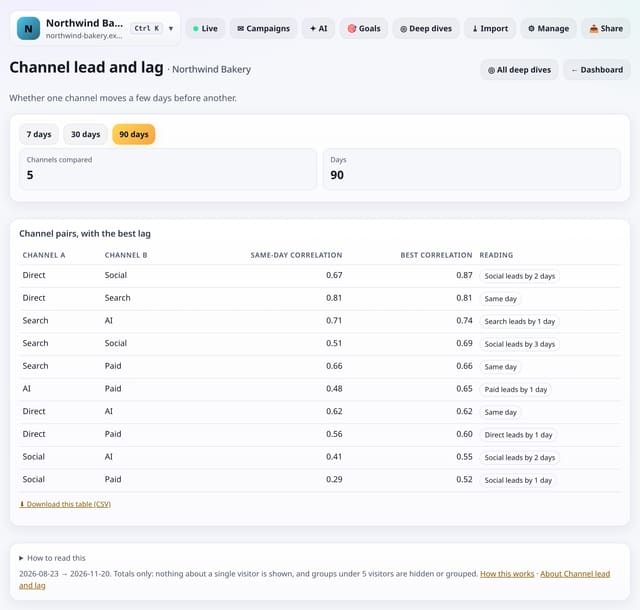
For your top channels, whether daily visits from one rise a few days before another’s, such as social before search.
Why use it: If social posts are followed by more searches for you two days later, your posts are working harder than their own clicks show.
About Channel lead and lagHow to use it: Channel lead and lagQS-535
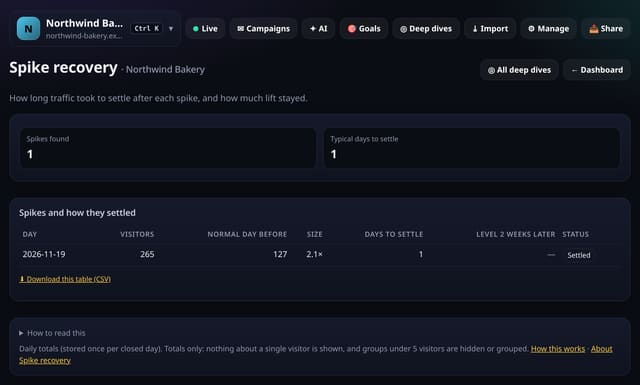
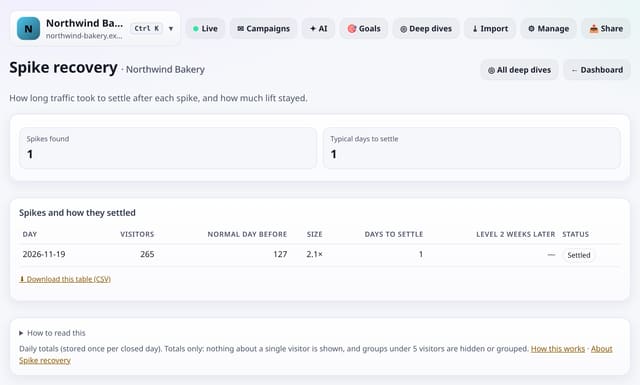
Every traffic spike in your stored history, how big it was, how many days traffic took to settle and whether it left you with more traffic.
Why use it: Some spikes vanish overnight; others leave a lasting lift.
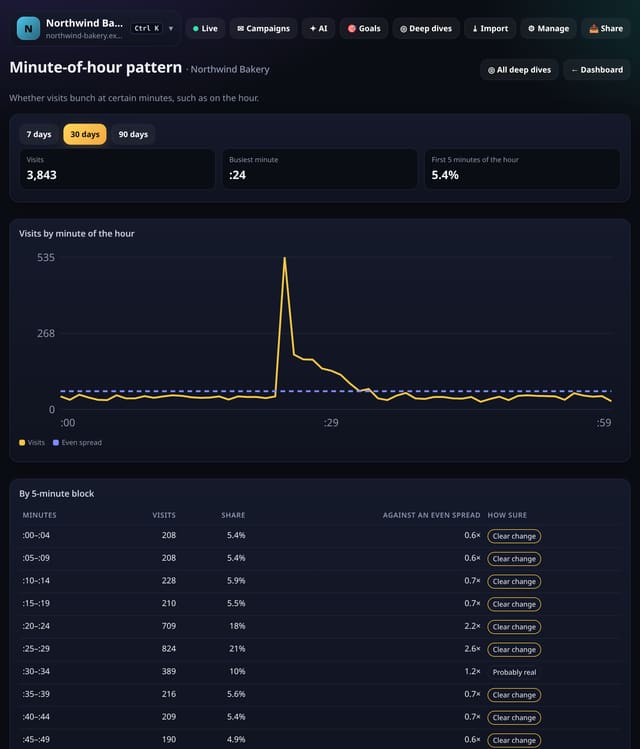
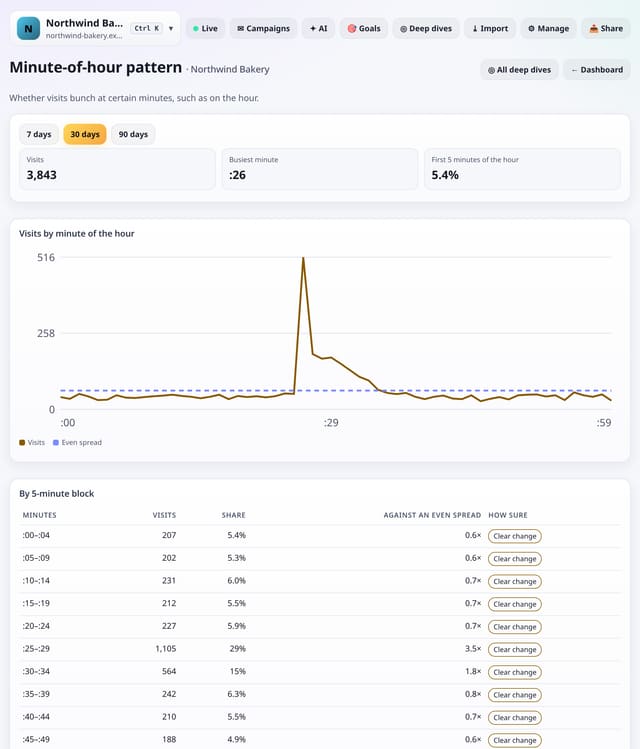
Visits by minute past the hour, against an even spread, to show bunching from scheduled posts, emails or automated checks.
Why use it: Bunching on the hour usually comes from scheduled posts and newsletters, or from automated checks.
About Minute-of-hour patternHow to use it: Minute-of-hour patternQS-537
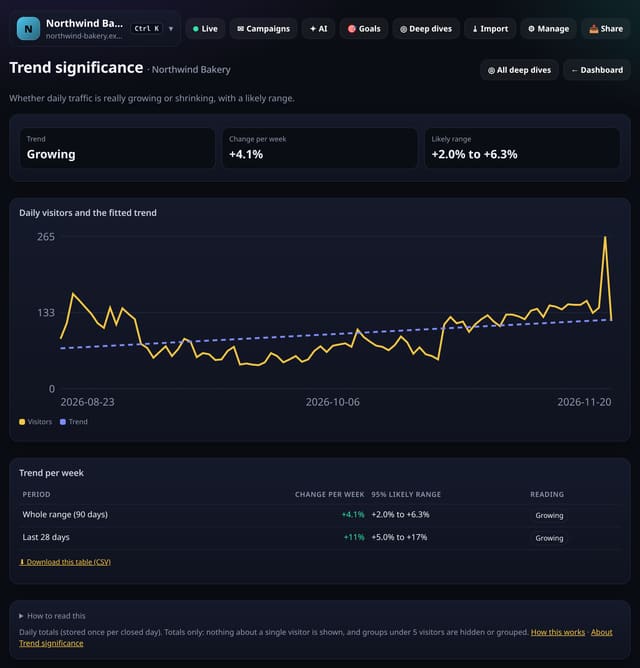
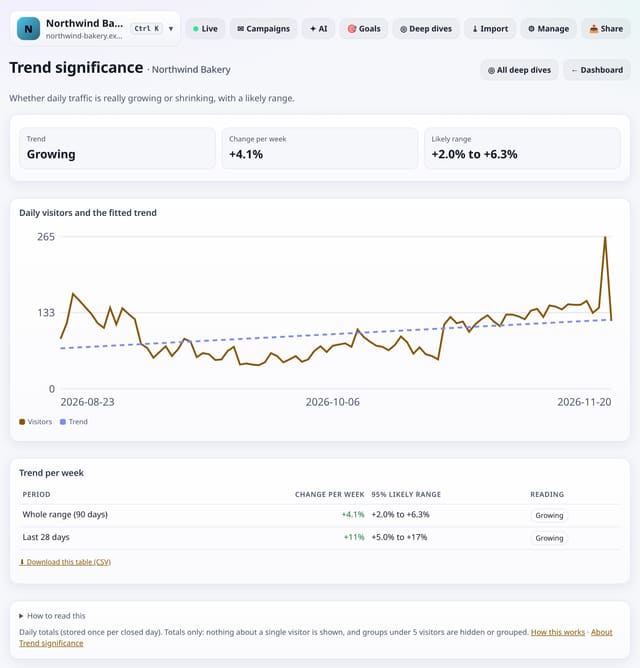
A straight-line trend through daily visitors in the range, as a change per week with a 95% likely range.
Why use it: Daily numbers wobble.
About Trend significanceHow to use it: Trend significanceQS-538
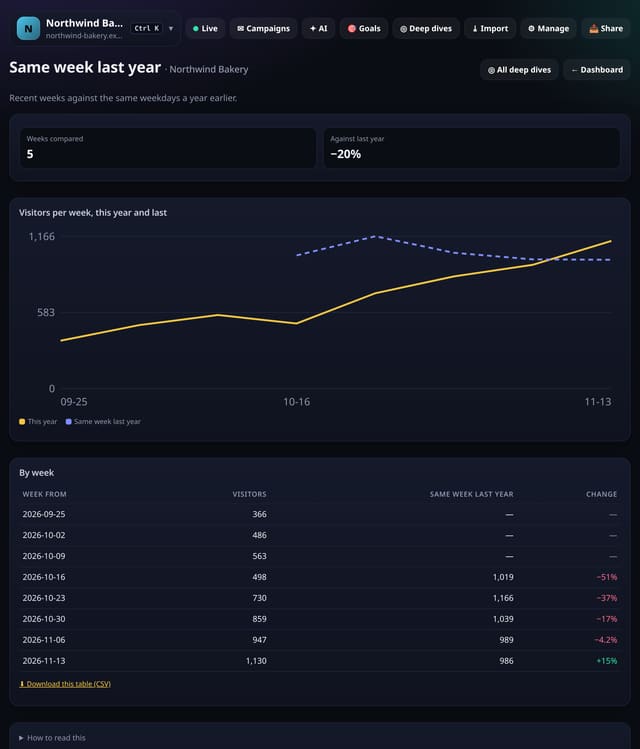
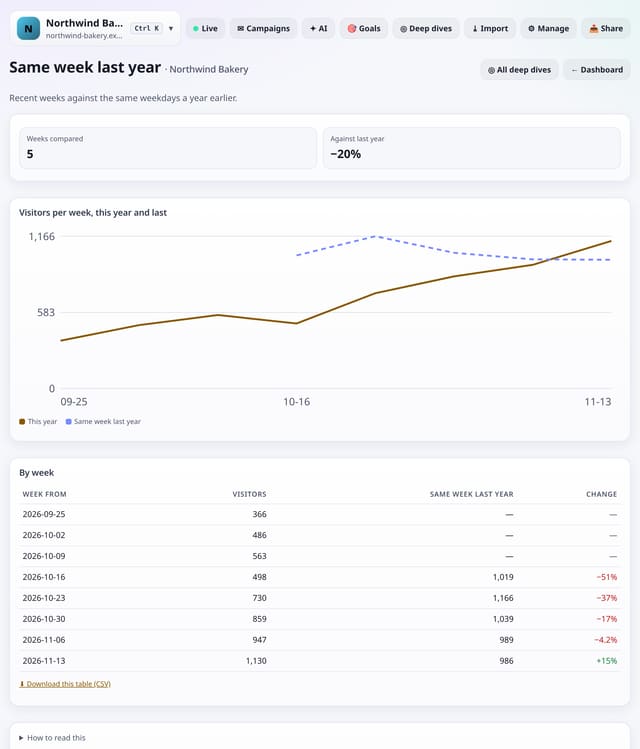
Your recent weeks next to the same 7 days exactly 52 weeks earlier, so weekdays line up.
Why use it: A quiet August is only bad news if last August was busier.
About Same week last yearHow to use it: Same week last yearQS-539
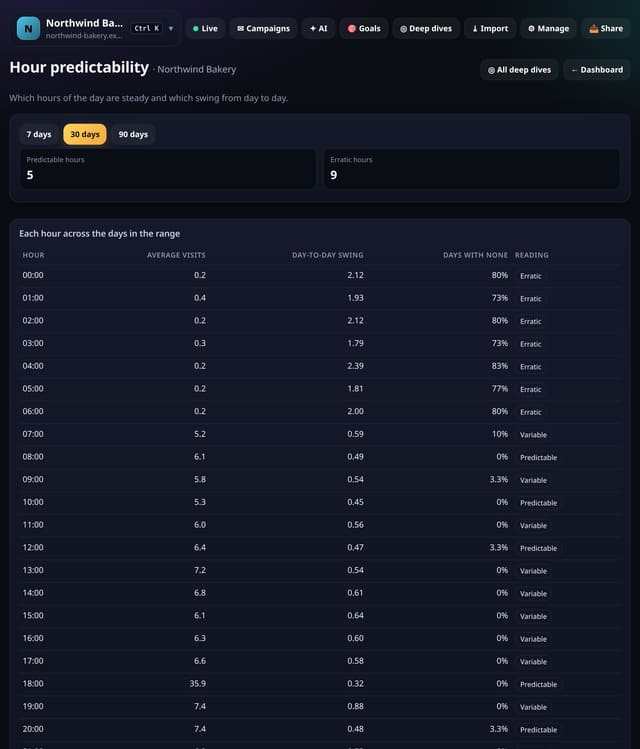
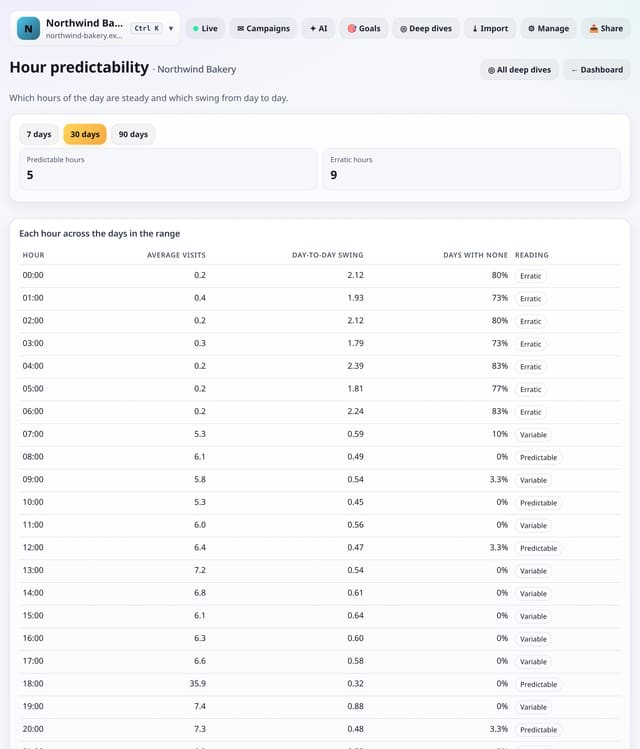
For each hour of the day, the average visits and how much it swings from day to day.
Why use it: Predictable hours are safe for timed posts, launches and support cover; erratic hours depend on one-off events.
About Hour predictabilityHow to use it: Hour predictabilityQS-540
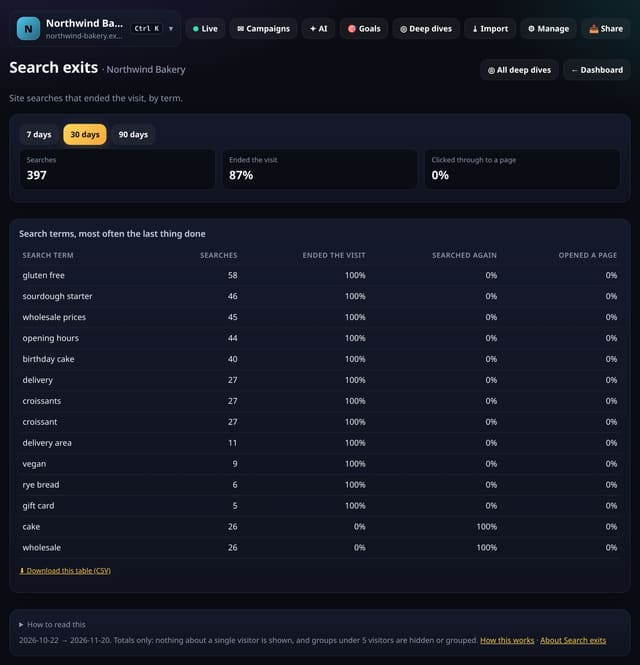
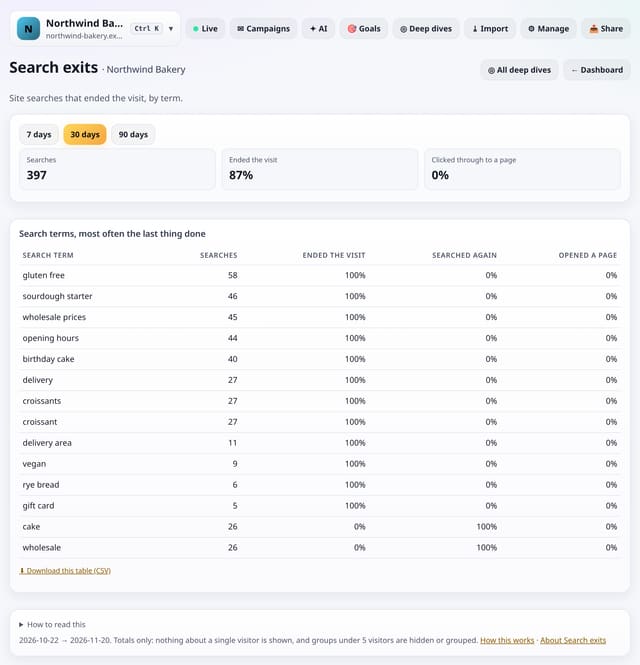
For each site search term, how often it was the last thing done in the visit, how often people searched again and how often they opened a page.
Why use it: A search that ends the visit usually means the results did not help.
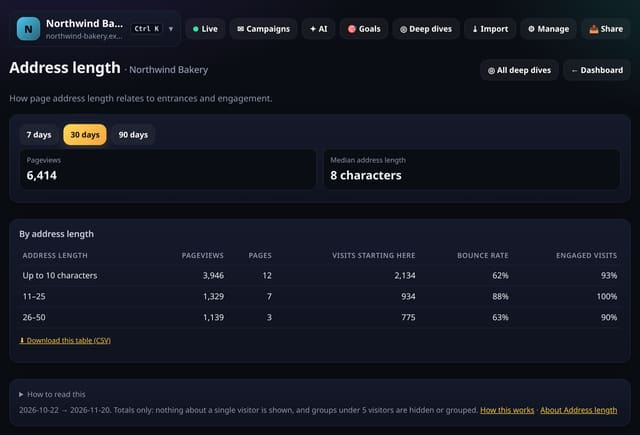
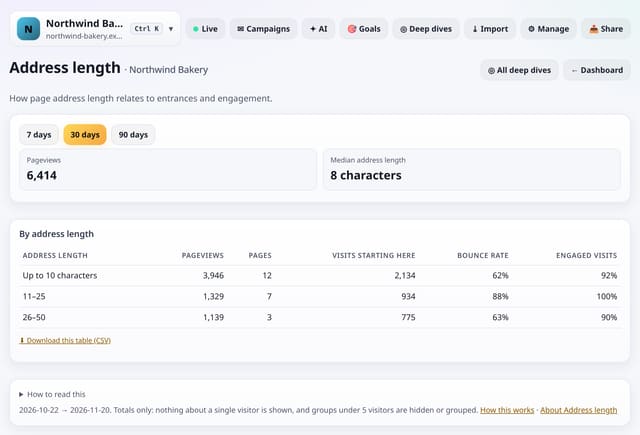
Your pages grouped by the length of their address, with entrances and engagement for each length band.
Why use it: Short, readable addresses are easier to share and remember.
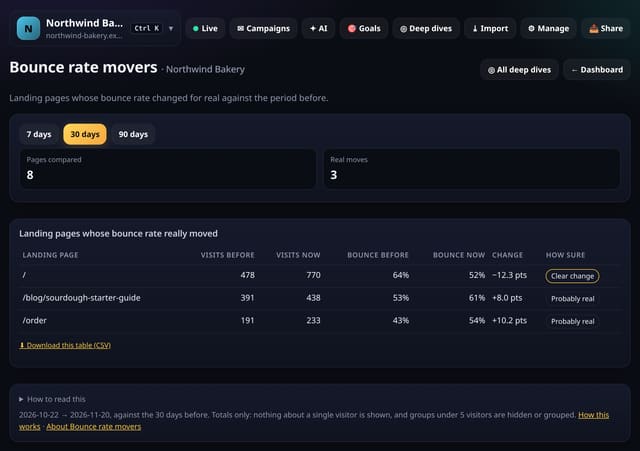
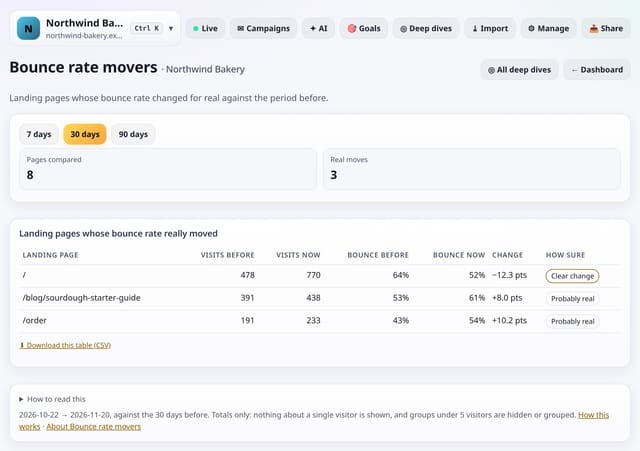
Landing pages whose bounce rate rose or fell against the period before by more than chance would explain.
Why use it: A jump in bounce rate often follows a page edit, a slow image or a change in where visitors come from.
About Bounce rate moversHow to use it: Bounce rate moversQS-543
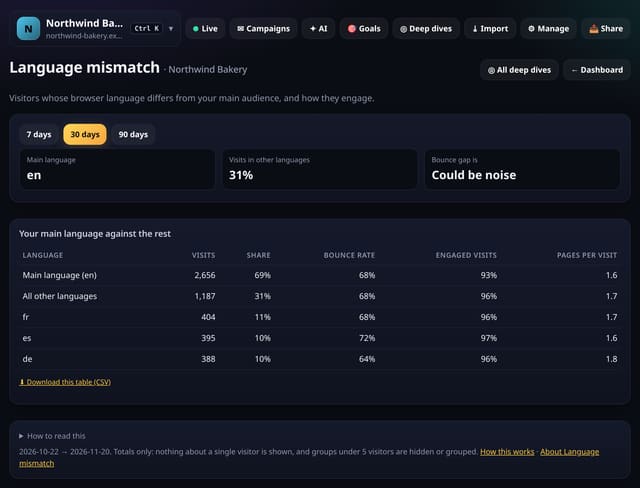
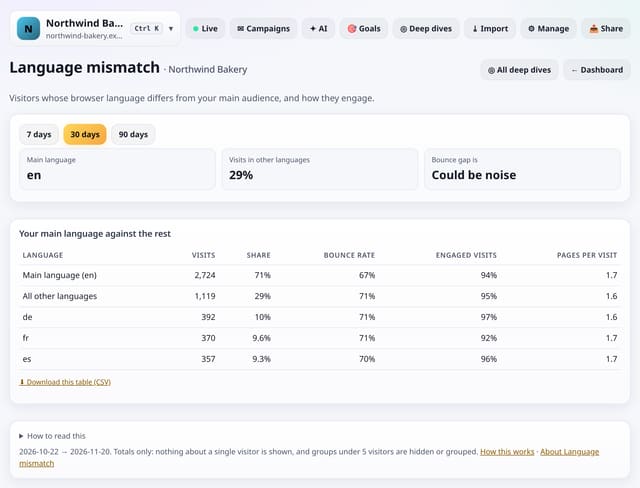
Visitors whose browser asks for a different language from your main audience, and how their engagement compares.
Why use it: If visitors in another language bounce much more, a translated landing page or a clear language note may keep them.
About Language mismatchHow to use it: Language mismatchQS-544
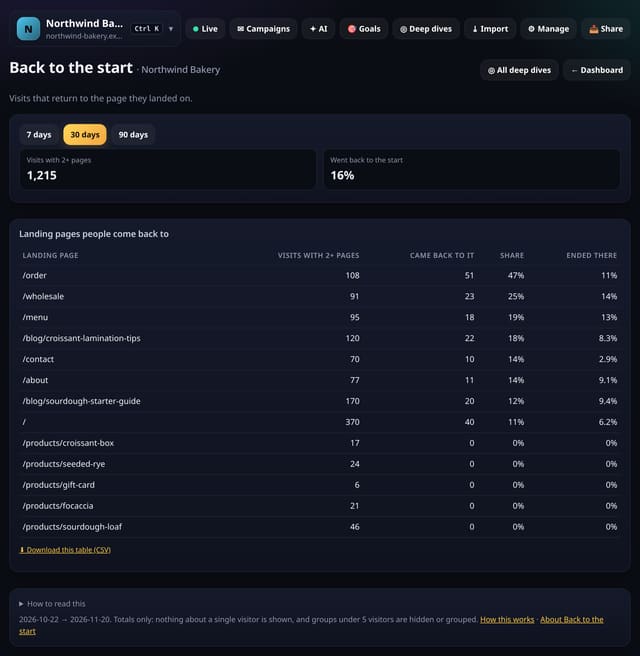
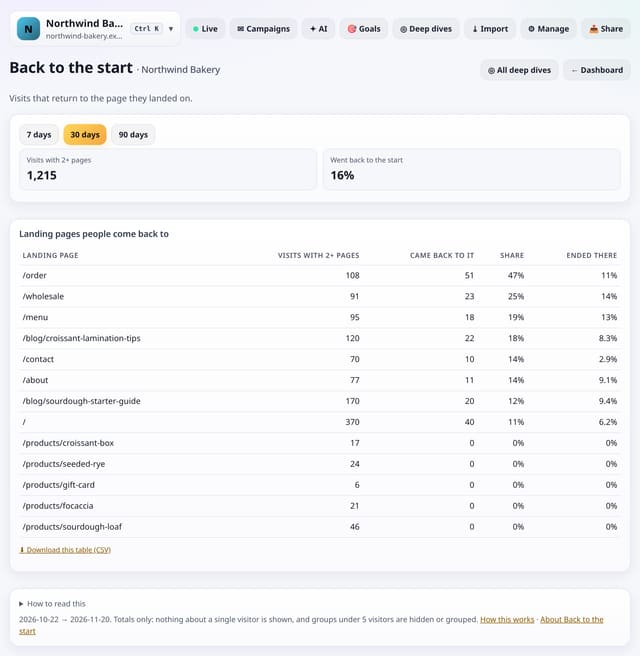
How often visits with two or more pages come back to the page they landed on, and which landing pages people return to.
Why use it: Coming back to the landing page can mean it works as a hub, like a menu or product list, or that people got lost and used it to start again.
About Back to the startHow to use it: Back to the startQS-545
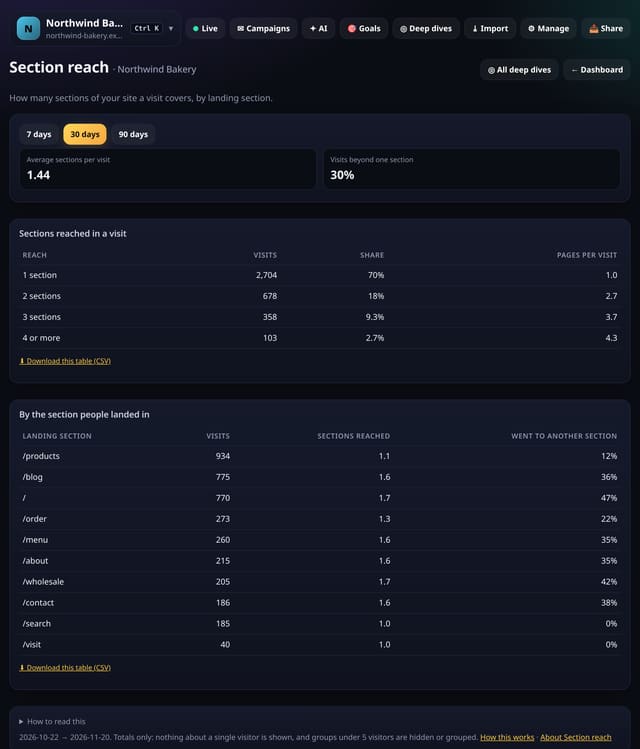
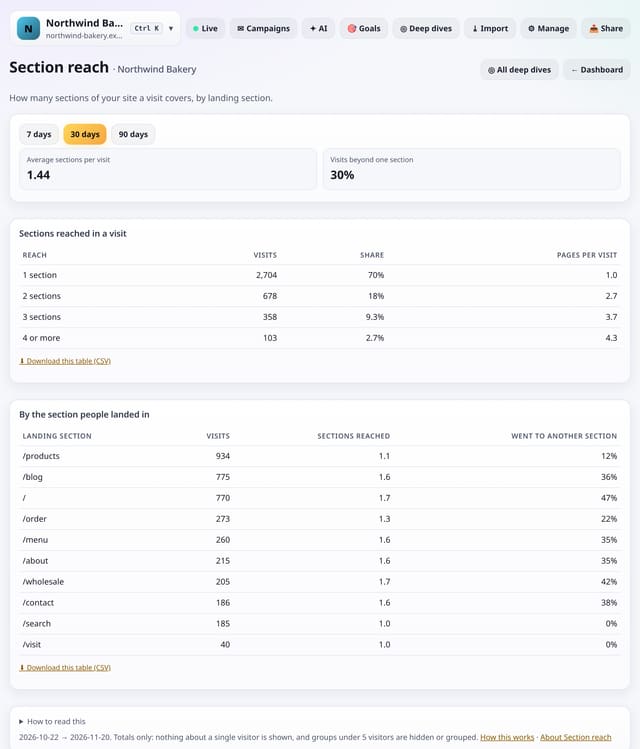
How many sections of your site a visit covers, and which landing sections send people elsewhere.
Why use it: Sections that rarely send people elsewhere are islands: add links from them to the rest of the site.
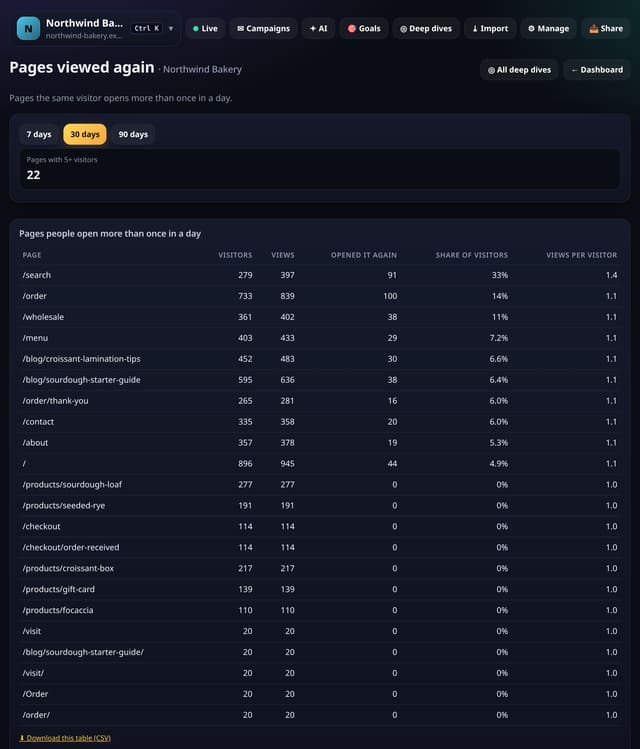
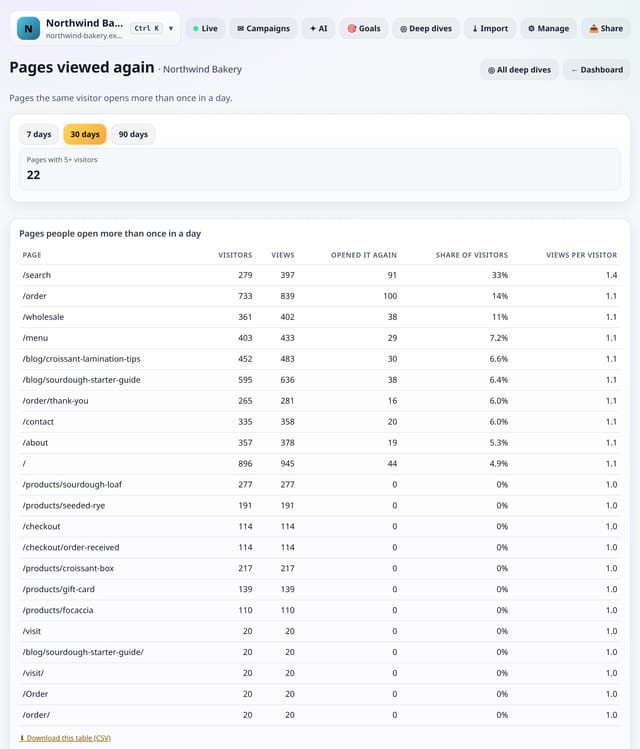
Pages the same visitor opens more than once in a day, with the share of visitors who did and views per visitor.
Why use it: Pages people keep coming back to, like a menu, a price list or docs, are reference pages: keep them fast and easy to reach.
About Pages viewed againHow to use it: Pages viewed againQS-547
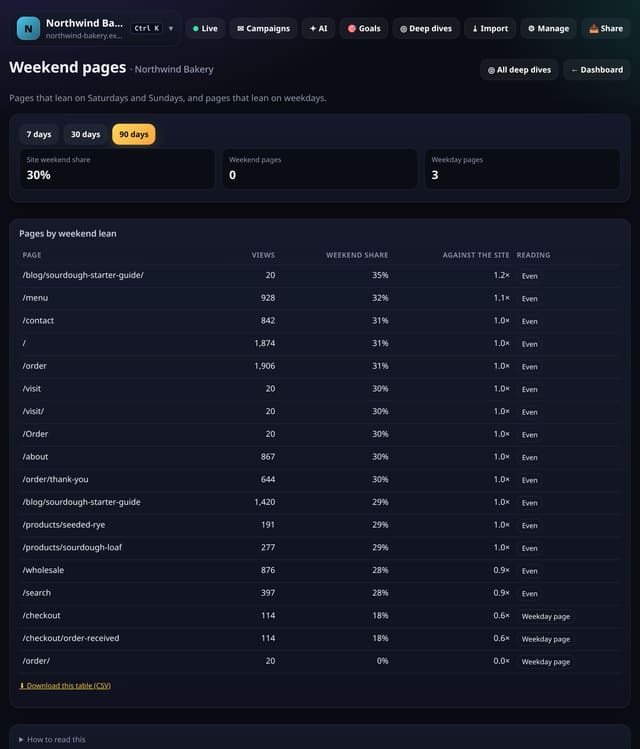
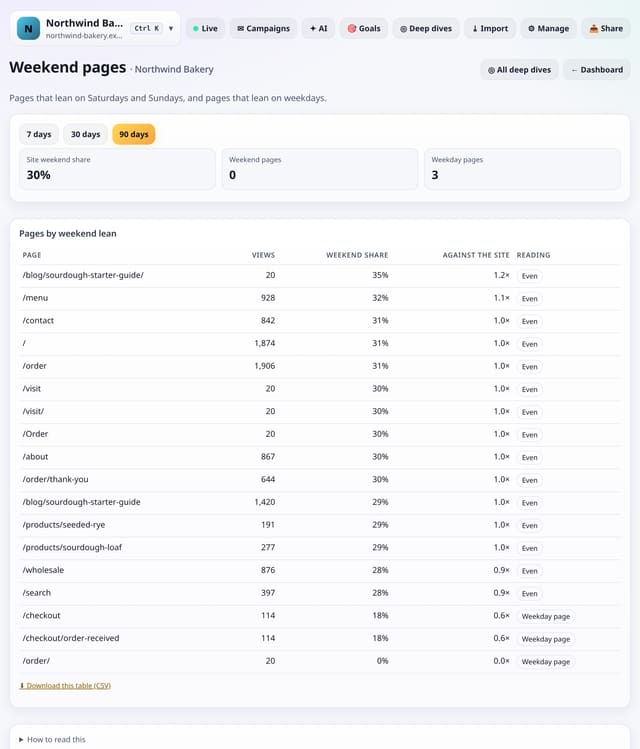
Pages that lean towards weekends and pages that lean towards weekdays, against your site as a whole.
Why use it: Promote weekend pages on Fridays and weekday pages in Monday emails.
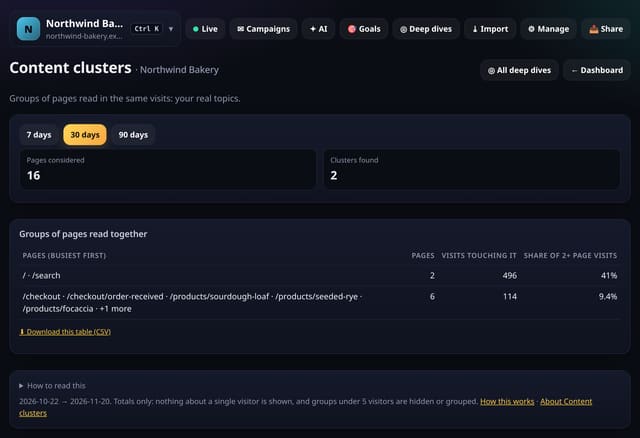
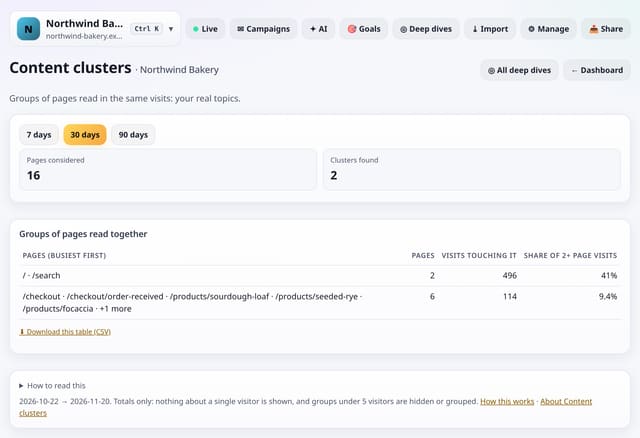
Groups of pages that are read in the same visits far more often than chance, found automatically.
Why use it: Clusters are your real topics, as readers see them.
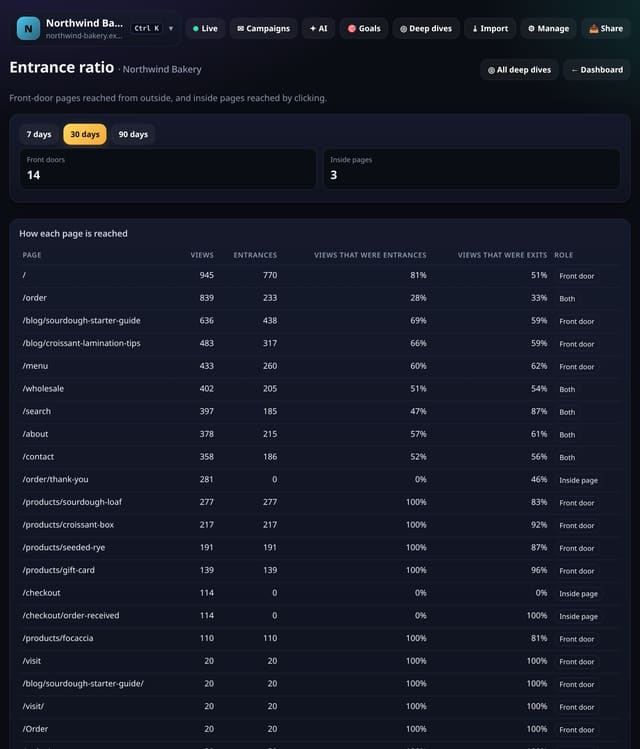
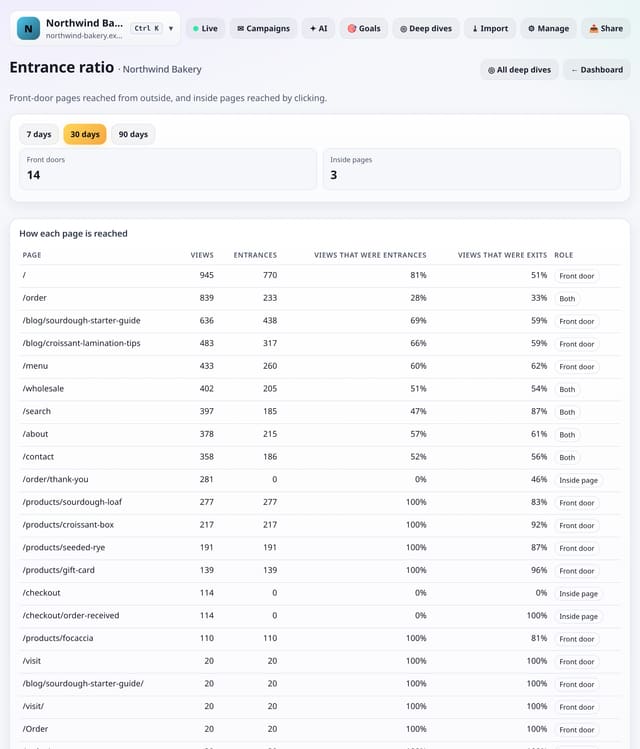
For each page, the share of its views that started a visit, so you can tell pages reached from outside from pages reached by clicking around.
Why use it: A front door must make sense with no context, because people arrive from search, links or ads.
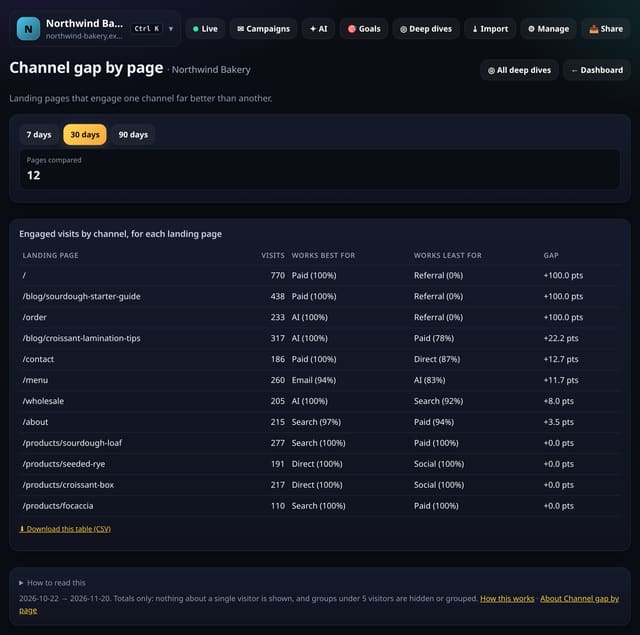
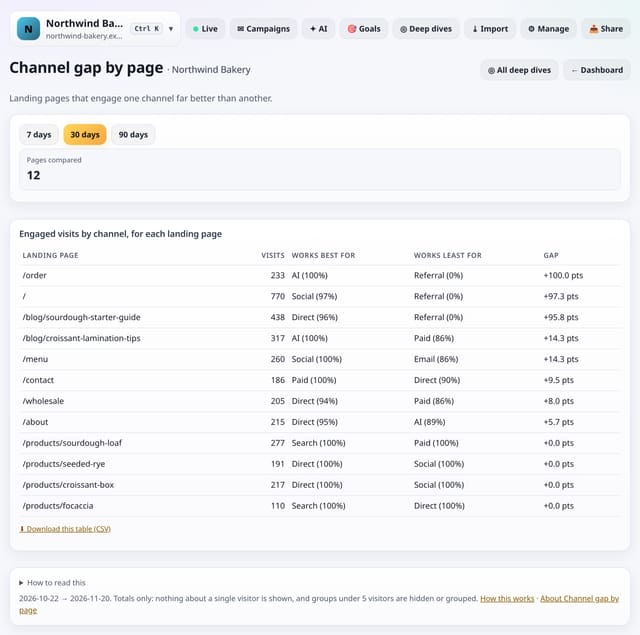
Landing pages whose engaged-visit rate differs most between the channel it works best for and the one it works least for.
Why use it: A page that engages search visitors but not social ones may need a different intro for people arriving from a post.
About Channel gap by pageHow to use it: Channel gap by pageQS-551
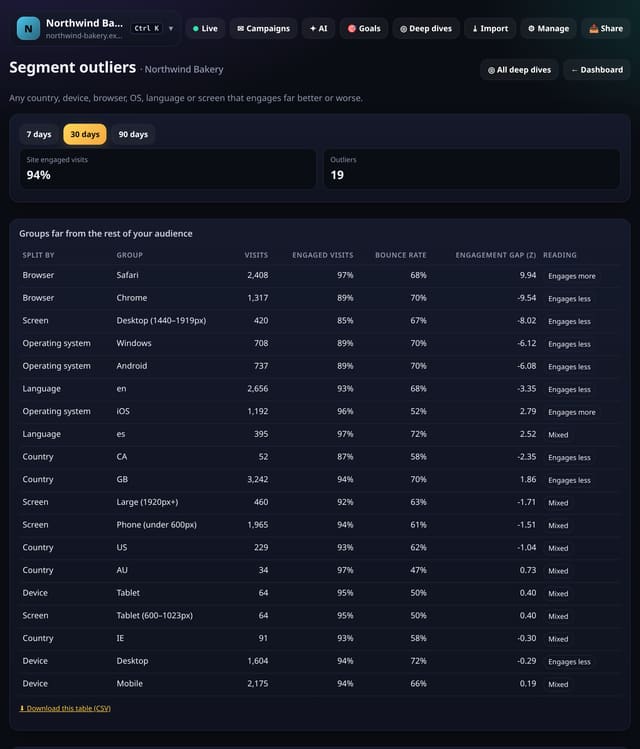
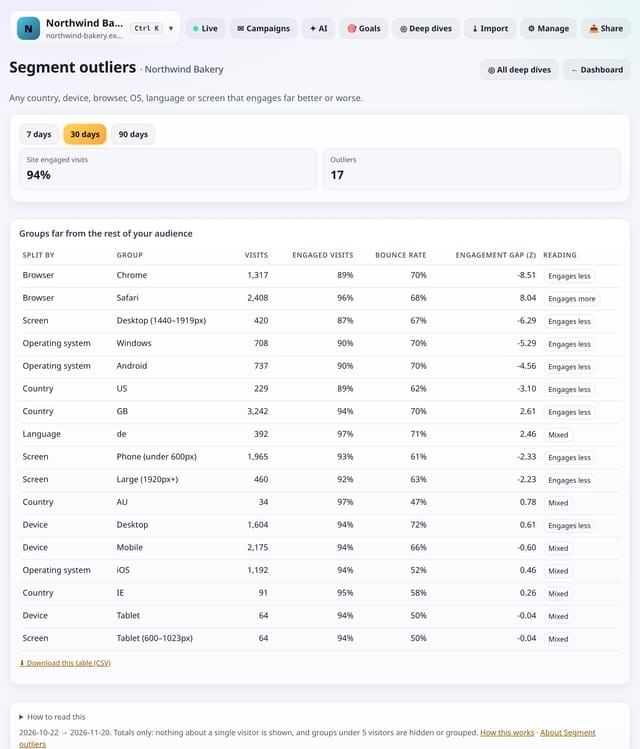
One scan across country, device, browser, operating system, language and screen size for any group that engages far better or worse than everyone else.
Why use it: One screen instead of six reports.
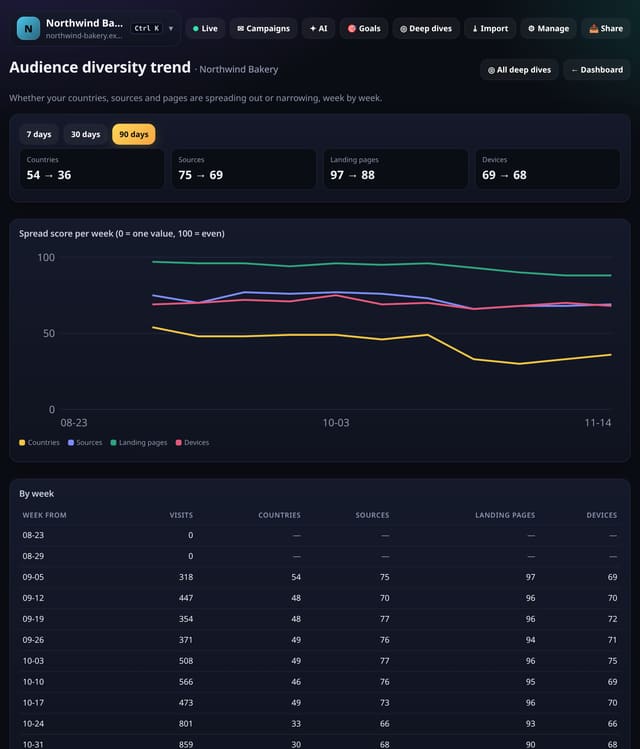
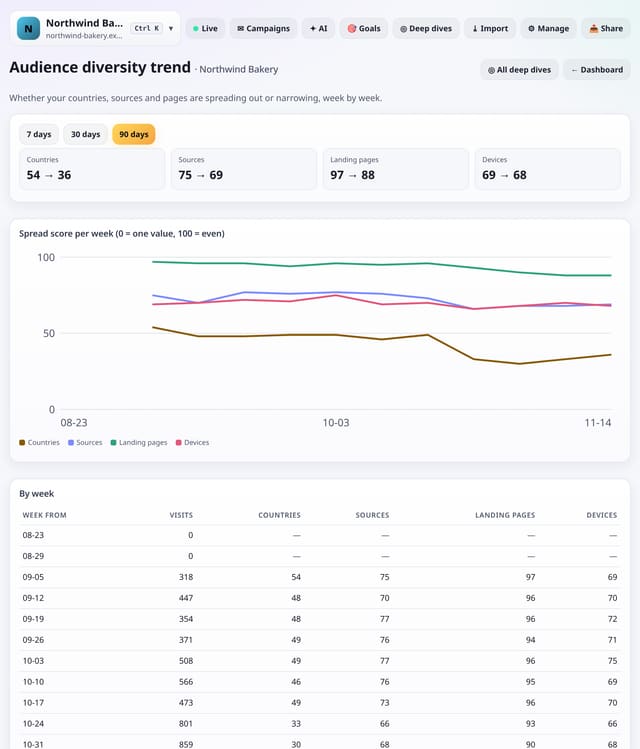
A weekly spread score for your countries, sources, landing pages and devices, from 0 (one value) to 100 (evenly spread).
Why use it: A falling source score means you are coming to depend on fewer sources.
About Audience diversity trendHow to use it: Audience diversity trendQS-553
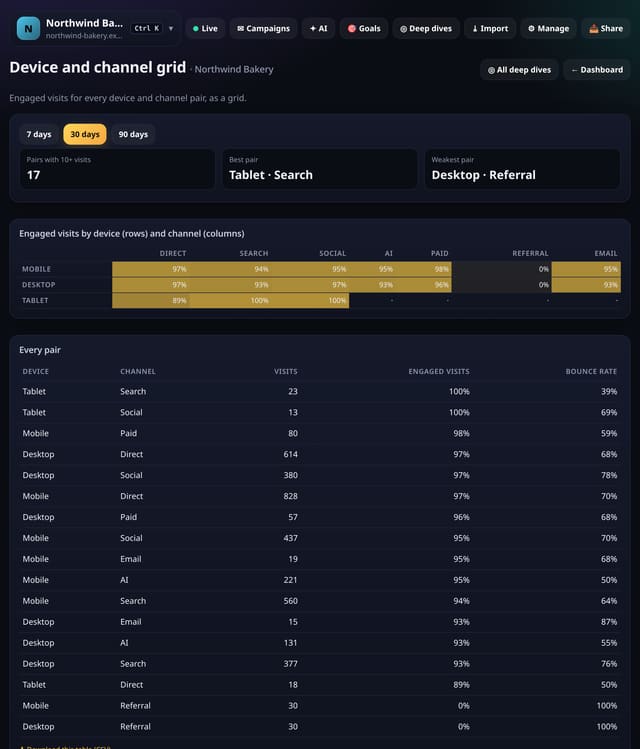
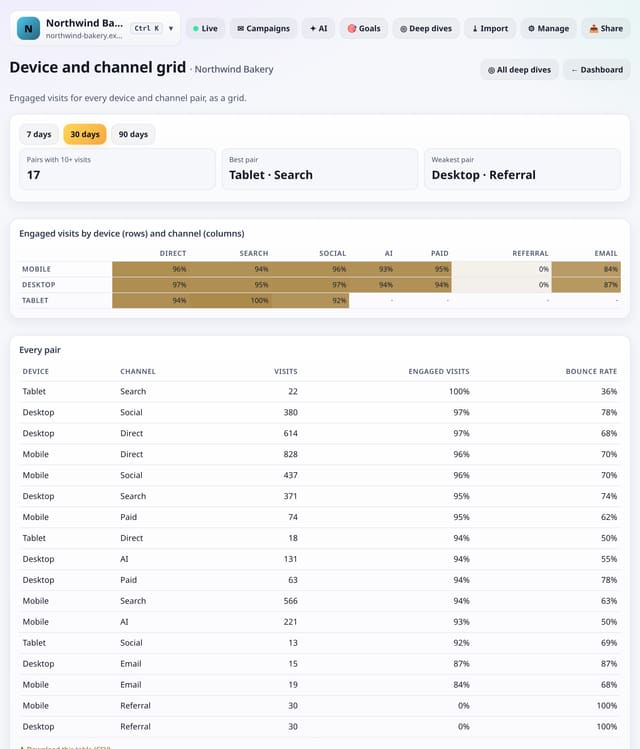
Engaged visits for every pair of device and channel, as a colour grid, with the weakest and strongest pairs listed.
Why use it: A weak cell, say Mobile and Social, is a specific fix: the page people land on from that channel, on that kind of screen.
About Device and channel gridHow to use it: Device and channel gridQS-554
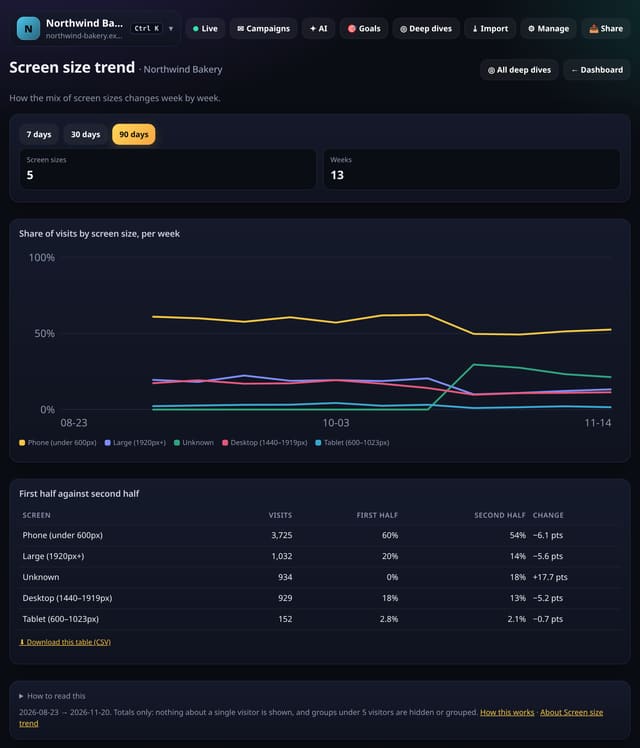
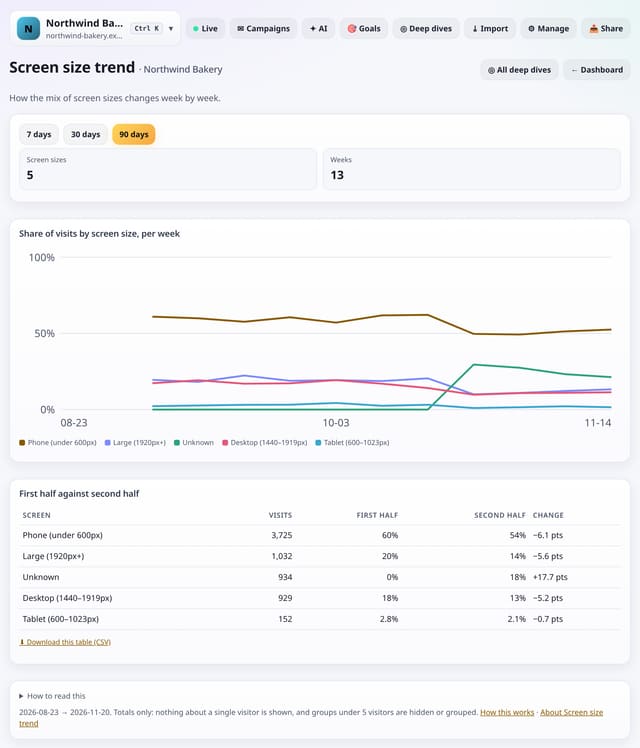
The share of visits from each screen size, week by week, with the first half of the range against the second.
Why use it: A growing phone share is the signal to check your pages on a small screen first.
About Screen size trendHow to use it: Screen size trendQS-555
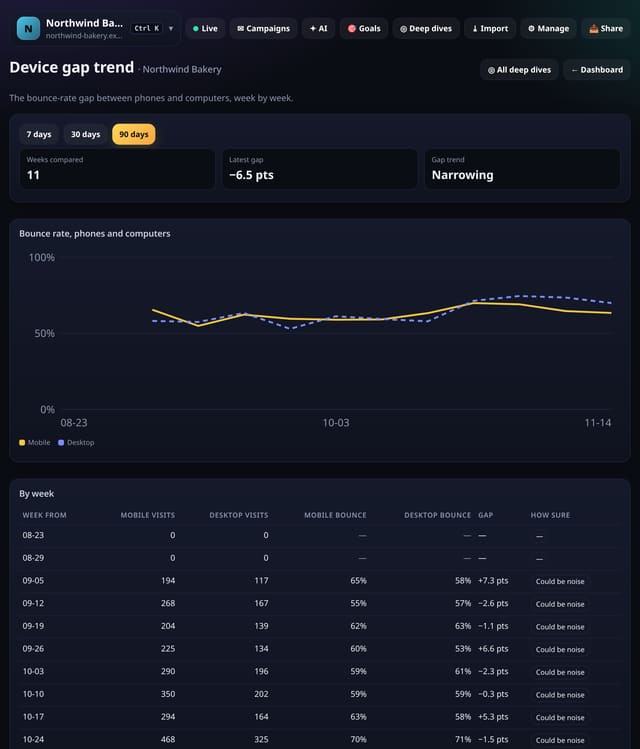
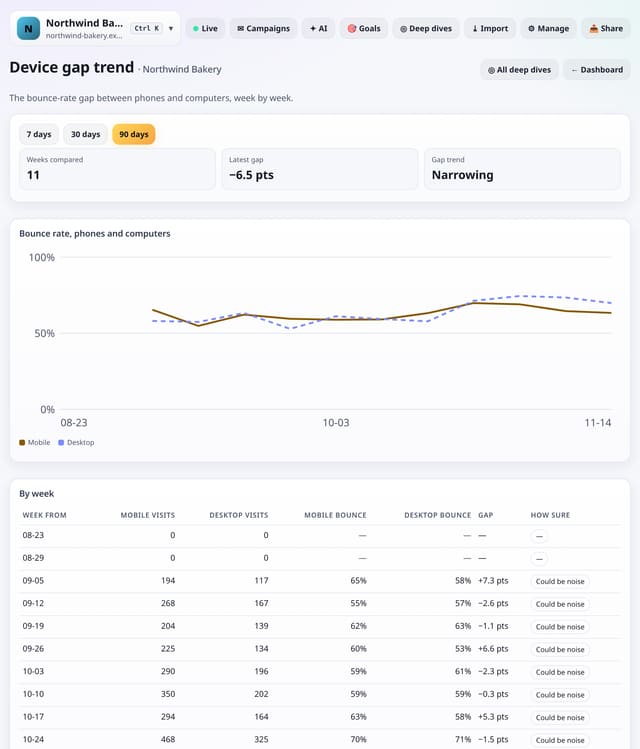
The bounce-rate gap between phones and computers for each week, and whether it is widening or narrowing.
Why use it: Watch the trend after design changes: a narrowing gap means your mobile fixes are working.
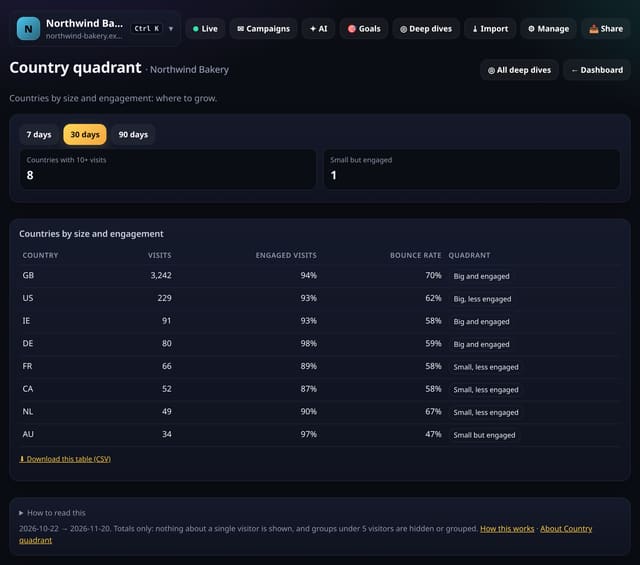
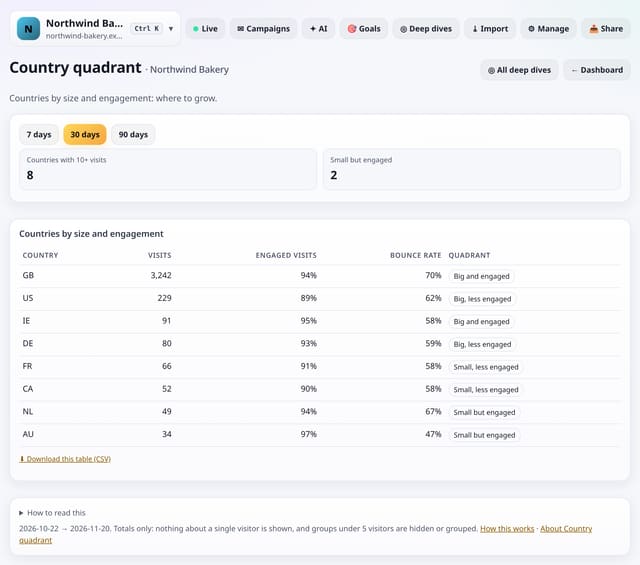
Your countries sorted into four groups by size and engagement, so you can see which ones are small but very engaged.
Why use it: “Small but engaged” countries are the cheapest to grow.
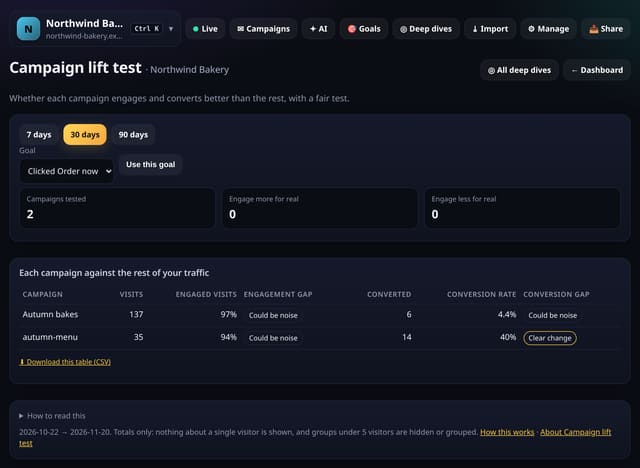
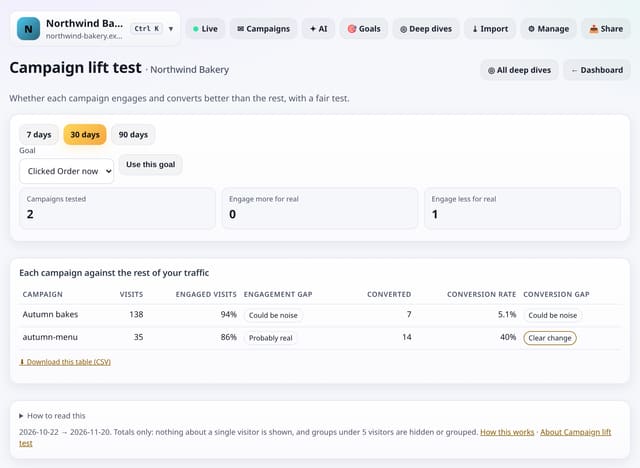
Each campaign against the rest of your traffic, with a fair test of whether it engages and converts better or worse.
Why use it: A campaign can look good on clicks and still bring idle visitors.
About Campaign lift testHow to use it: Campaign lift testQS-558
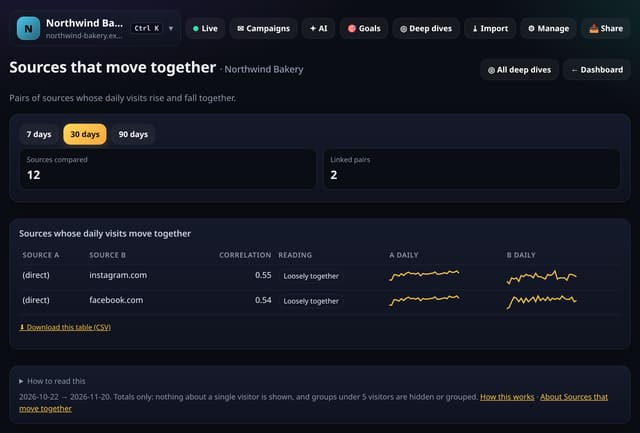
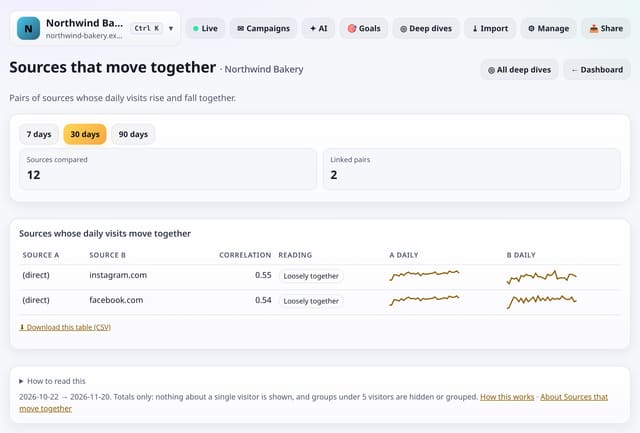
Pairs of sources whose daily visits rise and fall together, such as two sites that picked up the same story.
Why use it: Sources that rise together often share a cause: a story picked up by several sites, or a post shared across networks.
About Sources that move togetherHow to use it: Sources that move togetherQS-559
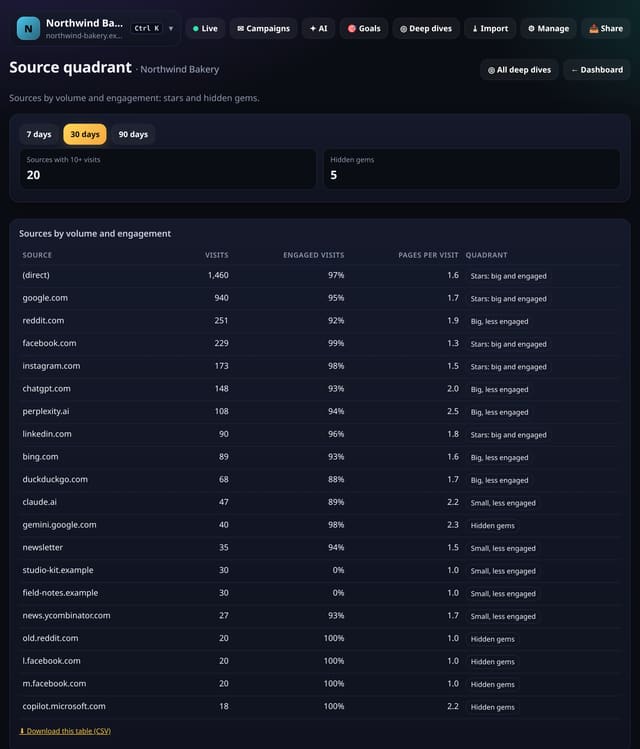
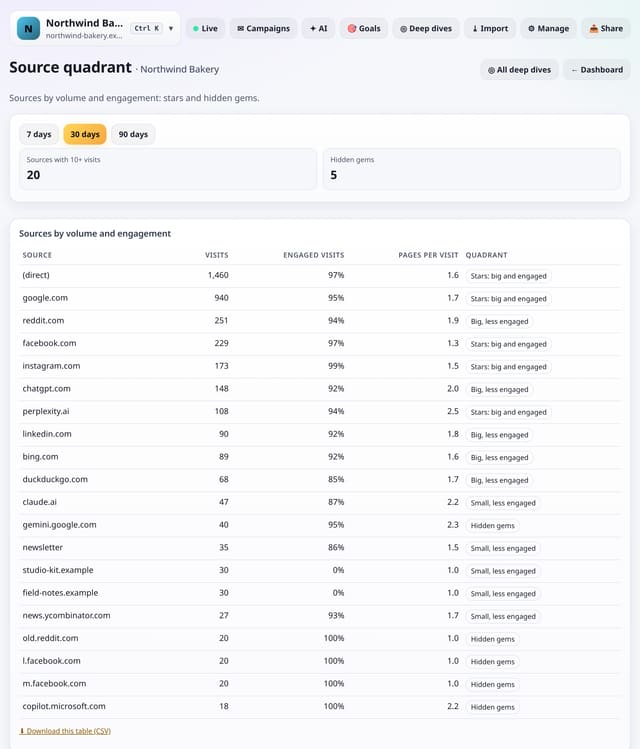
Your sources sorted into four groups by volume and engagement, with pages per visit.
Why use it: Hidden gems send few but very engaged visitors: more links or posts there are likely to pay off.
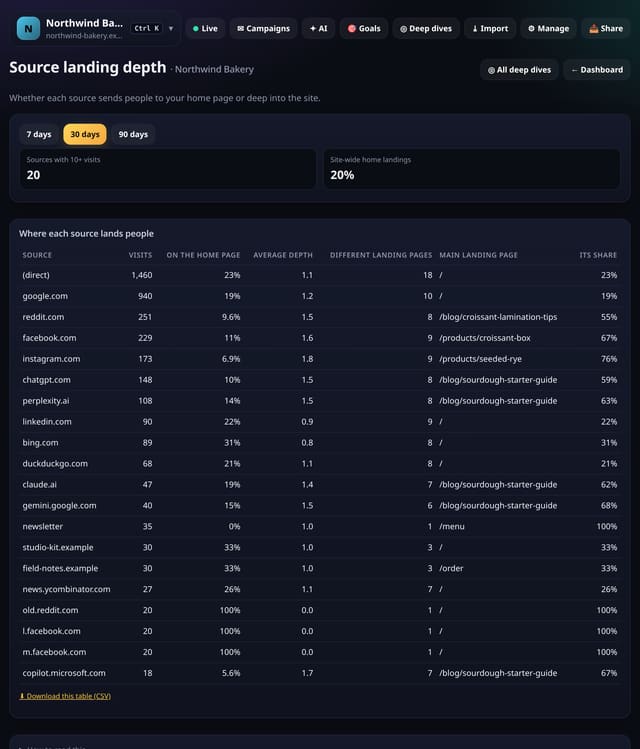
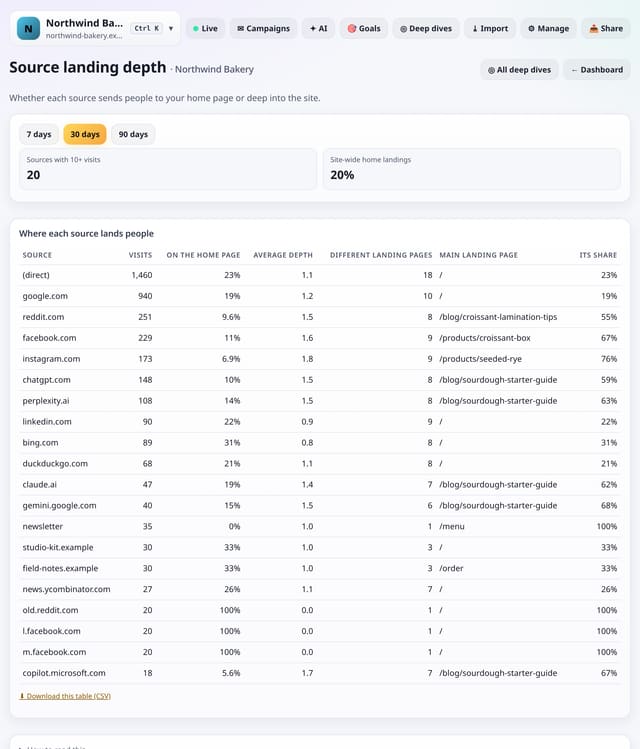
For each source, how often it lands people on your home page, how deep in your site its links go and its top landing page.
Why use it: Sources that land people deep link to specific content.
About Source landing depthHow to use it: Source landing depthQS-561
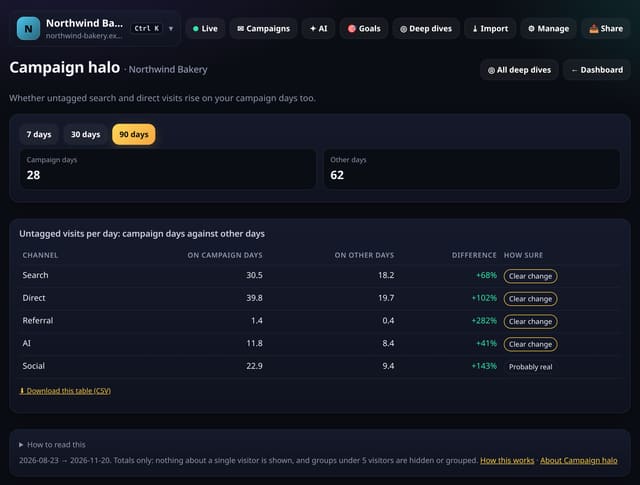
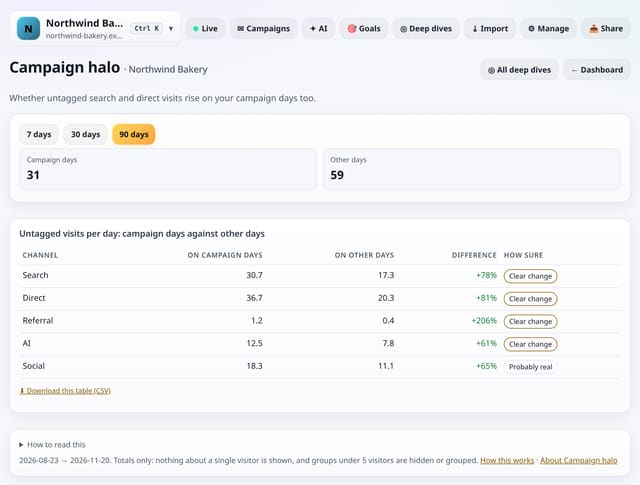
Whether search, direct and other untagged visits are higher on your busiest campaign days than on other days.
Why use it: If untagged search and direct visits also rise on campaign days, your campaigns are doing more than their own tags show: people hear of you, then search for you.
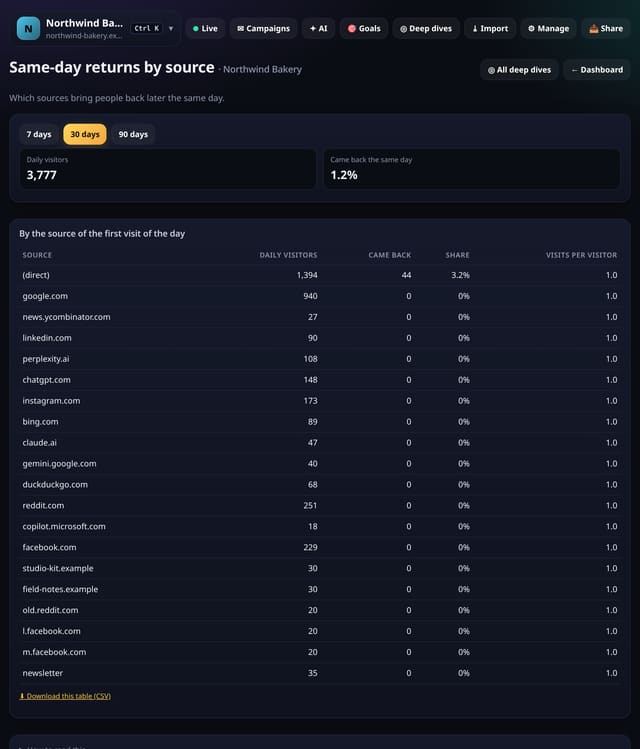
Which sources bring people who come back later the same day, after 30 minutes away.
Why use it: A source whose visitors come back is sending people who are comparing or deciding.
About Same-day returns by sourceHow to use it: Same-day returns by sourceQS-563
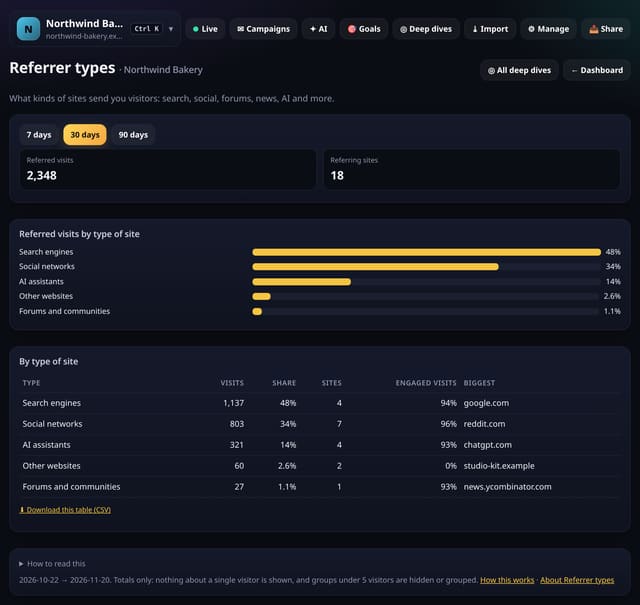
Referred visits grouped by type of site: search, social, forums, news, code and docs, AI assistants, email and more.
Why use it: It tells you where you are being talked about, not just which sites, so you know which kind of community to spend time in.
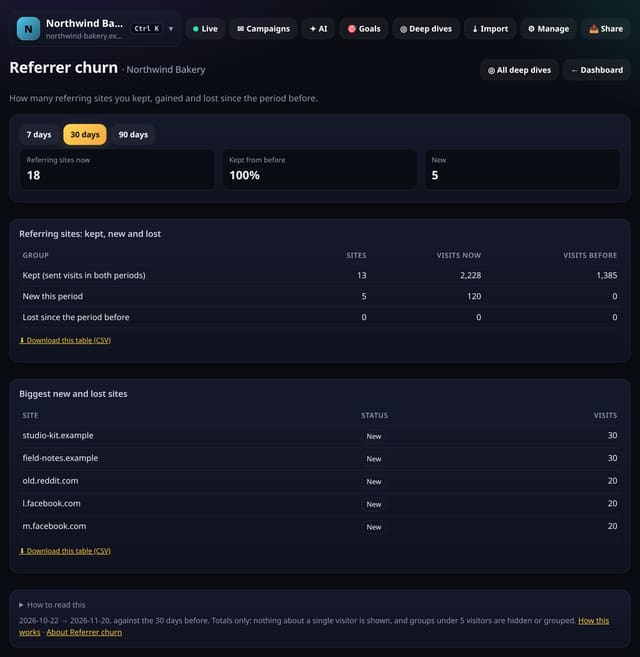
How many referring sites kept sending visits, how many are new and how many stopped, against the period before.
Why use it: Lots of lost sites is normal for one-off mentions.
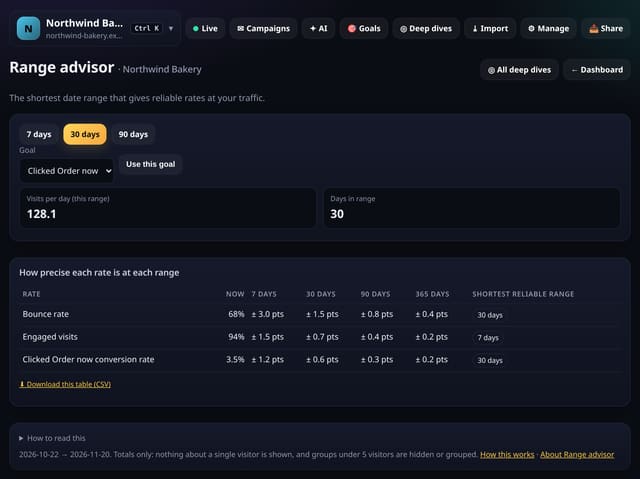
For your bounce rate, engaged visits and conversion rate, the margin of error at 7, 30, 90 and 365 days, and the shortest range that gives a reliable figure.
Why use it: A small site looking at 7 days is mostly reading noise.
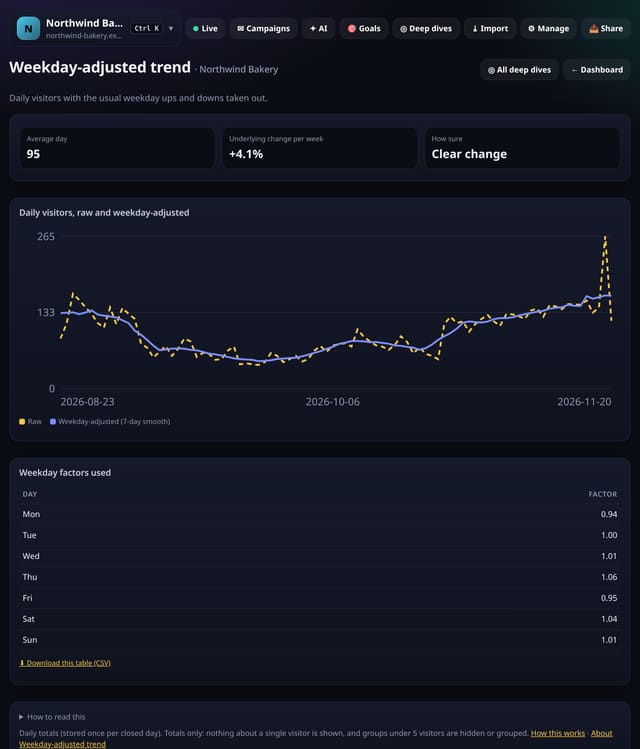
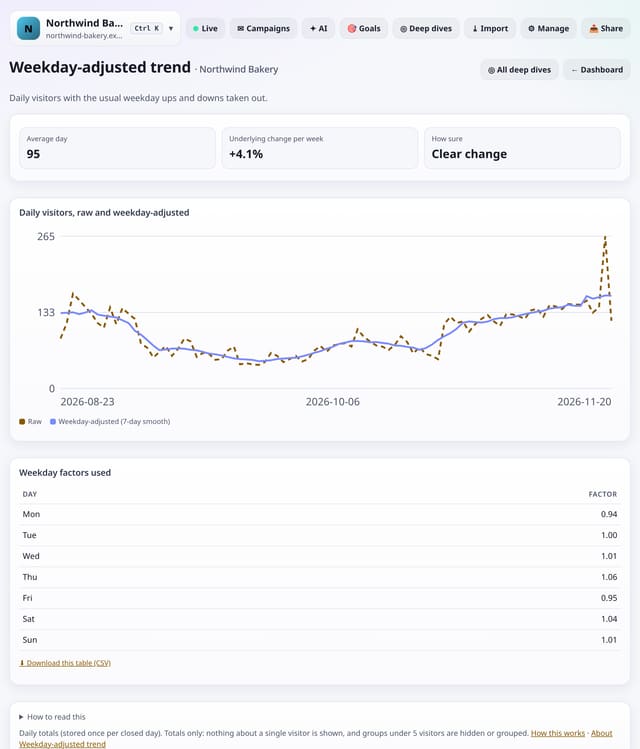
Daily visitors with the usual weekday ups and downs taken out and smoothed, so a quiet Saturday no longer looks like a drop.
Why use it: It shows the underlying direction of your traffic, which raw daily numbers hide behind the weekly pattern.
About Weekday-adjusted trendHow to use it: Weekday-adjusted trendQS-567
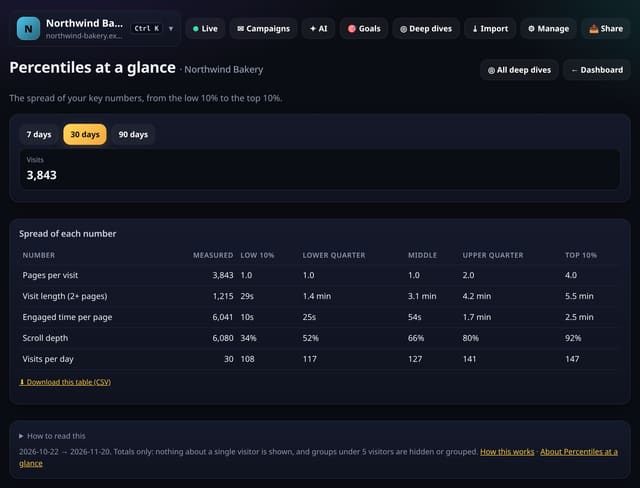
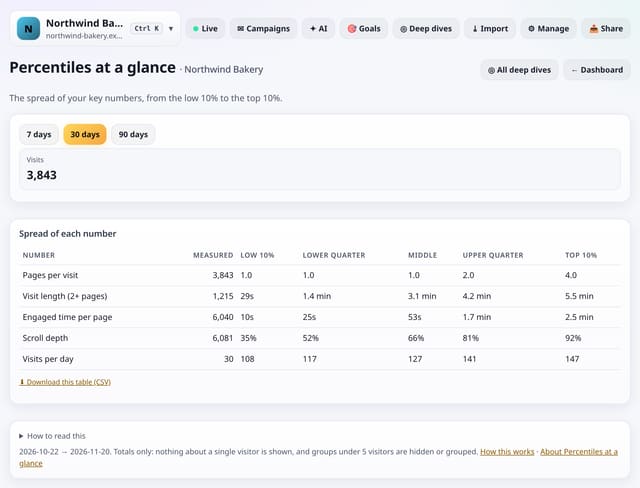
Pages per visit, visit length, engaged time, scroll depth and visits per day, each shown from the low 10% to the top 10%.
Why use it: Averages hide the shape.
About Percentiles at a glanceHow to use it: Percentiles at a glanceQS-568
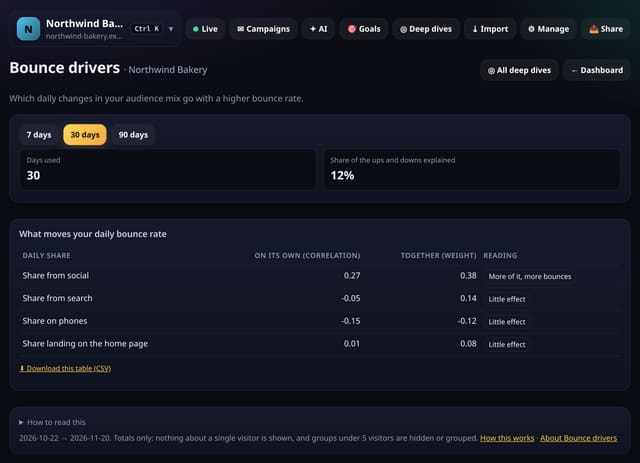
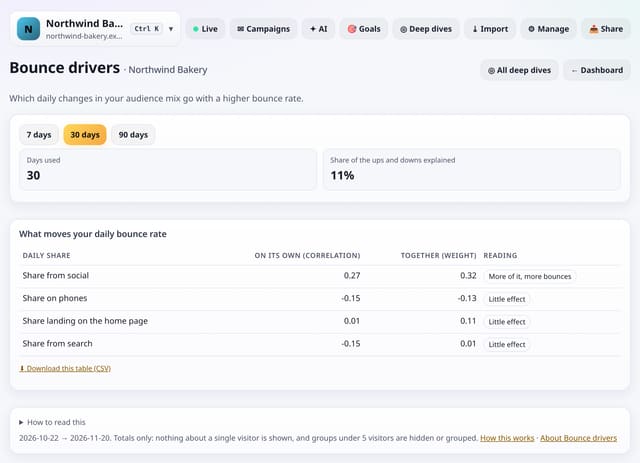
Which daily changes in your audience mix go with a higher or lower bounce rate: phones, search, social and home-page landings.
Why use it: If bounce rises on days with more social traffic and nothing else, the fix is the social landing pages, not the whole site.
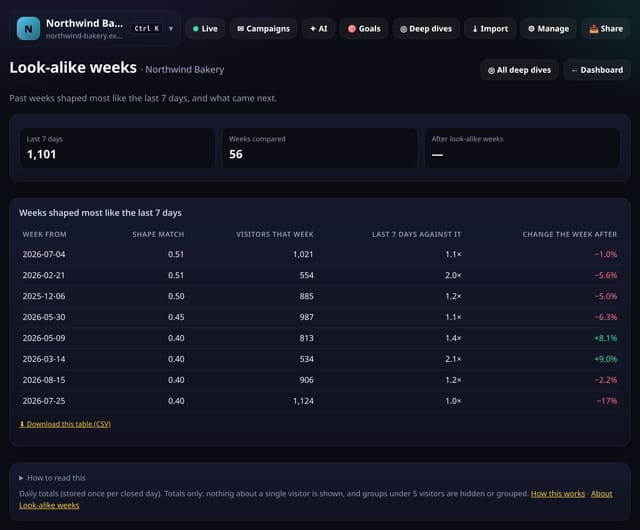
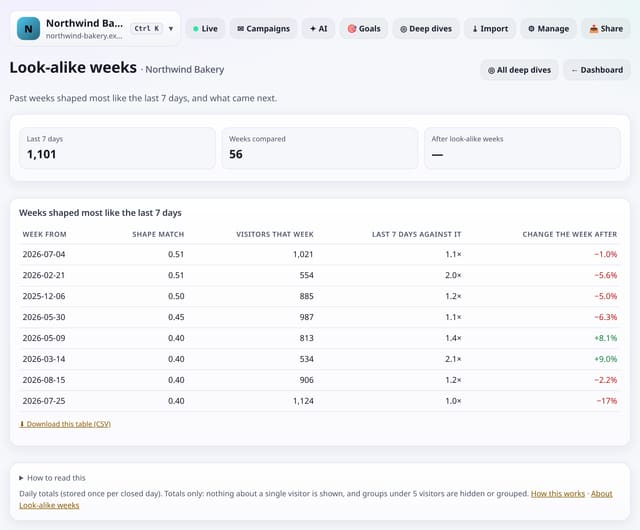
The earlier weeks whose day-by-day shape matches the last 7 days best, and what happened the week after each.
Why use it: When several look-alike weeks were followed by a rise or a fall, that is a hint for next week, not a forecast.
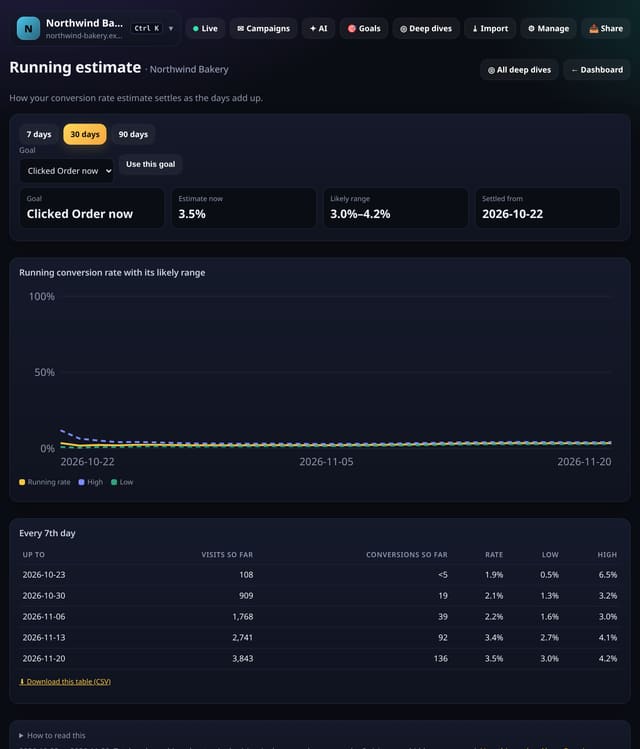
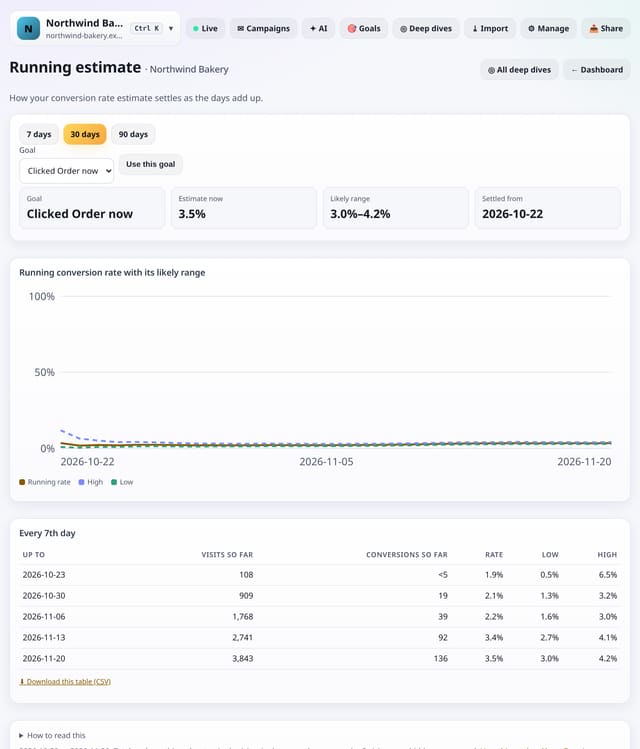
Your conversion rate recalculated day by day from the start of the range, with its likely range, and the day it settled.
Why use it: It shows when you had enough data to trust the number, which is useful before calling a test or a change.
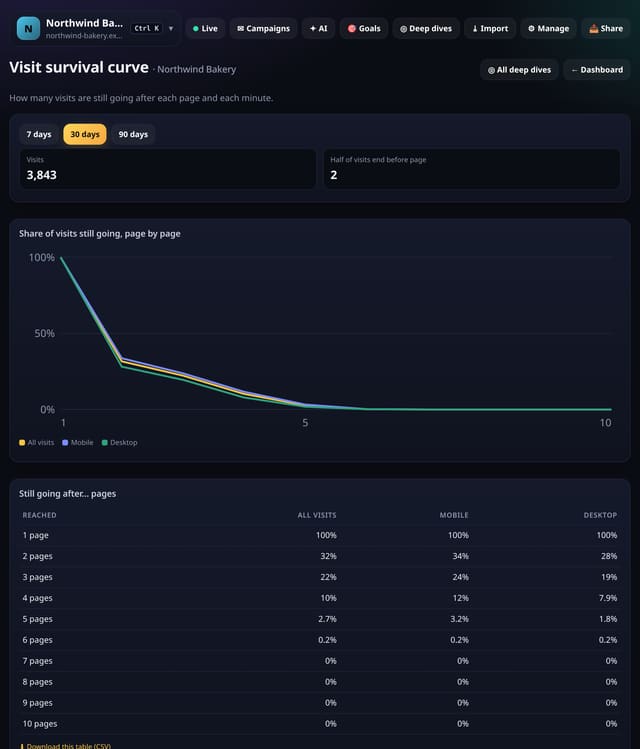
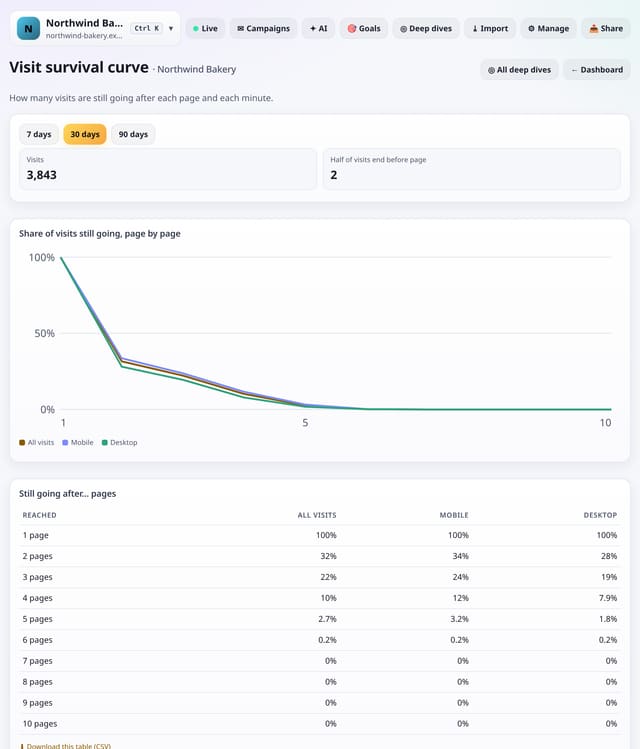
The share of visits still going after each page and each length of time, for all visits, phones and computers.
Why use it: The steepest drop is where most visits end.
About Visit survival curveHow to use it: Visit survival curveQS-572
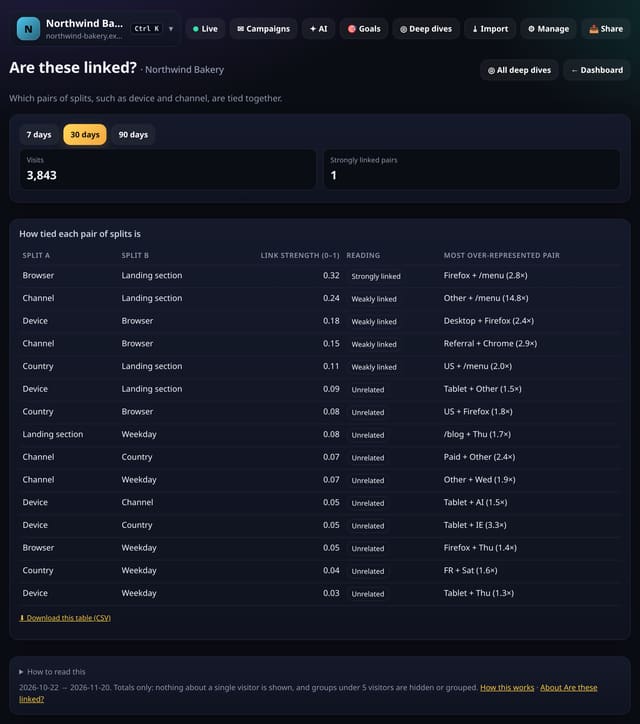
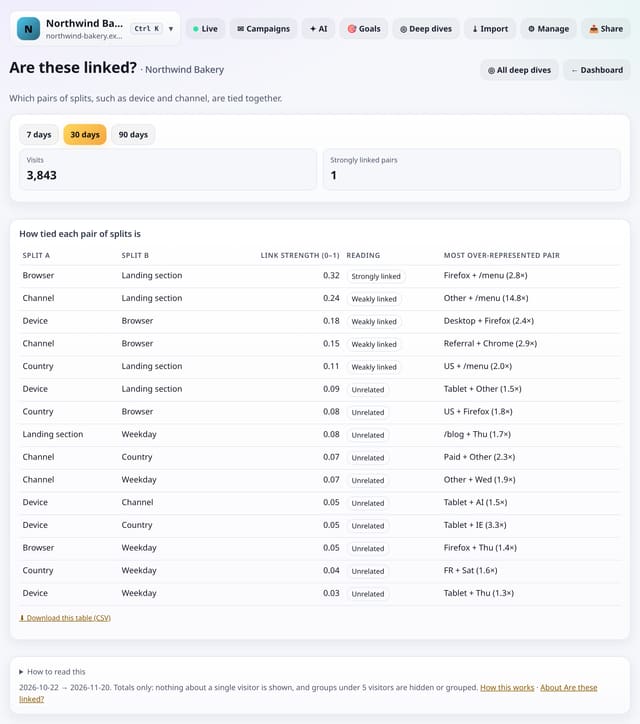
For every pair of splits, such as device and channel, how strongly they are tied together, with the strongest combination.
Why use it: If device and channel are strongly linked, a “mobile problem” may really be a social-traffic problem.
About Are these linked?How to use it: Are these linked?QS-573
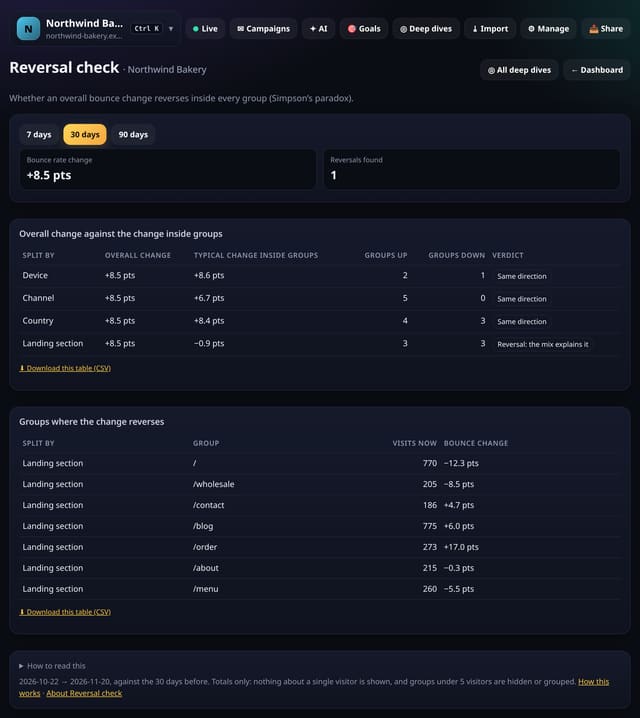
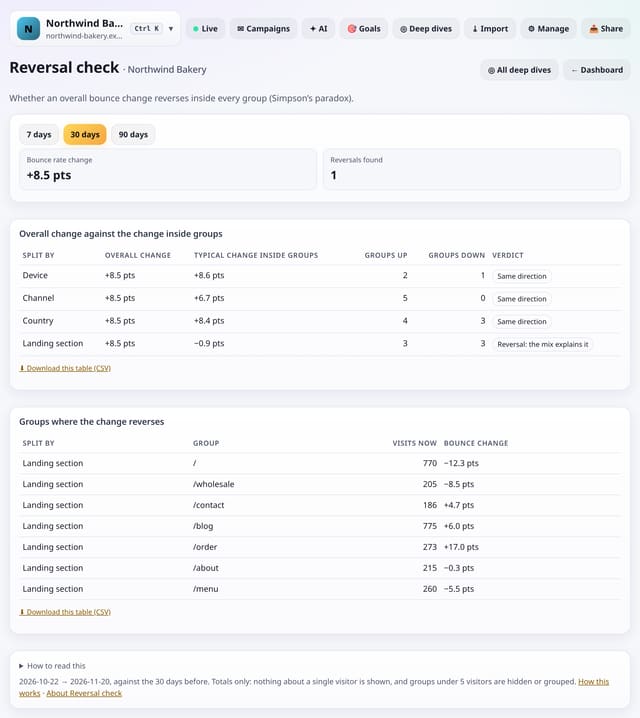
Whether an overall change in bounce rate reverses inside every group, Simpson’s paradox, so you know whether to fix pages or look at the mix.
Why use it: The overall bounce rate can rise while it falls in every group, because more visits came from a group that always bounces more.
Newer: the 50 features added on 21 November 2026. Everything that has shipped, newest first, is in the changelog. Every page on the site is on the sitemap.