How to use audience diversity trend: spreading out or narrowing?
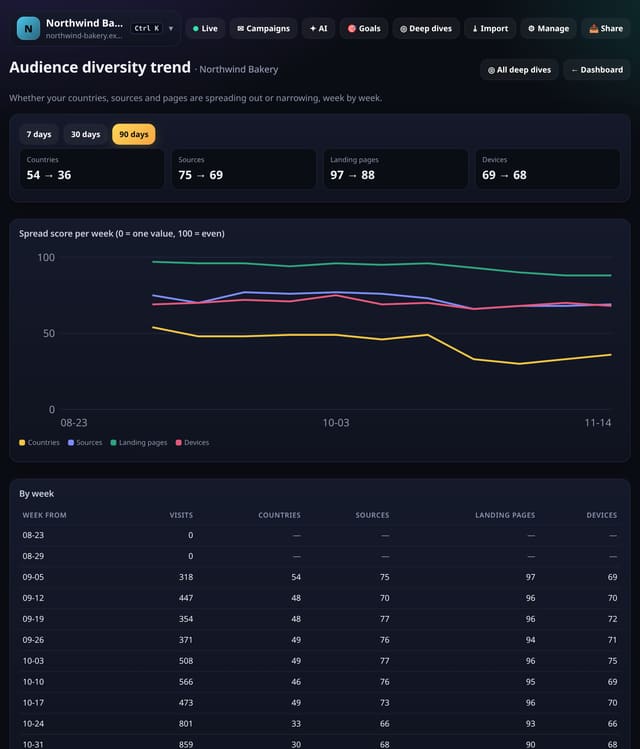
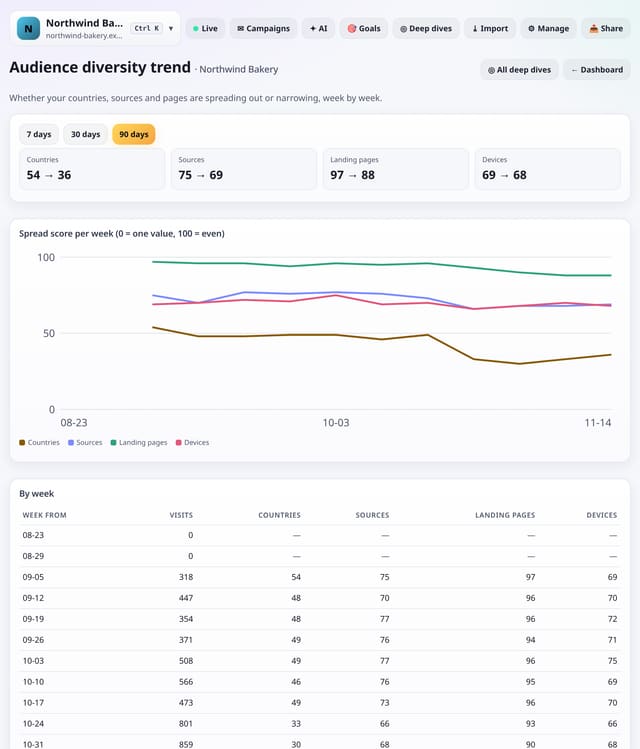
A weekly spread score for your countries, sources, landing pages and devices, from 0 (one value) to 100 (evenly spread).
What it does
For each week in the range, quietstats works out the normalised entropy of visits across countries, sources, landing pages and devices, and draws the four scores as lines. Weeks with fewer than 20 visits are left blank.
Why it matters
A falling source score means you are coming to depend on fewer sources. A rising page score means more of your site is pulling its weight.
How to use it
- Open Deep dives → Analysis lab → Audience diversity trend, or search “Audience diversity trend” on All reports (or go to /app/lab/diversitytrend?site=YOUR_SITE).
- The default range is 90 days; pick another at the top.
- Download any table with its CSV link; small numbers show as “<5” there too.
How it works
- Open your dashboard, go to Deep dives (or Reports on a phone) and open Analysis lab.
- Under Audience, tap Audience diversity trend. You can also search for it on the All reports screen.
- Pick a date range (and any options at the top), read the “How to read this” notes, and download any table as CSV.
Privacy
- Collected: Nothing new: it reads the pageviews, events, goals or daily totals you already have
- Not collected: Anything about a single visitor
- Not collected: Links between days: visitor ids still reset at midnight
- No cookies, and nothing stored on the visitor’s device.
- Reports show totals only: never a visitor list, IP address or single visit.
Limits
- Weeks with fewer than 20 visits are left blank
- Up to 92 days and 200,000 pageviews per screen
- Read from the database only when you open it, then kept for 10 minutes
Plans
Every plan, including Free. quietstats is free during launch: the Free plan covers 1 site and 5,000 pageviews a month, and no card is needed. See pricing.
Questions
How is this different from Traffic concentration?
That gives one figure for the range. This shows how the spread changes week by week.
Does it store anything new?
No. It is worked out from the pageviews and events you already have when you open the screen, and only the totals are kept for 10 minutes.
Related
Feature page: Audience diversity trend: spreading out or narrowing? → What it is, why it matters, privacy and how other tools do it.