How to use calendar heatmap: every day of the last year
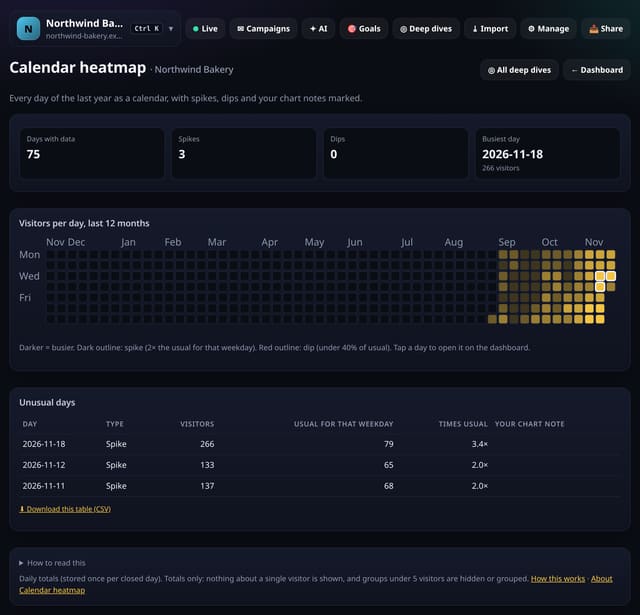
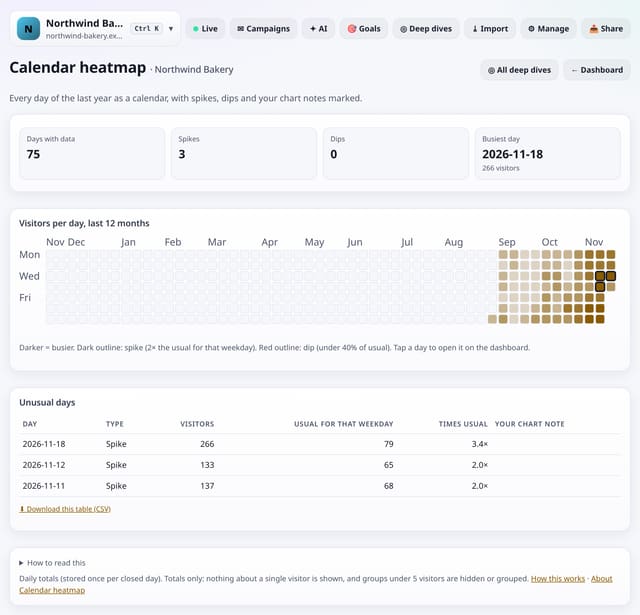
A year-long calendar of daily visitors, shaded by how busy each day was, with spikes, dips and your chart notes marked.
What it does
Each square is one day of the last 12 months, darker when busier. Days with at least twice the usual visitors for that weekday are outlined as spikes, and days under 40% of usual as dips, where usual is the median of the same weekday over the 8 weeks before. Hover or tap for the count and any chart note; tap to open that day on the dashboard. A table lists the unusual days.
Why it matters
A year at a glance shows launches, outages, seasonal runs and quiet spells that a 30-day chart hides.
How to use it
- Open Deep dives → Analysis lab → Calendar heatmap (or go to /app/lab/calendar?site=YOUR_SITE).
- Choose 7, 30 or 90 days; long-range trends read best at 90.
- Download any table with its CSV link; small numbers show as “<5” there too.
How it works
- Open your dashboard, go to Deep dives and scroll to Analysis lab.
- Under Traffic over time, tap Calendar heatmap.
- Pick 7, 30 or 90 days (and any options at the top), read the “How to read this” notes, and download any table as CSV.
Privacy
- Collected: Nothing new: it reads the pageviews (and goals, events or speed checks) you already have
- Not collected: Anything about a single visitor
- Not collected: Links between days: visitor ids still reset at midnight
- No cookies, and nothing stored on the visitor’s device.
- Reports show totals only: never a visitor list, IP address or single visit.
Limits
- Today is never marked as unusual because it is not finished
- Days are UTC calendar days
- Up to 92 days and 200,000 pageviews per screen
- Read from the database only when you open it, then kept for 10 minutes
Plans
Every plan, including Free. quietstats is free during launch: the Free plan covers 1 site and 5,000 pageviews a month, and no card is needed. See pricing.
Questions
What counts as usual?
The median visitors on the same weekday over the 8 weeks before that day.
Why is a day blank?
No data was recorded for it (for example before tracking started).
Related
Feature page: Calendar heatmap: every day of the last year → What it is, why it matters, privacy and how other tools do it.