How to use campaign timeline: when each campaign was active
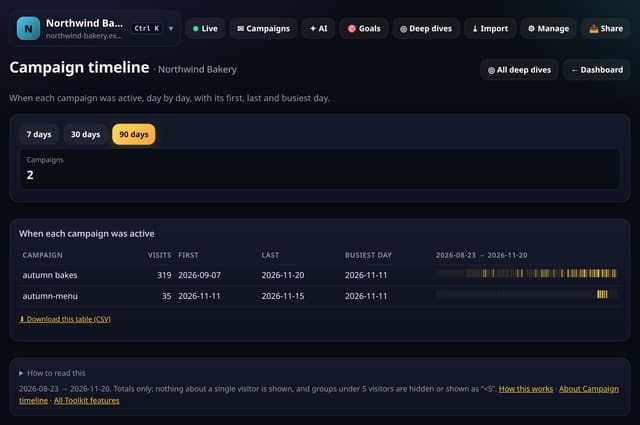
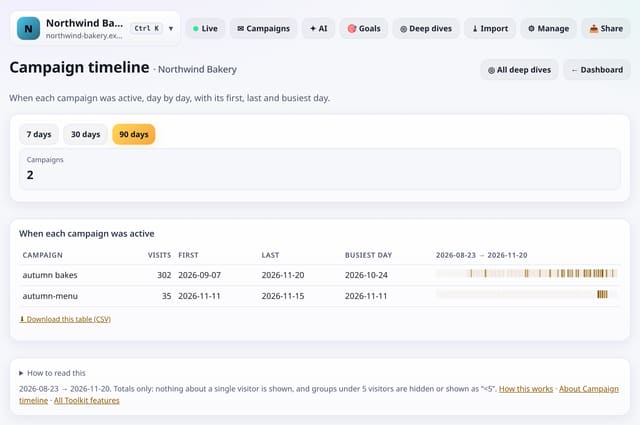
When each campaign brought visits, day by day, with its first, last and busiest day.
What it does
Every campaign with 5 or more visits gets a row with a bar of days. Darker days had more visits. Days with 1 to 4 visits are shown faintly, never exactly.
Why it matters
Campaigns overlap and linger. A timeline shows which ones were running when your numbers moved.
How to use it
- Open Toolkit → Patterns and sums → Campaign timeline, or search “Campaign timeline” on All reports (or go to /app/kit/campaigntimeline?site=YOUR_SITE).
- The default range is 90 days; pick another at the top.
- Download any table with its CSV link; small numbers show as “<5” there too.
How it works
- Open your dashboard and choose Toolkit in the menu (or the Toolkit button on Deep dives, or search for it on All reports).
- Under Patterns and sums, tap Campaign timeline.
- Use the options at the top; nothing is saved unless you press a save button.
Privacy
- Collected: Nothing new from your visitors
- Not collected: Anything about a single visitor
- Not collected: Links between days: visitor ids still reset at midnight
- No cookies, and nothing stored on the visitor’s device.
- Reports show totals only: never a visitor list, IP address or single visit.
Limits
- Default range 90 days
- Up to 92 days and 200,000 pageviews per screen
- Read from the database only when you open it, then kept for 10 minutes
Plans
Every plan, including Free. quietstats is free during launch: the Free plan covers 1 site and 5,000 pageviews a month, and no card is needed. See pricing.
Questions
Does it collect anything new?
No. It works from the pageviews, events and goals you already have, read when you open the screen and kept as totals for 10 minutes. Groups under 5 visitors are never shown exactly.
Related
Feature page: Campaign timeline: when each campaign was active → What it is, why it matters, privacy and how other tools do it.