Report JSON export: any report as a JSON file
CSV is one table at a time.
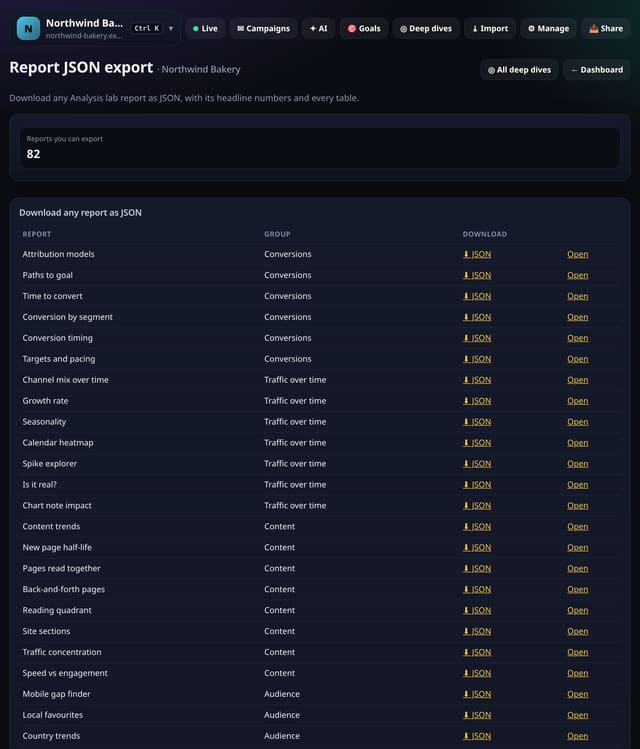
Download any Analysis lab report as JSON, with its headline numbers and every table, for your own tools.
Why quietstats: you get this without cookies, a consent banner or storing IP addresses, in every plan including Free.
In every plan, including Free. Data in and out.
📘 Step-by-step guide, with screenshots and diagrams →
Start free, no cardSee live demo
- No cookies or consent banner
- No IP addresses stored
- Groups under 5 visitors hidden
- 845-byte script
- Free plan, no card
What it is
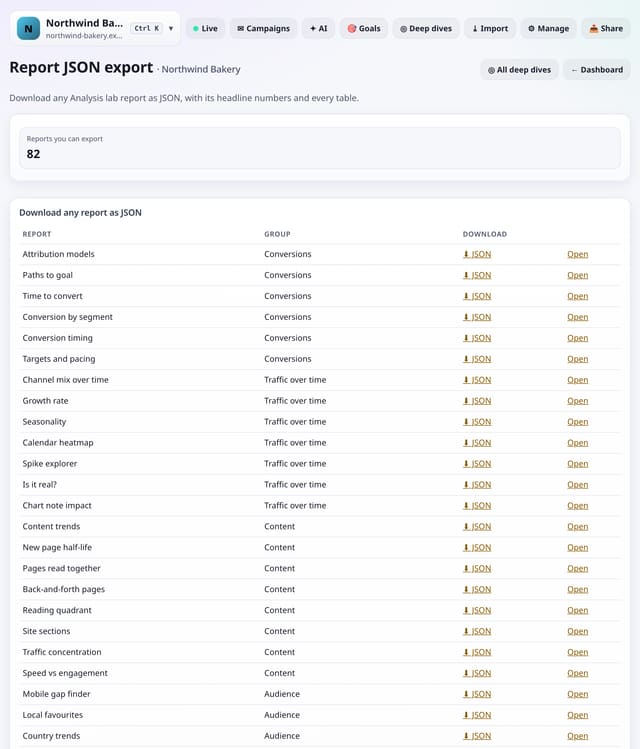
Every Analysis lab report gets a JSON download (add &fmt=json to its address, or use the links on this screen). The file holds the report name, the range, headline numbers and every table with column names, under the same rules as the screen.
Why it matters
CSV is one table at a time. JSON gets the whole report in one file for scripts, notebooks and dashboards.
How it works
- Open your dashboard and choose Toolkit in the menu (or the Toolkit button on Deep dives, or search for it on All reports).
- Under Export and share, tap Report JSON export.
- Use the buttons on the screen; nothing is sent anywhere.
Privacy: what is and isn’t collected
Collected
- Nothing new from your visitors
Never collected
- Anything about a single visitor
- Links between days: visitor ids still reset at midnight
- Cookies, localStorage or anything else stored on the visitor’s device
- IP addresses or user agents (used in memory, then discarded)
- Anything that links a visitor across days (the visitor ID resets daily)
Rows and limits
- Same rules as the screen: totals only, under 5 hidden
- Signed in only: the link works for your own sites
- Read from the database only when you open it, then kept for 10 minutes
“Rows” are database rows written, which is what our hosting is billed on. Reads are not rows written. Methodology →
Questions
Does it collect anything new?
No. It works from the pageviews, events and goals you already have, read when you open the screen and kept as totals for 10 minutes. Groups under 5 visitors are never shown exactly.
Related features
Data in and outStats API
Data in and outGoogle Sheets feed: live numbers with =IMPORTDATA()
Data in and outSetup summary: how the site is set up, on one page
Data in and outSite inventory: every page, event and campaign seen
Data in and outEvent name tidy-up: find look-alike event names
Data in and outGoal health check: is each goal still firing?
Data in and outAll-sites report
See your traffic
All data in and out features → · All features → · Docs: Report JSON export guide → · Compare features with other tools →
Guides on this topic
- Export website analytics data to CSV: a reliable workflow
- Import GA4 history into another analytics tool: what moves
- Website analytics APIs: what to automate and what to protect
- Shopify website analytics: compare built-in reports and external tools
- Wix Analytics vs Google Analytics: why your numbers don't match
Set it up
Nothing to set up: it works with the standard one-line script.
<script data-host="https://quietstats.co.uk" data-dnt="true" src="https://quietstats.co.uk/js/script.js" id="YOUR_SITE_ID" async defer></script>Try it on your own site
Free during launch: one site and 5,000 pageviews a month, no card needed. After launch, paid plans start at £5 a month.