Start free

How to use colour-blind-safe colours: blue and orange

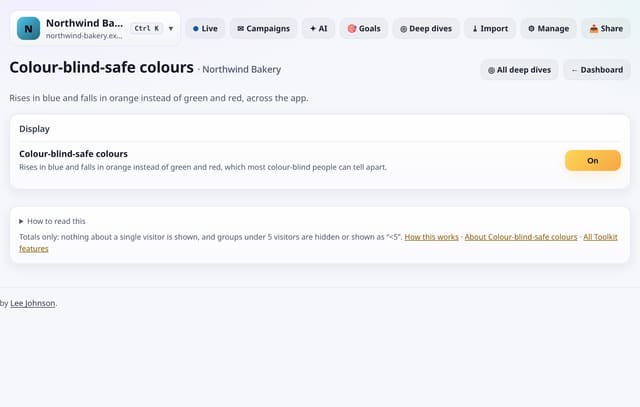
Show rises in blue and falls in orange instead of green and red, across the app.
Dashboard & reportsFeature page: Colour-blind-safe colours: blue and orange
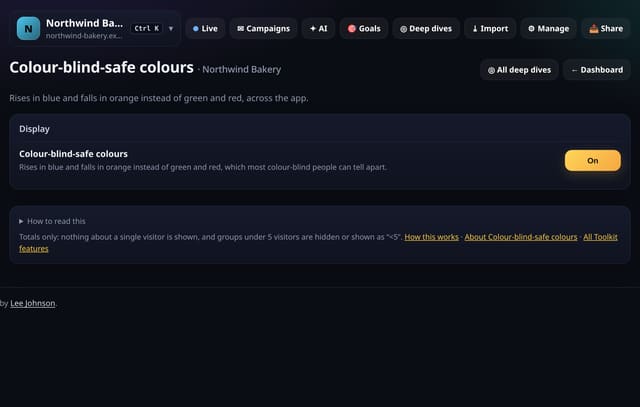
Colour-blind-safe colours: blue and orange: example screenshotColour-blind-safe colours: blue and orange: example screenshot
Example screenshot with made-up data, not a real customer’s numbers.

What it does

Turn it on and the good and bad colours used for changes switch from green and red to blue and orange, in both the dark and light themes.

Why it matters

Red and green are the hardest colours to tell apart for the most common kinds of colour blindness.

How to use it

  1. Open Toolkit → Easier reading → Colour-blind-safe colours, or search “Colour-blind-safe colours” on All reports (or go to /app/kit/colourblind?site=YOUR_SITE).

How it works

How Colour-blind-safe colours works1. You turn the colours on. 2. The choice is kept in this browser. (otherwise: Nothing about a single visitor is read.) 3. Rises show in blue and falls in orange. 4. Both themes are covered.1You turn the colours on.2The choice is kept in thisbrowser.Nothing about asingle visitoris read.3Rises show in blue and fallsin orange.4Both themes are covered.
From src/kit2.js (colourblind) and src/kitdata.js.

Privacy

Limits

Plans

Every plan, including Free. quietstats is free during launch: the Free plan covers 1 site and 5,000 pageviews a month, and no card is needed. See pricing.

Questions

Where is the setting kept?

In this browser only (local storage on quietstats.co.uk, no cookie). Turn it on on each device you use. It works with the dark and light themes and the other display options.

Related

Feature page: Colour-blind-safe colours: blue and orange → What it is, why it matters, privacy and how other tools do it.

Guides on this topic

All website analytics guides →

Related features

Browse all 448 features →

Explore quietstats

See your traffic (119)

Live visitors and live eventsTrend charts, headline cards and any date rangeCompare any two date rangesWorld map, countries and regionsDevices, browsers, operating systems and screens

Sources and campaigns (63)

Sources and channelsAI search referralsUTM campaignsSearch keywords from Google Search ConsoleShort links

Behaviour and content (80)

Top pagesPage transitionsScroll depth and engaged timeClick mapVisitor journeys

Goals, events and conversions (83)

Goals and funnelsCustom events and conversion ratesRevenue cards and revenue by sourceEngagement goalsA/B tests with your own tags and a plain-English confidence note

Reports, sharing and alerts (44)

Alerts inbox and rulesReport snapshotsPassword-protected snapshotsOptional public stats pageAnonymous benchmarks against similar sites

Data in and out (42)

CSV and Excel downloadsStats APIImport from Plausible or GA4API playgroundTSV and XML export for every report

Privacy and performance (17)

Zero cookies, privacy built inUnder 1 KB script and single-page appsPages never countedPrivacy proof page and badge for your siteSigned-in sessions

Why quietstats

Why quietstatsPricingLive demoStart free

Compare

quietstats comparedFeature comparisonvs Google Analyticsvs Plausiblevs Fathom Analyticsvs Simple Analyticsvs Umamivs Matomovs Cloudflare Web Analyticsvs GoatCountervs Piwik PROvs PostHogvs Microsoft Clarityvs Pirsch Analyticsvs MixpanelGoogle Analytics alternatives

Learn

Website analytics guidesMetrics handbookAnalytics glossaryPlaybooksGDPR and cookie-free analyticsInstall on SquarespaceInstall on WixInstall on GhostInstall on Google Tag ManagerBlog

Playbooks and tools

Script size calculatorCookie banner checkerPlaybook: Local businessPlaybook: Online shopPlaybook: Blog or publisherPlaybook: SaaS or appPlaybook: Charity or community groupPlaybook: Agency with clientsUTM link checkerConversion rate calculatorCookie banner traffic-loss calculator