How to use content trends: fading and growing pages
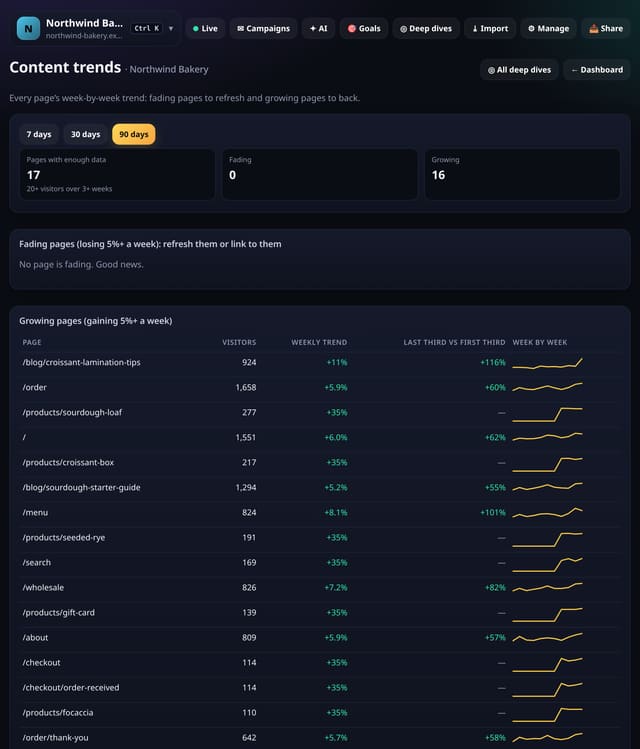
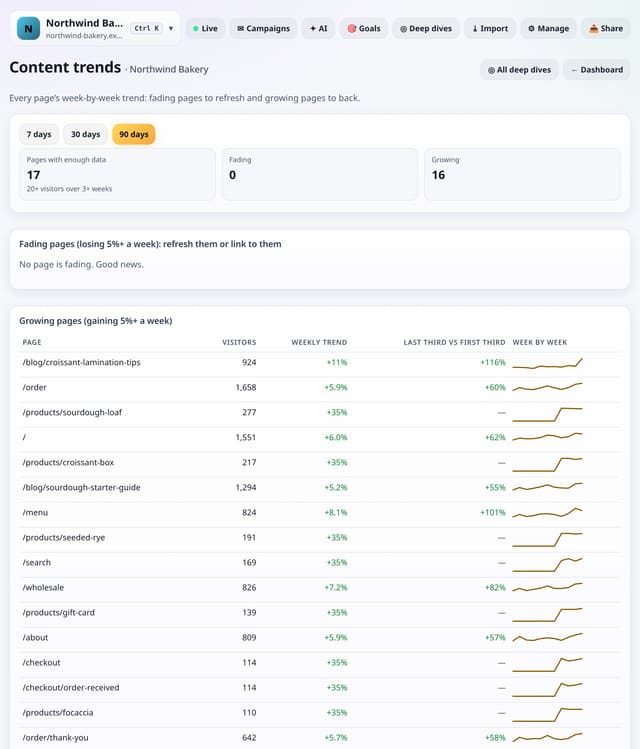
Every page’s week-by-week visitors with a trend line, so you can see which pages are fading and need a refresh and which are growing and deserve backing.
What it does
For pages with 20+ visitors over 3+ weeks, quietstats fits a straight line through weekly visitors (scaled to 7 days) and shows the slope as a share of the page’s average week, plus the last third of the range against the first third and a sparkline. Pages losing 5%+ a week are listed as fading, gaining 5%+ as growing, and the rest as steady.
Why it matters
Content decays quietly. A site-wide list of fading pages is the to-do list for refreshing old posts, and growing pages tell you what to write more of.
How to use it
- Open Deep dives → Analysis lab → Content trends (or go to /app/lab/contenttrends?site=YOUR_SITE).
- Choose 7, 30 or 90 days; long-range trends read best at 90.
- Download any table with its CSV link; small numbers show as “<5” there too.
How it works
- Open your dashboard, go to Deep dives and scroll to Analysis lab.
- Under Content, tap Content trends.
- Pick 7, 30 or 90 days (and any options at the top), read the “How to read this” notes, and download any table as CSV.
Privacy
- Collected: Nothing new: it reads the pageviews (and goals, events or speed checks) you already have
- Not collected: Anything about a single visitor
- Not collected: Links between days: visitor ids still reset at midnight
- No cookies, and nothing stored on the visitor’s device.
- Reports show totals only: never a visitor list, IP address or single visit.
Limits
- Needs 20+ visitors over 3+ weeks per page; use 90 days for the clearest picture
- Weeks before your first data are left out
- Up to 92 days and 200,000 pageviews per screen
- Read from the database only when you open it, then kept for 10 minutes
Plans
Every plan, including Free. quietstats is free during launch: the Free plan covers 1 site and 5,000 pageviews a month, and no card is needed. See pricing.
Questions
How is this different from the decay warning on a page?
The page deep dive warns about one page. This lists every page on the site, fading and growing.
What should I do with a fading page?
Update it, improve its title, or link to it from a growing page.
Related
Feature page: Content trends: fading and growing pages → What it is, why it matters, privacy and how other tools do it.