Topic reports: how each part of your content performs over time
Single pages come and go.
Treat each content group, category or site section as a topic and see its share of traffic week by week, how it changed, how engaged its readers are and how often they go on to complete a goal.
Why quietstats: you get this without cookies, a consent banner or storing IP addresses, in every plan including Free.
In every plan, including Free. Behaviour and content.
📘 Step-by-step guide, with screenshots and diagrams →
Start free, no cardSee live demo
- No cookies or consent banner
- No IP addresses stored
- Groups under 5 visitors hidden
- 845-byte script
- Free plan, no card
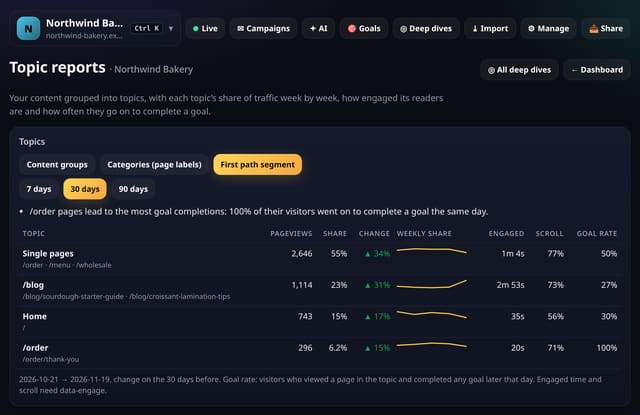
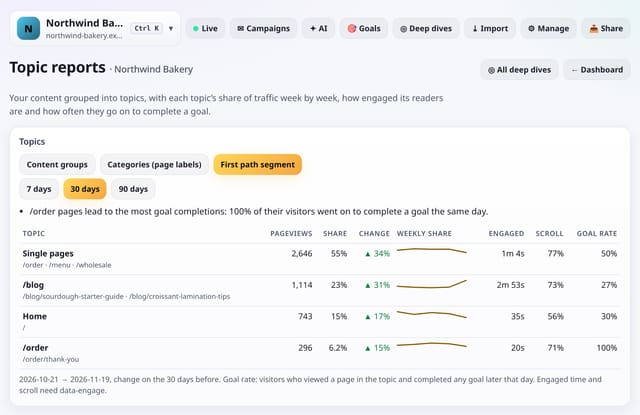
What it is
Topic reports build on content groups. Pick how topics are made: your content groups (such as Blog = /blog/*), categories from the optional page labels script, or simply the first part of each path (/blog, /docs, /products). For each topic you get pageviews, visitors, share of all pageviews, change on the period before, a weekly share line, average engaged time and scroll depth, the goal rate (visitors who viewed a topic page and completed a goal the same day) and its top three pages, with plain-English notes on the biggest movers.
Why it matters
Single pages come and go. Topics show whether your blog, docs or product pages as a whole are gaining ground, and which kind of content actually leads to sign-ups and orders.
How it works
- Open Deep dives and choose Topic reports.
- Choose Content groups, Categories (page labels) or First path segment, and 7, 30 or 90 days (90 is the default).
- Read the notes first, then the table. To change the groups, edit them on the dashboard’s Content groups card.
Privacy: what is and isn’t collected
Collected
- Nothing new: pageviews, optional engagement data, goals and your content-group rules or page labels
Never collected
- Anything about a single visitor
- Cookies, localStorage or anything else stored on the visitor’s device
- IP addresses or user agents (used in memory, then discarded)
- Anything that links a visitor across days (the visitor ID resets daily)
Rows and limits
- Up to 92 days; very busy ranges use the first 200,000 pageviews
- Up to 15 topics are shown, largest first
- Goal rate counts the same visitor-day only
- D1: one read of this range and the one before, cached for 10 minutes
“Rows” are database rows written, which is what our hosting is billed on. Reads are not rows written. Methodology →
Questions
Do I have to set up content groups?
No. Without groups, First path segment groups pages by the first part of their address, such as /blog.
Is this the same as the Content groups card?
It uses the same groups. The card shows this range; topic reports add weekly share, change, engagement and goal rate.
Where do categories come from?
From the optional labels script: add data-category to your pages and each category becomes a topic.
Related features
Behaviour and contentAuthor and category reports
See your trafficPage deep dive: everything about one page on one screen
Behaviour and contentPage versions: one page before and after a change
Behaviour and contentContent trends: fading and growing pages
Behaviour and contentOn-site search terms
Behaviour and contentPinned reports: your reports at the top
See your trafficRecently viewed reports: get back in one tap
See your traffic
All behaviour and content features → · All features → · Docs: Topic reports guide → · Compare features with other tools →
Guides on this topic
Set it up
Nothing to set up: it works with the standard one-line script.
<script data-host="https://quietstats.co.uk" data-dnt="true" src="https://quietstats.co.uk/js/script.js" id="YOUR_SITE_ID" async defer></script>Try it on your own site
Free during launch: one site and 5,000 pageviews a month, no card needed. After launch, paid plans start at £5 a month.