How to use topic reports
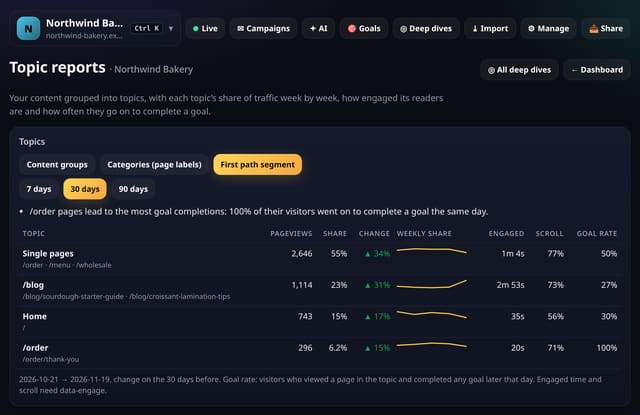
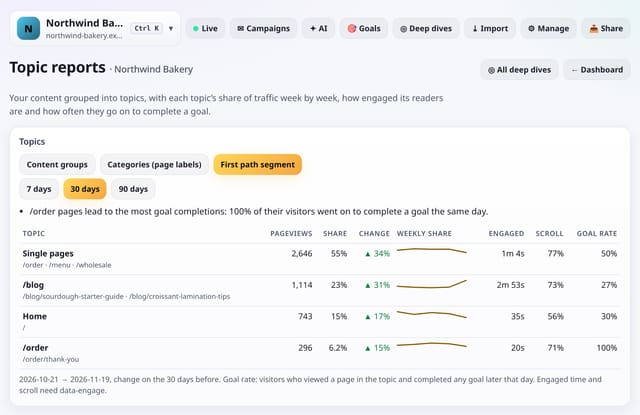
Treat each content group, category or site section as a topic and see its share of traffic week by week, how it changed, how engaged its readers are and how often they go on to complete a goal.
What it does
Topic reports build on content groups. Pick how topics are made: your content groups (such as Blog = /blog/*), categories from the optional page labels script, or simply the first part of each path (/blog, /docs, /products). For each topic you get pageviews, visitors, share of all pageviews, change on the period before, a weekly share line, average engaged time and scroll depth, the goal rate (visitors who viewed a topic page and completed a goal the same day) and its top three pages, with plain-English notes on the biggest movers.
Why it matters
Single pages come and go. Topics show whether your blog, docs or product pages as a whole are gaining ground, and which kind of content actually leads to sign-ups and orders.
How to use it
- Tap ◎ Deep dives, then Topic reports.
- Choose how topics are made: Content groups, Categories (page labels) or First path segment.
- Pick 7, 30 or 90 days and read the notes on the biggest movers.
- Change your groups on the dashboard’s Content groups card; the report follows them.
How it works
- Open Deep dives and choose Topic reports.
- Choose Content groups, Categories (page labels) or First path segment, and 7, 30 or 90 days (90 is the default).
- Read the notes first, then the table. To change the groups, edit them on the dashboard’s Content groups card.
Privacy
- Collected: Nothing new: pageviews, optional engagement data, goals and your content-group rules or page labels
- Not collected: Anything about a single visitor
- No cookies, and nothing stored on the visitor’s device.
- Reports show totals only: never a visitor list, IP address or single visit.
Limits
- Up to 92 days; very busy ranges use the first 200,000 pageviews
- Up to 15 topics are shown, largest first
- Goal rate counts the same visitor-day only
- D1: one read of this range and the one before, cached for 10 minutes
Plans
Every plan, including Free. quietstats is free during launch: the Free plan covers 1 site and 5,000 pageviews a month, and no card is needed. See pricing.
Questions
Do I have to set up content groups?
No. Without groups, First path segment groups pages by the first part of their address, such as /blog.
Is this the same as the Content groups card?
It uses the same groups. The card shows this range; topic reports add weekly share, change, engagement and goal rate.
Where do categories come from?
From the optional labels script: add data-category to your pages and each category becomes a topic.
Related
Feature page: Topic reports: how each part of your content performs over time → What it is, why it matters, privacy and how other tools do it.