Week report card: last week graded A to E
A grade is quicker to read than a chart, and fair to your own history rather than to someone else’s site.
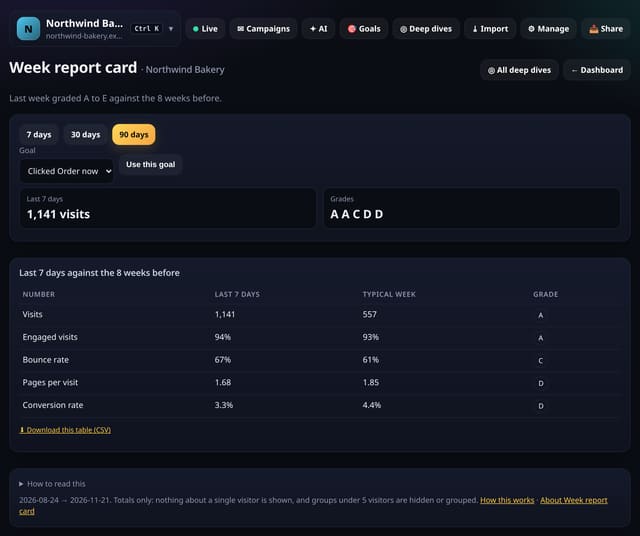
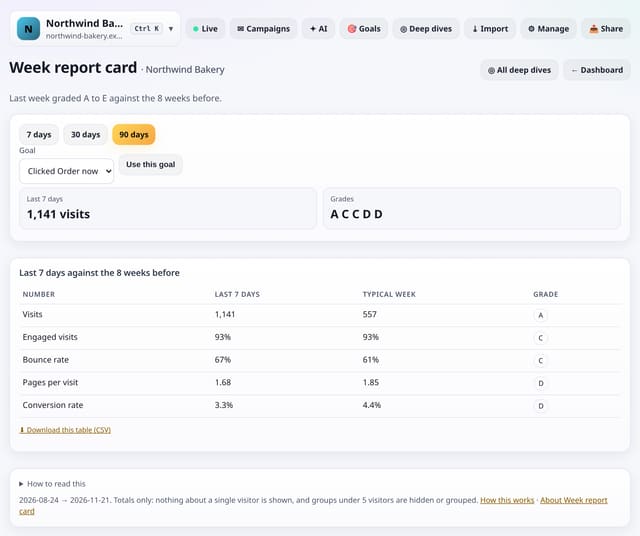
Visits, engaged visits, bounce rate, pages per visit and (with a goal) conversion rate for the last 7 days, each graded against the 8 weeks before.
Why quietstats: you get this without cookies, a consent banner or storing IP addresses, in every plan including Free.
In every plan, including Free. Reports, sharing and alerts.
📘 Step-by-step guide, with screenshots and diagrams →
Start free, no cardSee live demo
- No cookies or consent banner
- No IP addresses stored
- Groups under 5 visitors hidden
- 845-byte script
- Free plan, no card
What it is
quietstats splits the range into 7-day blocks ending yesterday and grades the latest against up to 8 earlier weeks: A if better than 7 of 8, C in the middle, E if worse than all. For bounce rate, lower is better.
Why it matters
A grade is quicker to read than a chart, and fair to your own history rather than to someone else’s site.
How it works
- Open your dashboard, go to Deep dives (or Reports on a phone) and open Analysis lab.
- Under Tools, tap Week report card. You can also search for it on the All reports screen.
- Pick a date range (and any options at the top), read the “How to read this” notes, and download any table as CSV.
Privacy: what is and isn’t collected
Collected
- Nothing new: it reads the pageviews, events, goals or daily totals you already have
Never collected
- Anything about a single visitor
- Links between days: visitor ids still reset at midnight
- Cookies, localStorage or anything else stored on the visitor’s device
- IP addresses or user agents (used in memory, then discarded)
- Anything that links a visitor across days (the visitor ID resets daily)
Rows and limits
- Needs the last 7 days and at least 4 of the 8 weeks before, each with 5 or more visits
- Up to 92 days and 200,000 pageviews per screen
- Read from the database only when you open it, then kept for 10 minutes
“Rows” are database rows written, which is what our hosting is billed on. Reads are not rows written. Methodology →
Questions
Why 90 days?
Grading needs 8 earlier weeks; 90 days covers them.
Does it store anything new?
No. It is worked out from the pageviews and events you already have when you open the screen, and only the totals are kept for 10 minutes.
Related features
Reports, sharing and alertsWeek ranking: how this week compares with the year
Reports, sharing and alertsAnnotated monthly report, ready to print or save as PDF
Reports, sharing and alertsSave the trend chart as an image
Reports, sharing and alertsMedia kit numbers: rounded figures for sponsors and press
Reports, sharing and alertsPrint and PDF reports
Reports, sharing and alertsAnnual run rate: visitors a year at your current pace
Reports, sharing and alertsAll-sites report
See your traffic
All reports, sharing and alerts features → · All features → · Docs: Week report card guide → · Compare features with other tools →
Guides on this topic
Set it up
Nothing to set up: it works with the standard one-line script.
<script data-host="https://quietstats.co.uk" data-dnt="true" src="https://quietstats.co.uk/js/script.js" id="YOUR_SITE_ID" async defer></script>Try it on your own site
Free during launch: one site and 5,000 pageviews a month, no card needed. After launch, paid plans start at £5 a month.