How to use annotated monthly report (print or PDF)
A one-month report for any of your sites with the numbers, the charts and plain-English notes on what changed and why. Print it or save it as a PDF for a client or your boss, with your agency branding when you have it.
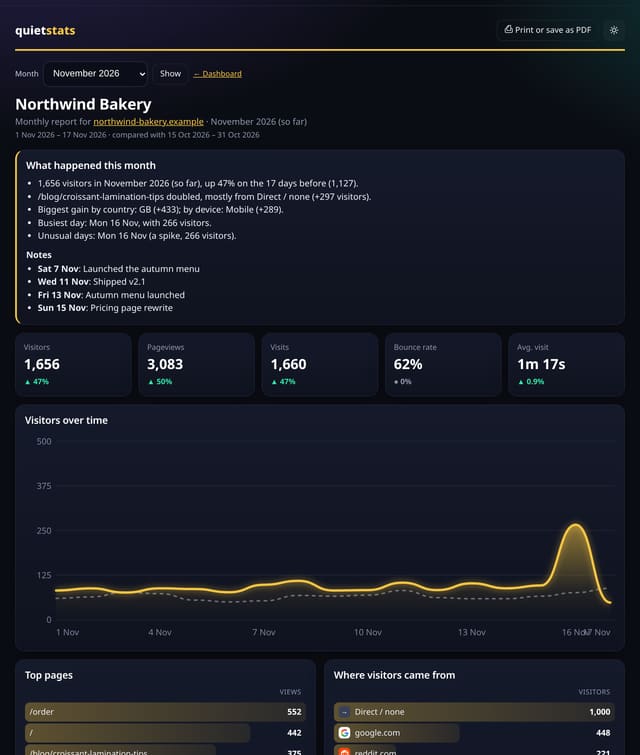
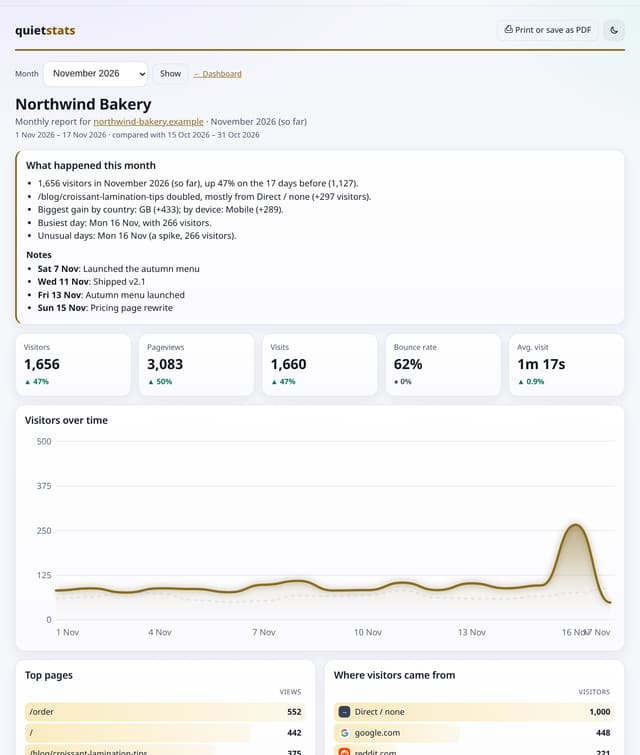
What it does
Tap Monthly report on your dashboard and pick a month. You get visitors, pageviews, visits, bounce rate and visit length against the period before, the daily chart, top pages, sources, countries, devices and goals, plus a What happened this month box: which pages and sources drove the change, the busiest day, unusual days, and the chart notes you added that month. If your account has agency branding, the report uses your name, colour and logo.
Why it matters
A monthly report is what clients and managers actually read. Having the story written for you saves the hour of copying charts into a document.
How to use it
- On your dashboard, tap Monthly report next to Print or PDF.
- Choose the month and tap Show. It starts on the last full month.
- Read What happened this month at the top: the pages and sources behind the change, the busiest day, unusual days and your own chart notes.
- Tap Print or save as PDF and send the file yourself. Nothing is ever sent for you.
How it works
- On your dashboard, tap Monthly report (next to Print or PDF), or open /app/report/<site>.
- Pick a month. It defaults to the last full month; the current month shows so far.
- Tap Print or save as PDF. The print layout is A4 and always light, whatever theme is on screen.
- Send the PDF yourself. quietstats never sends the report anywhere and nothing is scheduled.
Privacy
- Collected: Nothing new: it reads your existing totals, goals and chart notes
- Not collected: Anything about a single visitor
- Not collected: A copy of the report (it is made when you open it and not stored)
- Not collected: Email addresses (it is never emailed)
- No cookies, and nothing stored on the visitor’s device.
- Reports show totals only: never a visitor list, IP address or single visit.
Limits
- Generated on request only; nothing is scheduled, stored or sent
- One site per report; for a client folder use the agency report links
- Agency branding needs an agency plan or the agency preview
- The PDF is made by your browser’s print dialog
Plans
Every plan, including Free. quietstats is free during launch: the Free plan covers 1 site and 5,000 pageviews a month, and no card is needed. See pricing.
Questions
Can it email the report to my client every month?
No. It is made only when you open it, and you send the PDF yourself. Nothing is sent automatically.
Where do the notes come from?
Fixed rules over your daily totals: the pages and sources that moved most, the busiest day, unusual spikes or dips, and your own chart notes. No AI is used.
Will it show my agency logo?
Yes, when your account has agency branding set up on the Agency page.
Related
Feature page: Annotated monthly report, ready to print or save as PDF → What it is, why it matters, privacy and how other tools do it.