Compare two segments side by side
An average hides the groups inside it.
Put two groups of visitors next to each other, such as mobile visitors from Google against desktop visitors, or people sent by ChatGPT against everyone else, and see how they differ.
Why quietstats: you get this without cookies, a consent banner or storing IP addresses, in every plan including Free.
In every plan, including Free. See your traffic.
📘 Step-by-step guide, with screenshots and diagrams →
Start free, no cardSee live demo
- No cookies or consent banner
- No IP addresses stored
- Groups under 5 visitors hidden
- 845-byte script
- Free plan, no card
What it is
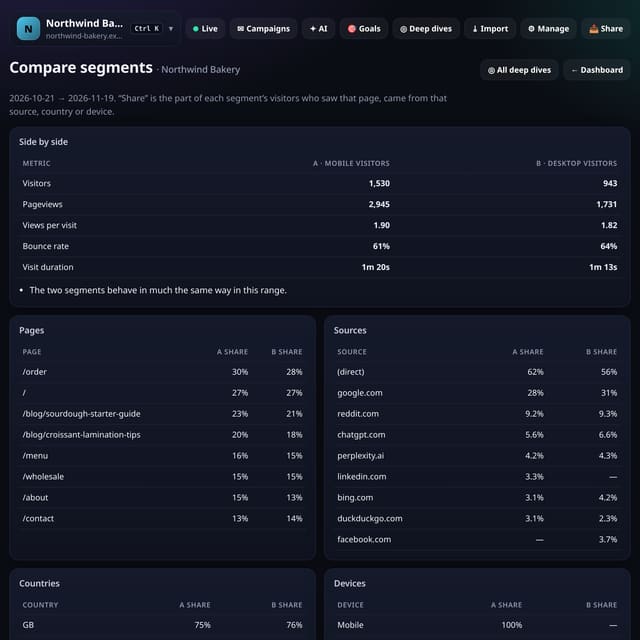
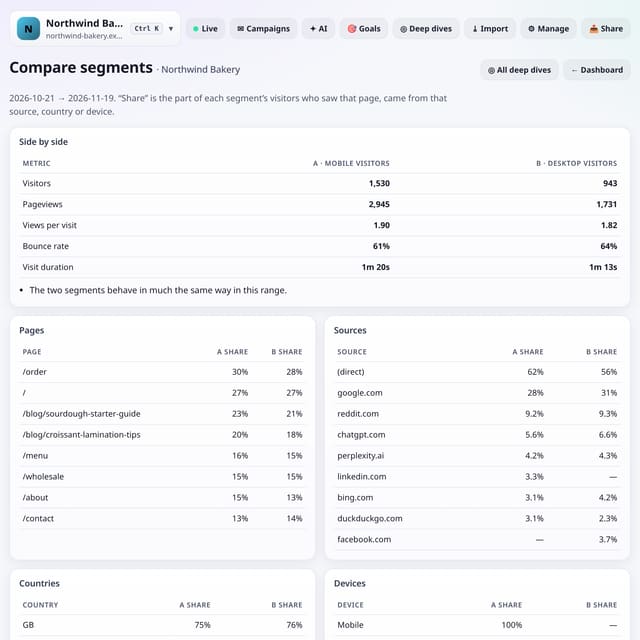
Pick two saved segments, or type any combination of filters for each one (device, source, country, region, page, browser, OS, UTM tags, search term and language, joined with ;). quietstats shows visitors, pageviews, views per visit, bounce rate and visit duration for both, the share of each segment that saw each top page, came from each source, country and device, and a few plain-English lines on the differences that matter.
Why it matters
An average hides the groups inside it. Comparing two segments shows which visitors read more, leave sooner or land somewhere else, so you know where to put your effort.
How it works
- Open Deep dives and choose Compare segments, or tap ⇆ Compare two in the dashboard’s Saved row.
- Choose segment A and segment B from your saved segments, or type a combination such as device==Mobile;country==GB.
- Read the side-by-side totals and the plain-English notes, then the pages, sources, countries and devices tables.
Privacy: what is and isn’t collected
Collected
- Nothing new: it uses the pageviews you already collect
Never collected
- Anything about a single visitor
- Your filters (only saved segments you choose to save are stored)
- Cookies, localStorage or anything else stored on the visitor’s device
- IP addresses or user agents (used in memory, then discarded)
- Anything that links a visitor across days (the visitor ID resets daily)
Rows and limits
- Up to 92 days per comparison
- Notes are only written when both segments have at least 20 visitors
- Imported history is not included
- D1: each comparison reads the range once per segment; results are cached for 10 minutes
“Rows” are database rows written, which is what our hosting is billed on. Reads are not rows written. Methodology →
Questions
How do I combine filters?
Join them with ; and every one must match, for example device==Mobile;referrer~=google. Use | for “or” inside one filter, such as country==GB|IE.
Can I save a combination?
Yes. Build it with + Filter on the dashboard and tap ★ Save segment. It then appears in both pickers.
Is one segment allowed to be everyone?
Yes. Leave a picker on All visitors to compare a segment with your whole audience.
Related features
Data in and outClick any row to filter the dashboard
See your trafficCompare any two date ranges
See your trafficPlaces: regions and optional city totals, with small places hidden
See your trafficCustom dashboards: your cards, your order, several per site
See your trafficMetrics handbook
See your trafficSite health: uptime, speed and Core Web Vitals in one card
See your trafficCompare with another tool: why the numbers differ
Data in and out
All see your traffic features → · All features → · Docs: Compare two segments side by side guide → · Compare features with other tools →
Guides on this topic
Set it up
Nothing to set up: it works with the standard one-line script.
<script data-host="https://quietstats.co.uk" data-dnt="true" src="https://quietstats.co.uk/js/script.js" id="YOUR_SITE_ID" async defer></script>Try it on your own site
Free during launch: one site and 5,000 pageviews a month, no card needed. After launch, paid plans start at £5 a month.