How to use why did this change?
Tap a spike or a dip on your trend chart and see which pages, sources, countries and devices made the difference.
What it does
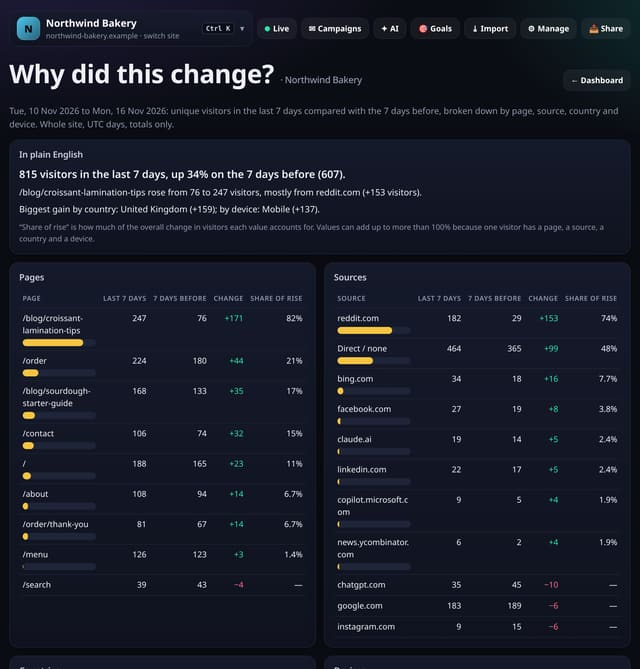
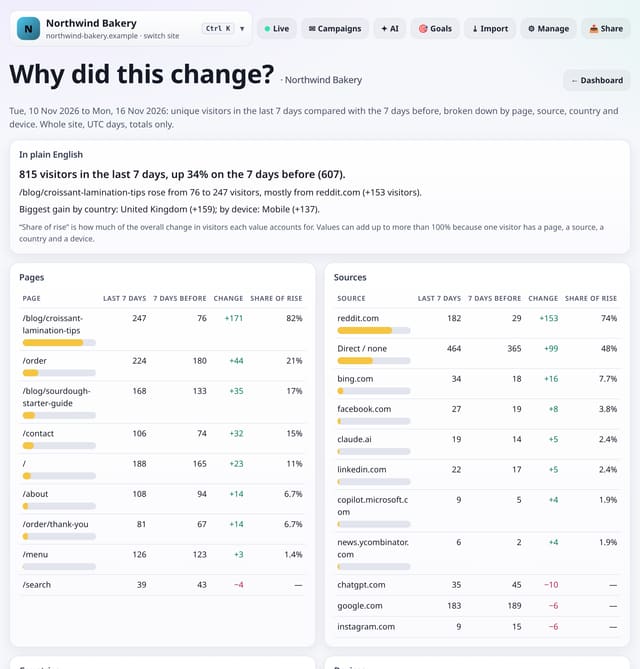
Every unusual day under the trend chart now has a Why did this change? link. It opens a breakdown of that day against an average day in the week before: a plain-English summary, then the pages, sources, countries and devices that moved the most, with each one’s share of the rise or fall. You can pick any other day, or explain the last 7 days against the 7 before.
Why it matters
A spike alert tells you something happened. The breakdown tells you it was one Hacker News post landing on /launch, mostly from phones in the United States, in one tap.
How to use it
- On your dashboard, open Unusual days under the Trend chart and tap Why did this change? next to a spike or a drop.
- Read the summary first, then the four tables: pages, sources, countries and devices, each with that day, an average day before it, the change and its share.
- Pick a day to explain any other date, or Explain the last 7 days to compare with the week before.
How it works
- Open your dashboard and the Unusual days list under the Trend chart, then tap Why did this change? next to a spike or a drop. The weekly insight card links the 7-day version.
- quietstats counts unique daily visitors per page, source, country and device on that day and in the 7 days before, and divides the baseline by 7 to get an average day.
- Each row shows that day, the average day, the change and its share of the overall change. New values are tagged new.
- Use Pick a day to explain any other day, or Explain the last 7 days.
Privacy
- Collected: Nothing new: it reads the pageviews you already collect
- Not collected: Anything about a single visitor
- Not collected: Any text sent to an AI service
- No cookies, and nothing stored on the visitor’s device.
- Reports show totals only: never a visitor list, IP address or single visit.
Limits
- Reads only, and only when you open it: 5 grouped counts
- Up to 8 values per breakdown, plus up to 3 that went the other way
- UTC days, whole site
- Core script.js is unchanged (845 B)
- No migration
Plans
Every plan, including Free. quietstats is free during launch: the Free plan covers 1 site and 5,000 pageviews a month, and no card is needed. See pricing.
Questions
Why can the shares add up to more than 100%?
Because every visitor has a page, a source, a country and a device at the same time. Each table adds up on its own.
Can I use it on a normal day?
Yes. Pick any day, or explain the last 7 days.
Is this AI?
No. It is arithmetic on your daily totals, turned into sentences by fixed rules.
Related
- Plain-English weekly insight
- Trend chart, headline numbers and date ranges
- Spike and drop markers and alerts
- All dashboard & reports guides
Feature page: Why did this change? → What it is, why it matters, privacy and how other tools do it.