How to use plain-English weekly insight
A short note at the top of your dashboard that says what changed this week and why, such as “/pricing doubled, mostly from reddit.com”.
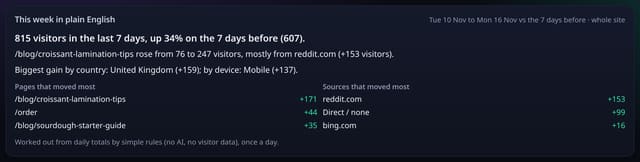
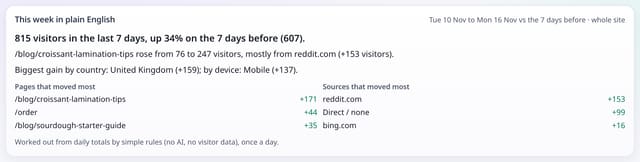
What it does
The This week in plain English card compares the last 7 full days with the 7 days before. It names the page, the source, the country and the device that moved your visitor total the most, and lists the pages and sources that moved most. It is built by simple rules from the daily totals you already have. There is no AI call and no visitor data.
Why it matters
Charts tell you that something changed. A sentence tells you what to look at first, so you can spot the post, the link or the page that is working without digging through every card.
How to use it
- Open your dashboard. This week in plain English sits above The story so far.
- Read the first line for the overall change, then the page and source behind it. The two short lists show the pages and sources that moved most, with + or − visitors.
- The card covers the last 7 full days against the 7 before, for the whole site. It refreshes once a day.
How it works
- Open your dashboard. The card sits above The story so far and always covers the whole site for the last 7 full days (UTC), whatever range or filter you picked.
- For each of page, source, country and device, quietstats counts unique daily visitors in both weeks and finds the values that pushed the total up (or down) the most.
- The sentences come from fixed rules: the overall change, then the page and source behind it, then the biggest gain or drop by country and device.
- It is worked out the first time you open the dashboard on a day and kept for the rest of that day.
Privacy
- Collected: Nothing new: it reads the pageviews you already collect
- Not collected: Anything about a single visitor
- Not collected: Any text sent to an AI service
- No cookies, and nothing stored on the visitor’s device.
- Reports show totals only: never a visitor list, IP address or single visit.
Limits
- One cached row per site, refreshed at most once a day (1 write)
- A normal dashboard view adds 1 primary-key read
- Last 7 full UTC days against the 7 days before
- Core script.js is unchanged (845 B)
- Migration 0054, additive
Plans
Every plan, including Free. quietstats is free during launch: the Free plan covers 1 site and 5,000 pageviews a month, and no card is needed. See pricing.
Questions
Is this written by an AI?
No. Fixed rules turn the numbers into sentences, so the same numbers always give the same words, and nothing leaves quietstats.
Does it replace The story so far?
No. The story card, its next step and the weekly email preview stay as they are. The weekly insight is a short extra card above it.
Why does it ignore my date range?
So the card always answers the same question: what changed this week compared with last week.
Related
- The story so far
- Trend chart, headline numbers and date ranges
- What changed
- All dashboard & reports guides
Feature page: Plain-English weekly insight → What it is, why it matters, privacy and how other tools do it.