How to use glossary and dashboard tooltips
Hover the small question mark on any headline number to see what it means; click it for the full glossary of analytics words in plain English.
What it does
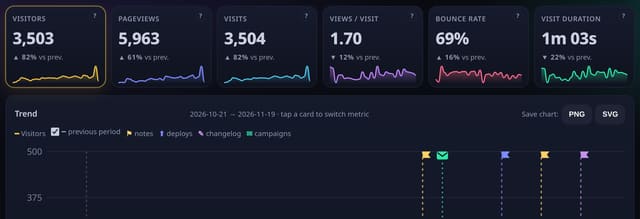
Each of the six headline numbers on the dashboard (visitors, pageviews, visits, views per visit, bounce rate and visit duration) has a small question mark. Hover or focus it for a one-line definition; click it to open that term in the glossary at /glossary, which defines 30 analytics words from A/B test to visitor, each with a link to more detail.
Why it matters
Analytics has its own jargon, and cookie-free counting uses some words differently. A definition one click away stops misreadings before they become decisions.
How to use it
- On the dashboard, hover or tab to the ? in the corner of a headline number.
- Read the one-line definition in the tooltip.
- Click the ? to open /glossary at that term in a new tab.
- Browse /glossary for all 30 terms.
How it works
- Hover or tab to the ? on a headline number for its definition.
- Click it to open the glossary in a new tab, right at that term.
- Follow “More” to the handbook or feature page.
Privacy
- Collected: Nothing new
- Not collected: Which tooltips anyone opens
- No cookies, and nothing stored on the visitor’s device.
- Reports show totals only: never a visitor list, IP address or single visit.
Limits
- Tooltips are on the six headline numbers; other cards link to their feature pages
Plans
Every plan, including Free. quietstats is free during launch: the Free plan covers 1 site and 5,000 pageviews a month, and no card is needed. See pricing.
Questions
Do the question marks appear on shared dashboards?
Yes, on the public demo and shared stats pages too, so anyone you share with can look up a word.
Can I link to one term?
Yes, for example /glossary#bounce-rate.
Related
Feature page: Glossary and dashboard tooltips → What it is, why it matters, privacy and how other tools do it.